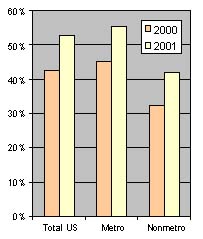
During the 1990s, an increasing share of US households became digitally connected to the vast amount of information available on the Internet. United States Bureau of Census data indicate that between August 2000 and September 2001 alone, the percentage of all households with Internet connections increased dramatically ( Figure 1). At the same time, disparities in Internet access and use emerged among various segments of the population. Recent studies show that Whites have greater access to and use of the Internet than Blacks and non-Hispanics show greater use than Hispanics (Compaine, 2001; National Telecommunications and Information Administration and Economics Statistics Administration [NTIA], 2002). More educated and higher income individuals also show greater Internet use (NTIA, 2002). Although household use has increased regardless of location, the gap in use between metropolitan and nonmetropolitan areas has remained at about 13%. 1 These differences in Internet use reflect the "digital divide." Characterizing the Divide
Concerns exist that the metropolitan-nonmetropolitan digital divide may widen regional differences in household well-being (Drabenstott, 2001). As a result, the digital divide has been the focus of several policy initiatives. The Rural Access Authority in North Carolina, for example, was created to provide local dial-up Internet access from every telephone exchange in the state. Other states (such as Washington and Virginia) have provided grants to rural areas to promote high-speed Internet access. Other initiatives have supported infrastructure investments in low-density regions. These policies will only stimulate home Internet use in nonmetropolitan areas if the current digital divide stems from differences in infrastructure for Internet connectivity between the two areas.
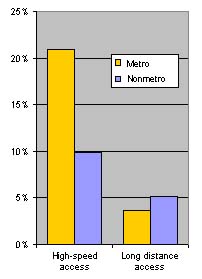
Digital infrastructure between metropolitan and nonmetropolitan areas can differ considerably. Greenman (2000) reports that less than one percent of towns with fewer than 10,000 persons have digital subscriber line (DSL) or cable modem services. On the other hand, 86% of cities with more than 100,000 persons have digital subscriber lines, and 72% of cities with more than 250,000 persons have cable modem services. The 2001 Current Population Survey (CPS) data also suggest that infrastructure differences may be contributing to the digital divide. For example, 9.9% of nonmetropolitan household Internet users had high-speed connections, compared to 20.9% of metropolitan users (Figure 2).2 On the other hand, nonmetropolitan users are only slightly more reliant on long-distance carriers to obtain Internet access, suggesting minimal differences in carrying costs between the two areas.
Differences in education, income, and other household attributes, rather than technology, may drive differences in metropolitan and nonmetropolitan region use. In this case, closing the divide would involve broader efforts to increase education and income in nonmetropolitan areas. Ensuring school children equal access to digital technology is also essential to avoid passing digital knowledge gaps to the next generation. We next explore how differences in education, income, and other household attributes influence the digital divide in home Internet use.
The Role of Income and Education
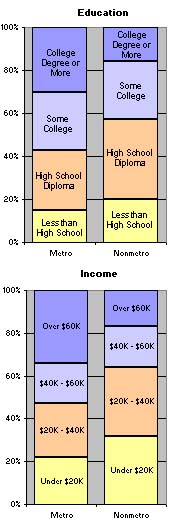
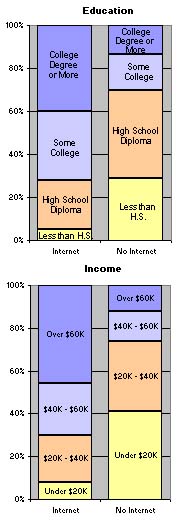
Nonmetropolitan areas trail metropolitan areas in both household income and household head education (Figure 3). Income and education levels are also higher in Internet-using households (Figure 4). Thus, income and education levels are likely to explain much of the digital divide.
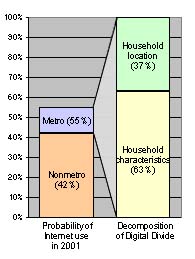
Our econometric analysis indicates that 63% of the digital divide is due to area differences in household characteristics (Figure 5). The remaining 37% is linked to differences in the propensities of households with otherwise similar characteristics to use the Internet at home in metropolitan and nonmetropolitan areas.
Given the strong local composition of many online communities (Horrigan, 2001), a household's value of Internet access tends to increase as the share of other connected households (and businesses) in the same region increases. Adding regional density of home Internet use along with household characteristics explains 91.2% of the digital divide. Thus, household attributes and regional rates of household Internet use account for most of the digital divide.
Regional differences in Internet use could decline over time because of normal adoption patterns. The current findings, however, about the importance of differences in income and education on Internet use suggest greater persistence in the gap.
Policy Implications
Policy options to address the metropolitan-nonmetropolitan digital divide must be linked to the narrowing of income and educational disparities rather than focusing solely on digital infrastructure. Programs to increase general access for underserved populations also are important. Public support for such initiatives is currently weak. The two major federal program initiatives (The Technology Opportunities Program and Community Technology Centers) to foster Internet use by underserved populations are losing their funding (Harris and Associates, 2002).
Thanks to public investments, Internet access in the nation's schools is far more uniform across race and income groups than use at home (Newburger, 2001; NTIA 2002). Similarly, the CPS data indicate that the current rate of Internet use by children at school is higher in nonmetropolitan areas than in metropolitan areas. School access is considered essential to avoid transferring the digital divide to future generations. A similar commitment to reduce disparities within the adult population is a policy choice.
Notes
1 This paper uses 1993 US Census designations of nonmetropolitan and metropolitan counties to compare differences in home Internet use. Metropolitan counties generally have populations greater than 100,000 (75,000 in New England) or a town or city of at least 50,000. Nonmetropolitan counties are those counties not classified as metropolitan.
2 High-speed access is often more important for business applications than home applications.
For More Information
Compaine, B.M. (Ed.). (2001). The digital divide: Facing a crisis or creating a myth? London: MIT Press.
Drabenstott, M. (2001). New policies for a new rural America. International Regional Science Review, 24(1), 3-15.
Greenman, C. (2000, May 18). Life in the slow lane: Rural residents are frustrated by sluggish web Access and a scarcity of local information online. New York Times, p. D1.
Harris and Associaties. (2002). Bringing a nation online: The importance of federal leadership. Washington DC: Leslie Harris and Associates.
Horrigan, J.B. (2001). Online communities: Networks that nurture long-distance relationships and local ties. Pew Internet & American Life Project. Available on the World Wide Web: http://pewinternet.org.
National Telecommunications and Information Administration and Economics Statistics Administration. (2000). Falling through the net: Towards digital inclusion. Washington, DC: United States Department of Commerce.
National Telecommunications and Information Administration and Economics Statistics Administration. (2002). How Americans are expanding their use of the internet. Washington, DC: United States Department of Commerce.
Newberger, E.C. (2001). Home computers and internet use in the United States (Special Study P23-207). Washington, DC: United States Department of Commerce.
United States Department of Commerce Bureau of Census. (2001). Current population survey, September 2001: Internet and computer use supplement [computer file]. Washington, DC: United States Department of Commerce.
|