Relationships between Payments Received and Farm Household Well-Being
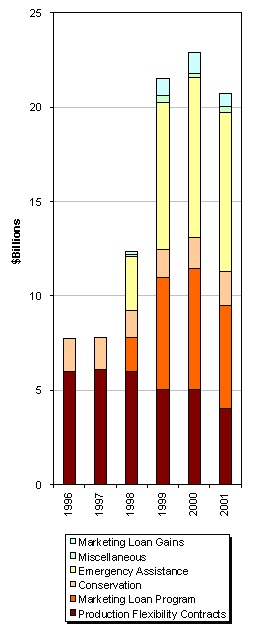
Government payments to farmers increased from about $7.5 billion in 1996—the year the "Freedom to Farm" bill was enacted—to over $20 billion in 1999, 2000, and 2001. This increase stemmed from a drop in agricultural prices, which spurred a dramatic growth in emergency market assistance payments and loan deficiency payments (see Figure 1). As government transfers to agriculture have increased, the distribution of farm payments has received greater public scrutiny and spurred a debate in Congress to tighten payment caps on large-scale producers (e.g., Becker, 2000; Becker 2001; Williams-Derry & Cook, 2000). In response to this debate, the 2002 Farm Act created a Commission on the Application of Payment Limitations for Agriculture to "study the effects of limitations on the receipt of direct payments, counter-cyclical payments, loan deficiency payments and marketing loan gains by producers and other entities."
Measures of Well-Being
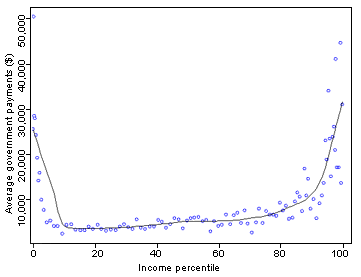
Income is often used as a measure of well-being because it is correlated with health, quality of housing, access to education, and other indicators of well-being. A recent study using 1999 USDA Agricultural Resource Management Survey (ARMS) data (Hopkins, 2001) found that farmers with either the lowest or highest household incomes procured the highest levels of government payments, whereas those earning "average" income received very little (see Figure 2).1 Among other things, the article concludes: "the payments sharply improved the financial standing of the worst-off program participants."
One problem with using household income as a measure of well-being for farm households is that the farm business component of household income varies from year to year due to price fluctuations, weather, and pest infestations. A farm could earn large profits in some years and suffer large losses in others. A survey in any one year will record the incomes of both lucky and unlucky farmers. Due to their size, the largest farms see the biggest gains and the biggest losses, which results in the U-shaped relationship shown in Figure 2. Larger farms receive larger government payments because most farm programs are tied to acreage or total production.
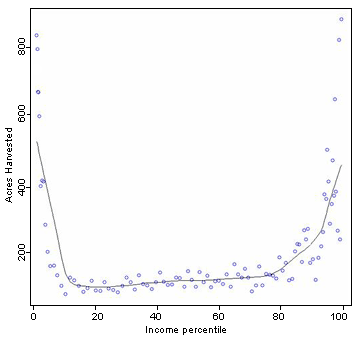
Figure 3 shows the average amount of land harvested for each sample percentile (100 of about 10,000 farms) ranked according to household income. (See Appendix for details about the figures). Moving along the horizontal axis, each point corresponds to the same 100 or so ARMS farms represented in Figure 2. The figure verifies that farm households with the lowest household incomes in 1999 on average have large farm operations. Similar plots (not reported here) show the same U-shaped pattern for the relationships between (a) household income and net worth and (b) household income and consumption expenditures. The U-shape plots demonstrate that the lowest income households are on average relatively wealthy and spend more on consumer goods than many of the higher income groups.
This evidence suggests that current farm household income is a poor indicator of household well-being because of its farm-business-related year-to-year variations. Farm households with the highest or lowest incomes are disproportionately large farms with high net worth and high consumption. Household income is a poor measure of well-being when expected farm income comprises a significant portion of expected total household income. As operations increase in size, expected farm income comprises an increasing share of expected total household income. Wealthy and large farm households are scattered across the income spectrum, though they are greatly outnumbered by small and medium-sized farms at the middle-income levels. Because households operating small and medium-sized farms also have variable incomes, household income is likely a poor well-being measure throughout the income spectrum. It is worth noting that farm income is an even worse (though more commonly used) measure of well-being than is household income. Recent research has tried to develop alternative measures of farm household well-being that incorporate additional factors such as wealth and consumption expenditures (Mishra et al., 2002).
Household expenditures on consumer goods is one alternative measure of well-being. Many economists prefer expenditures to current income for several reasons. First, it is the goods and services individuals purchase with income, rather than the income itself, that provide satisfaction. In addition, individuals and families generally spend what they can afford over the long run, not just from the current year's earnings. Thus, consumption expenditures reflect savings from past income, expected future earnings, and current income. Consumption is less variable than income because of borrowing in bad years and saving in good years.
Household net worth is another reasonable measure of well-being when income is variable. Because net worth represents accumulated income over many past years, and because future expected earnings are capitalized into the value of assets, wealth may be a better predictor of future earned income than is current income. Wealth may also be a better indicator of present consumption than current income because savings can be used to stabilize expenditures over time. Survey respondents may also find it easier to measure their assets and debts than to recall past expenditures.
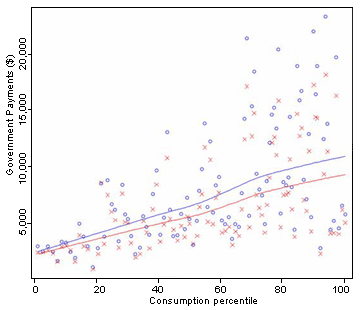
Using consumption expenditures or household-net-worth to measure well-being, the data show that the worst-off farmers received the lowest government payments in 1999. Figure 4 illustrates the average government payments received by each percentile of households, ranked by consumption spending. Those with higher consumption received greater government payments. The relationship is "noisy," however, because of the great variability in reported expenditures, especially by those with high incomes. This variability likely reflects difficulties in recalling expenditures, a common problem with consumption estimates.
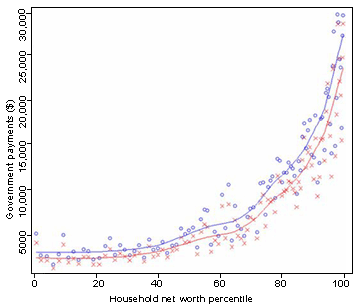
In contrast, survey respondents may find it easier to estimate their net worth. Figure 5 shows a much stronger link between net worth and government payments. Farm households with net worth below the 50th percentile received a small share of payments in 1999.
Payments and Land Tenancy
The above discussion of government payments overlooks leasing of farmland, through which part of the payments may be transferred to landlords as higher rents. Under a crop-share arrangement, the payments are distributed to both the farmer and landowner in proportion to their crop shares (Ryan, Barnard, & Collender, 2001). In cash-lease arrangements, landlords may be able to negotiate higher lease rates from tenants for land that receives greater government payments. Farmers thus receive all the government payments for the land they own and operate, but their landlords obtain a share of the payment benefits on leased land.
Table 1 presents 1999 ARMS survey data on the ownership and uses of farmers' land. Larger operations tend to lease a larger share of the land they farm. Consequently, the largest farms tend to pass on more of their total payments to landowners than do smaller-scale operations. On the other hand, larger farms also rent out more land than smaller farms so they receive more payments from their tenants.
We extend the payment distribution analysis by adjusting for land tenancy. This adjustment subtracts a share of the government payments received for each acre rented in and adds a share of payments for each acre rented out to another farmer. The crucial assumption involves the landowner-farmer split of each payment dollar.
The Distribution of Payment Benefits
Figures 4 and 5 show in red the tenancy-adjusted government payments in relation to household net worth and consumption. In both figures, the fitted line for the adjusted payments falls below the line for the unadjusted payments. This occurs because farms rent in, on average, much more land than they rent out (many farmland owners are nonfarmers). The adjustments, however, do not significantly alter the distribution of the payments across the measures of well-being.
Finally, Table 2 summarizes the financial conditions of farm households according to their adjusted government payments. The reported numbers are striking. Nonfarmers own about 60% of operated farmland, and therefore receive an estimated 20% (= 34% x 60%) of the total payment benefits. Over 58% of farm households received no government payments in 1999. In contrast, slightly over one percent of farm households received about 25% of total government payments to farm households, and about one-fifth of one percent of farm households received almost 9% of all payments. Moreover, households in the highest payment category (more than $150,000 of government payments) averaged more than $2.1 million dollars of net worth. By these tenancy-adjusted measures of well-being, a disproportionate share of government payments went to well-off farmers in 1999.
Conclusion
This examination of the relationship between government payments and farm household well-being provides several key insights. We show that household income, like farm income itself, serves as a poor measure of well-being due to its volatility. Farms with the lowest incomes in 1999 had high consumption expenditures and net worth—two arguably superior measures of well-being. We also find that, even after adjusting for land tenancy, government payments are allocated disproportionately to farms with the highest consumption expenditures and net worth. The least well-off farm households received relatively little government payments.
The implications of these findings depend on the objectives of agricultural policy, which may include supporting domestic production, smoothing income over time, or improving the well-being of the poorest farm households. Since 1996, agricultural policies have moved away from production support toward "decoupled" programs including Production Flexibility Contracts, Market Loss Assistance, and Counter-Cyclical payments. These programs are not tied to current output and may do little to support production. However, the Counter-Cyclical and Market Loss Assistance payments could significantly reduce farm income volatility and help farms overcome liquidity problems—something not addressed by this analysis. In terms of helping the least well-off farmers, the 1999 allocation of farm payments suggests that current programs are poorly targeted: government payments flow disproportionately to the farm households with the greatest wealth and the highest consumption expenditures.
Policies to limit payments under consideration by the Commission on the Application of Payment Limitations for Agriculture could result in a distribution of payments that is better targeted toward the least well-off farmers. Because household income can be a poor indicator of farm household well-being, the Commission might consider net worth as an additional criterion for payment limitations.
Notes
1 Total household income (from farm and nonfarm sources) is used in all the figures and tables.
For More Information
Becker, E. (2001, May 14). Far from dead, subsidies fuel big farms. New York Times.
Becker, E. (2002, January 22). Land rich in subsidies, and poor in much else. New York Times.
Cleveland, W.S. (1979). Robust locally weighted regression and smoothing scatterplots. Journal of the American Statistical Association, 74, 829-836.
Cleveland, W.S. (1981). LOWESS: A program for smoothing scatterplots by robust locally weighted regression. The American Statistician, 35, 54.
Hopkins, J. (2001, July). Impact of government payments to farmers varies by level of profitability & household income. Agricultural Outlook. Washington, DC: United States Department of Agriculture.
Mishra, A., El-Osta, H., Morehart, M., Johnson, J., and Hopkins, J. (2002). Income, wealth, and the economic well-being of farm households (Agricultural Economic Report No. 812). Washington, DC: United States Department of Agriculture Economic Research Service.
Roberts, M.J., Kirwan, B., and Hopkins, J. (in press). The incidence of government program payments on agricultural land rents: The challenges of identification. American Journal of Agricultural Economics.
Ryan, J., Barnard, C., and Collender, R. (2001, June-July). Government payments to farmers contribute to rising land values. Agricultural Outlook. Washington, DC: United States Department of Agriculture.
Williams-Derry, C. and Cook, K. (2000). Green acres: How taxpayers are subsidizing the demise of the family farm. Washington, DC: Environmental Working Group.
|
|

