Appendix: Construction of Figures
This appendix describes how Figures 2 and 3 were created. The plots summarize results from the 1999 USDA Agricultural Resource Management Survey of approximately 10,000 farm households. The survey is designed to capture an accurate picture of US agricultural production as a whole. To do this most effectively, the survey samples a disproportionately large number of large farms because, although they are relatively few, they nonetheless produce a substantial portion of aggregate production. The figures are adjusted to account for this sample design.Each figure plots an estimated average value of one variable against an estimated percentile of another. Each plot includes 100 points (one for each sample percentile). For example, to create Figure 2, government payments for all sampled households were sorted according to reported household incomes. The first observation corresponds to the weighted average of the smallest one percent of sample incomes; the second observation corresponds to the weighted average of the second smallest one percent; and so on. With about 10,000 sampled households, each point is the weighted average of about 100 reported incomes.
Because the sample is not perfectly random, both the averages and the percentiles are adjusted according to weights that approximate the probability that each household was sampled in the first place. In constructing the averages, observations more representative of the population of farms are weighted more heavily than observations less representative of the population. The sample percentiles do not exactly match the estimated population percentiles.
The percentile associated with each average was estimated as follows. Define the weight assigned to each sampled household i within the sample percentile s as wis and the total sample size as n. The estimated population percentile, ps (plotted along the horizontal axis) associated with the sample percentile s is defined by
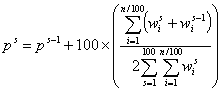
where
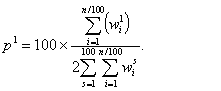
Each measure of ps accounts for the average weight in the group and returns a value for the center of the estimated percentile that the measure covers.
In each plot a fitted nonparametric regression line is plotted over the estimated percentile averages. Each line was constructed using a procedure called LOESS, shorthand for "local polynomial regression." For details on this procedure see Cleveland (1979, 1981).
Adjusting Payment Benefits for Land Tenancy
To obtain the adjusted government payments shown in red in Figures 4 and 5 and in Table 2, we estimate the effective payments accruing to the farmer from land operated and land rented out. For land operated, the farmer receives payments G of which he or she "keeps":G1 = G * (own + θ * rentin) / operated
where own is the operated land that is owned, rentin is the land rented (as either cash or share rent), and operated is the total operated land.1 The equation implies that the farmer keeps all the payments from land they own and operate, but only some share θ of the land they rent in. For the land the farmers rent out, we estimate the amount they "keep" as:
G2 = (1 - θ) * rentout * G / (own + rentin)
where rentout is the land rented out. Note that G / (own + rentin) is the average payments per acre on the operated land (excluding land rented for free or used part of the year). If we assume that the land rented out averages the same payments per acre as the operated land, then the right hand side is the share of payments going to the landlord (1 - θ) times total payments earned on the land rented out. Hence the adjusted government payments accruing to the farmer are given by G1 + G2.