|
Dairy farmer check-off contributions are used to fund a variety of generic commodity promotion programs. Historically, generic advertising of fluid milk and cheese have constituted the majority share of check-off budgets for dairy products. In recent years, however, slow growth in dairy farmer check-off revenues, combined with sharp increases in media advertising costs, has prompted a shift away from generic advertising to other nonadvertising commodity promotion activities.
Recently, new store-level marketing efforts by the American Dairy Association and Dairy Council (ADADC) have focused on implementing retail category management (CM) programs for fluid milk products in the dairy case — the Dairy Case Management Program (DCMP). This program aims to improve the management, appearance, and operation of the dairy case in retail stores, with the ultimate goal of increasing per capita milk consumption. Retailers have long recognized category management as a promotional tool for marketing their products, and grocery retailers have applied various methods of using space in dairy cases to encourage consumers to buy dairy products. The CM process involves managing product categories as strategic business units and customizing them on a store-by-store basis to satisfy customer needs.
The expectation of increased sales provides an incentive for retailers to adopt CM programs. However, to milk producers who fund DCMP efforts through their check-off investments, the underlying expectation is that these activities will increase consumption. A CM program aimed at understanding consumer preferences and strategically redefining a category accordingly should increase sales growth. It is reasonable then to hypothesize that a successful multi-store/market application could increase overall market sales volume and per capita consumption levels. To test this hypothesis we investigate a case-study application of the DCMP in the Hudson Valley region of New York State.
The Hudson Valley DCMP
ADADC DCMP staff worked with ProCorp USA, Inc., a marketing agency specializing in category management, to conduct retail store programs and work with retail/category managers. Program personnel provided multiple store visits per week during the duration of the eight-week program cycle and worked closely with retail store staff to improve stock control procedures by evaluating ordering, variety, hygiene, and rotation procedures. In addition, alternative dairy case designs (i.e., planograms) were developed to consider shelf management and presentation of the product.
Various evaluative tools were used to measure the progress in achieving program objectives. Our focus is directed towards two such tools — weekly store Benchmark Scores and store fluid milk sales volumes. Weekly Benchmark Reports (BMR) were prepared to provide overall store scores encompassing five benchmark categories — planogram, hygiene, rotation, stockweight, and ordering. The planogram benchmark relates to acceptability of the display case through proper placement of pricing tickets and adherence to the recommended case design. Hygiene relates to the overall cleanliness and appearance of the display case. Rotation relates to maintaining a regular rotation schedule for proper movement of product. Stockweight relates to having appropriate levels of stock in both the display case and coolroom. Ordering deals with balancing ordering levels with product movement to prevent low stockweights and out of stocks. The scoring system is an indication of each store's weekly progress and the scores reflect the number of benchmarks achieved during the course of that week.
Another important tool to evaluate store progress from the DCMP is a comparison of monthly sales of fluid milk products over time. Sales data were collected on a monthly, volume basis with individual products specified by Universal Product Code (UPC). Milk products were classified into three types: (i) Standard Milk — standard, unflavored fluid milk products in packages greater than 16 ounces, (ii) Beverage Milk — flavored fluid milk products and unflavored fluid milk products in packages of 16 ounces or less, and (iii) Lactaid Milk — all lactaid fluid milk products. The monthly sales figures compare sales (in volume sold) for six months — two months prior to program operation, two months during program operation, and two months after program operation. In addition, monthly sales figures are compared to the previous year's sales.
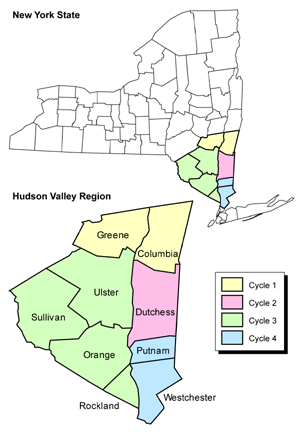
The Hudson Valley Region DCMP program was conducted in the summer of 2002, with over 200 stores participating, and run in four separate cycles by geographic area (Figure 1). Store participation in the region included 65% of all supermarket, mass merchant, convenience, and drug stores, and accounted for over 91% of average weekly volume (in total store dollars). The Northwestern Hudson Valley Market area (cycle 3) is located primarily in the northwest geographical area of the Hudson Valley territory and is the focus of this case study. A total of 61 retail stores completed the duration of the in-store DCMP in the Northwestern Hudson Valley Market area. The eight-week program cycle ran from July 2002 through August 2002. A wide array of store types participated, including 25 convenience stores, 16 drug stores, 16 supermarkets, and 4 mass merchants.
DCMP Benchmark Achievement
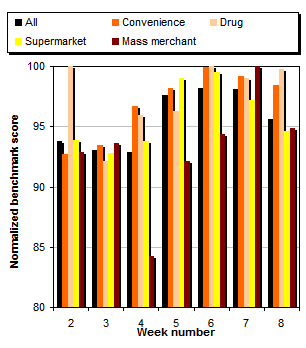
To get a sense of store progress during the eight-week DCMP, we computed volume-weighted average weekly benchmark scores by store type, and subsequently, we normalized them on a basis of 100 (Figure 2). One would expect improvement in benchmark scores during the DCMP period, and this result appears to have occurred across all store types following some transition in the first few weeks. The declines in average scores in the last week of the program, particularly for supermarkets and mass merchants, offset statistical gains from the scores evident in weeks six and seven, and highlight the need for continual evaluation in adherence to DCMP objectives.
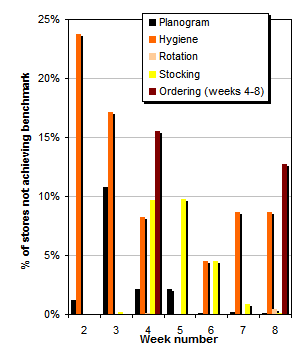
Looking more closely at the types of benchmark deficiency, we can identify specific problems in stores not achieving full compliance. Figure 3 displays the (weighted) percentage of all stores not achieving particular benchmarks by program week. Early in the program, attention was directed mostly to hygiene and planogram deficiencies; however, both benchmark categories showed substantial improvement over the program period. Stocking issues were evident by week four, presumably as product variety and planogram changes occurred, but decreased to near zero by the end of the program cycle.
When the ordering benchmark was first introduced in week four, problems were evident in about 15% of stores; these were likely due, in part, to changes in product mix with a revised planogram design and the need to reconfigure ordering schedules with suppliers. Rotation issues seemed the least problematic throughout the program period. However, after early rotation problems appeared to have been resolved, new problems appeared to return during the final week of the program period and may be indicative of subsequent changes in planogram design without updating and balancing supply schedules.
Benchmark deficiencies differentiated by store type provide program staff information on areas of focus. While not differentiated in Figure 3, hygiene issues needed relatively more attention in convenience stores and supermarkets, while problems in planograms were most evident in convenience and drug stores. Ordering concerns were not of issue in smaller stores, but they did need attention in the higher-volume supermarkets and mass merchants. Stocking concerns were most evident in mass merchant stores, whose general display is dominated by larger, quickly moving volume, but with limited numbers of individual products.
Store Sales Volume Comparison
Store size and sales volume of fluid milk products varied widely across participating stores. Average daily volume (ADV) sales for all participating stores exceeded 11,000 total gallons during the study period, or 192 gallons per day per store on average. As expected, this movement was dominated by supermarket sales, covering 63% of total milk sales in the area. Mass merchants (18%) and convenience stores (15%) also were significant contributors to total milk movement, with drug stores lagging further behind (5%).
As expected, the predominant source of milk movement on a volume basis was standard, unflavored fluid milk products (96%). Gains in beverage milk products were evident in all store types since 2001, but relative volume movement was small at 6% of fluid milk sales, with the largest proportion sold in convenience stores. Lactaid products represented the smallest proportion of volume and were sold almost exclusively in supermarkets.
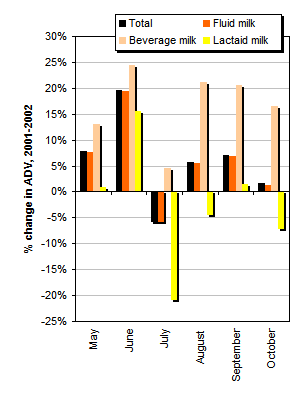
Year-to-year changes in sales volume (ADV) for the May through October sales period for standard, beverage, and lactaid milk were +5.6%, +16.6%, and -3.0%, respectively (Figure 4). While sales changes in standard milk varied across store types, gains in beverage milk sales consistently were positive. This result was expected, given the program emphasis on increasing products and facings of popular beverage products. The overall 3% sales volume loss in lactaid products was largely the result of lower volume sales in one month of 2002 (July), just as the DCMP entered the retail stores.
DCMP Sales Impacts
Using the monthly sales data described above, regression analysis was used to estimate volume changes due to the DCMP in the Northwestern Hudson Valley Market stores. Regression analysis is a useful tool for isolating independent sources of variation in explanatory variables to variation in the dependent variable of interest. Both overall market volume impacts of the DCMP and sales volume impacts by store and product type were estimated (for details see Schmit, Kaiser, & Chung, 2004). Supermarkets and mass merchants were classified into a "large store" category, while convenience and drug stores were classified into a "small store" category.
Recall that the DCMP in-store period occurred during the eight weeks of July and August 2002. While many of the DCMP recommendations may have been instituted during this time, continual changes occurred throughout the in-store program. In addition, it was felt that longer-run DCMP sales impacts should be estimated after the time period when program staff visited the stores so that impacts would be based on actual store management following the program cycle. Therefore, the period September through October 2002 was selected for measuring volume changes attributable to the DCMP, after accounting for other independent sources of variation.
Estimated DCMP impacts indicated that the program was effective at increasing ADV across all stores, on average, 4.40%. Using the average store ADV of 192 gallons per day, this result implies store ADV gains of 8.44 gallons per day. The DCMP was relatively more effective in supermarkets and mass merchants (ADV gain of 5.25%) than in convenience and drug stores (ADV gain of 4.05), and resulted in ADV gains across all products of 24.17 and 2.20 gallons per day, respectively. The larger relative percentage gains for supermarkets and mass merchants were to be expected, due in part to more flexibility in space use in these store types.
Given that the dominant share of total milk volume movement is due to sales of standard fluid milk products, it was not surprising that gains in this volume largely mirror the overall product results. ADV gains for standard, unflavored milk from the DCMP were positive and significant for both store classes, with gains of 5.22 and 4.08% for supermarkets/mass merchants and convenience/drug stores, respectively. Strong volume gains in the largest dairy case category are encouraging evidence of the program's effectiveness in moving more milk in both smaller and larger stores.
While DCMP efforts emphasized increases in space allocations for beverage products (i.e., around 4% based on planogram recommendations), average store volume impacts were not statistically different from zero. This combined-store result was realized by decreased volume in convenience/drug stores, offset by statistically significant gains in supermarkets and mass merchants. A closer examination shows that general volume changes were higher during the eight-week in-store program and then they dropped off during the two-month evaluation period. This result may indicate that increases in volume of beverage products were better attained under the close monitoring of program implementation during the market cycle, and that a loss of program integrity and operational design occurred after in-store visits. This situation is likely due to the large number of individual beverage products cycled through store displays and increased influences by wholesale distributors and merchandisers.
Lactaid milk volume across all stores showed a relatively large percentage increase due to DCMP efforts of over 9%. DCMP volume gains in the lactaid product category were evident from both store type classes, but stronger influences were attributed to the larger stores where lactaid milk products are primarily available. While volume movement of lactaid products is relatively small, given the more recent introduction of lactose-reduced products in the dairy case, positive volume gains from this program was a promising result.
Evaluating Effectiveness
The sales model estimates indicated that the DCMP was effective at increasing sales volume in participating program stores. To put these estimates in proper perspective, it is necessary to value the incremental volume relative to the costs of the program. Considering the estimated ADV gain for all products across all stores and assuming the volume gain is maintained over a full year implies additional annual market value to producers of approximately $48,000. Given the total cost of the program of approximately $122,000 (roughly $2,000 per store), this finding implies that, assuming maintained sales enhancement, the program would pay for itself in 2.5 years. Viewed from a longer-term structural change in management perspective, this payoff timeline may be acceptable. However, the absence of immediate or short-run net gains underscores the importance of implementing a long-run management strategy, with continual evaluation for the program to be successful.
For More Information
Schmit, T.M., Kaiser, H.M., & Chung, C. (2004). The dairy case management program: Does it mooove more milk? (research bulletin RB 2004-02). Ithaca, NY: Cornell University Department of Applied Economics and Management. Available online: http://commodity.aem.cornell.edu/nicpre/bulletins/rb0401/rb0401.pdf.
|
|