|
Demand for organic produce in the United States has increased steadily since the early 1990s. In 2000, for the first time, conventional supermarkets sold more organic food than any other venue (Dimitri & Greene, 2002). According to the Organic Trade Association (OTA), organic food sales in the United States totaled $13.8 billion in 2005, making up 2.5% of the retail food market. This is an increase from 1.9% in 2003 and from 0.8% in 1997 (OTA, 2006). This increase coincides with the implementation of national organic standards by the USDA in October of 2002, which provided uniform labeling for consumer recognition. Demand trends are expected to continue as more conventional retailers take up a larger portion of the organic market. Sales of organic foods are estimated to rise to $23.8 billion by 2010 (NBJ, 2004).
The phenomenal growth in organic sales in recent years has brought additional farmland into organic agriculture industry. Dimitri and Greene (2002) estimated that between 1997 and 2001, U.S. farmers and ranchers nearly doubled the acreage of certified organic land, totaling to 2.3 million acres. With increasing production and supply of organic produce and meats, organic food, once considered a niche product, has become more available and affordable for consumers in mainstream grocery stores. It is estimated that 46% of total organic food sales are now handled by the mass-market channel, which includes supermarkets, grocery stores, mass merchandisers, and club stores (OTA, 2006). A popular perception tends to suggest that most organic consumers are white, wealthy, and have young children. However, the consumer base of organic food appears to have become more diverse and cannot be easily pigeonholed as the market is growing with increased availability and popularity. A study by the Hartman Group (2002) found that half of the respondents who purchased organic food frequently have an annual income below $50,000, and that African Americans, Asian Americans, and Hispanics purchase more organic products than Caucasians.
Our analysis used the Nielsen Homescan data from 2001 and 2004 (Box 1) to determine the characteristics of organic consumers, what they buy, how much they spend, and the price premiums they pay for organic produce. These two years give us a sample from before and after the implementation of the National Organic Program's (NOP) labeling standard. We focus on fresh produce because produce represents the largest sector, at about 39% of the organic market (OTA, 2006). One may speculate that the growing popularity of organic consumption could be attributed at least partially to the implementation of NOP. However, it is not our intention to contribute to the debate on the effect of NOP, mainly because Homescan data are not suitable for examining such an issue. We simply present a cursory look at the data to examine whether any notable changes have occurred after NOP by comparing household purchases of fresh produce in 2001 and 2004.
Who Buys Organic Produce?
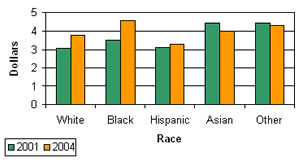
Of all demographic characteristics, race seems to be the most correlated with organic expenditures. In 2001, we found that Asian Americans, compared to other ethnic groups, spent the most food dollars to purchase organic produce on a per capita basis. Though they bought comparable amounts of fresh produce, Asian Americans, on average, spent more on organic produce than White, African, or Hispanic Americans. By 2004, Asian Americans' expenditures on organics fell, while White, African, and Hispanic Americans increased their spending on organic produce (Figure 1). Further, African Americans have replaced Asian Americans to become the ethnic group that spent the most on organic produce. The proportion of African Americans who purchased organic produce also increased from 34% in 2001 to 37% in 2004, while the proportion of organic users among other groups have remained relatively the same. These findings are in general agreement with the report that Asian, Hispanic, and African Americans are the ethnic groups more likely to purchase organic foods than Whites (Hartman Group, 2002). According to a more recent study by the Hartman Group (2006), Asians and Hispanics are motivated primarily by family concerns in buying organic products.
Organic expenditures vary by region. We found that in 2004, households in the Western United States purchased more organic produce than those residing in other regions, spending on average about $4.90 per capita. This spending amount represents an increase of 19% over 2001, after adjusting for inflation. Households residing in the northeastern and southern regions also registered an increase in average per capita spending on organic produce. The Central United States showed the lowest average per capita expenditure in 2004, which remained virtually unchanged from 2001. In terms of proportion of households that purchased fresh organic produce, the western region also showed the largest increase (almost 4%) of organic users from 2001 to 2004. The West and South appear to be the two fastest growing markets for organic produce in the United States.
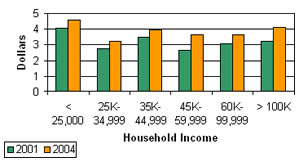
According to Homescan data, the average per capita spending on organic produce increased by 12% in real terms between 2001 and 2004. As shown in Figure 2, this increase in spending is observed for all households across various income groups. It is interesting to note that average per capita spending on organic produce exhibited a U-shape relationship with income for households earning less than $45,000 annually. Among households earning $45,000 and more, organic spending appears to rise with income. These patterns between household income and organic spending are observed for both 2001 and 2004. It is somewhat surprising to find that households with the lowest income level of less than $25,000 spent the most—more than $4 per capita on organic produce in 2001 and 2004. Furthermore, households in the $35,000-$44,999 income bracket spent about as much on organic produce per capita as those households earning over $100,000 annually ($3.94 versus $4.09 in 2004). For households with annual income at $25,000 or above, there appear little variations on average per capita spending on organic produce in 2001 and 2004. Overall, there is little consistent association between per capita expenditures on organic produce and household income. Studies suggest that lower income families choose to buy organic when possible as a means of preventative medicine, and thus are at least as likely to purchase organic as other income groups (Hartman Group, 2003; OTA, 2004).
The lack of a clear positive association between organic expenditure and income level may have prompted Laurie Demeritt, President of the Hartman Group, to observe that "income is about the only thing that doesn't skew at all by user and nonuser. You get little skews in age, little skews in geography, little skews in education, but there's nothing at all for income, so we don't even look at that any more" (Fromartz, 2006). A recent survey conducted by the Food Marketing Institute (2004) showed that only 11% of organic shoppers polled bought organics at a natural-food supermarket, while 57% bought at mainstream grocery stores and discount stores. The fact that mainstream grocery stores are replacing the specialty food stores as the major outlets for organic foods could explain the seemingly fading relationship between organic expenditure and household income. It appears that income may no longer be a good predicator to profile organic consumers as the industry continues to grow and evolve into maturity.
What Do Organic Consumers Buy and How Much Organic Premium Do They Pay?
According to Homescan, tomatoes, potatoes, carrots, onions, lettuce, apples, oranges, bananas, grapes, and strawberries were the top five vegetables and fruits in terms of their shares of fresh produce expenditures for home consumption. American households spent more on organic produce between 2001 and 2004 for all produce except oranges and lettuce. Overall, average per capita spending on these organic fruits and vegetables increased from $1.64 in 2001 to $1.91 in 2004, an increase of 8.5% in real terms. Tomatoes appear to be the most favored organic vegetable among American consumers with average per capita spending amounts 3-4 times those of other organic produce in both 2001 and 2004. Per capita spending on organic apples and lettuce held distant second and third places in 2001, while carrots and apples were ranked second and third, respectively, in 2004. Strawberries and bananas registered the largest increases in organic expenditures by 45% and 33%, respectively.
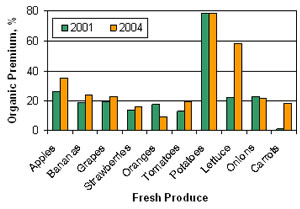
Since organic agricultural production is typically more cost intensive than conventional agriculture, many organic farmers rely on the premiums that organic foods carry to cover their extra costs. High premiums usually indicate high demand, signaling to producers which markets may be expanded. As indicated previously (Box 1), we calculated unit values (spending over quantity purchased) to derive price premiums for selected fresh produce because Homescan panelists do not report prices of organic and conventional produce. Thus, the organic premiums derived from unit values are not strictly the same as would be observed from the unit prices, if available. Except for oranges and onions, average organic premiums for the most valuable produce increased from 2001 to 2004 (Figure 3). In 2001, average organic premiums varied from 1% ($0.01/lb.) above the conventional produce for carrots to 78% ($0.32/lb.) for potatoes. In comparison, organic premiums varied from 9% ($0.08/lb.) for oranges to 78% ($0.36/lb.) for potatoes in 2004. According to our calculations, organic potatoes carried a substantially higher price premium than other organic produce in both 2001 and 2004. This finding can be useful to organic producers who are looking for new crops to improve their profit margins. The changes in organic premiums between 2001 and 2004 were relatively moderate among the most valuable produce, except for lettuce and carrots.
In terms of dollar amount, average organic premiums that consumers paid in 2004 for apples, grapes, strawberries, tomatoes, and potatoes were fairly uniform at about $0.35/lb. above their conventional counterparts. There are substantial variations among individual fresh produce, most notably in carrots and lettuce, which registered the largest increases in price premiums between 2001 and 2004. Tomatoes and apples also showed an increase in average price premiums by 52% and 75%, respectively. Overall, the average price premium for the selected produce increased from $0.19/lb. in 2001 to $0.29/lb. in 2004, which represents a 42% increase in real terms.
Price plays an important role in consumers' purchase decisions. A survey by Walnut Acres (2002) reported that 68% of consumers cited high prices as the main reason they did not buy organic foods. However, to many organic consumers, price could be of secondary consideration. They are willing to pay a price premium because they value and demand certain attributes from organic products. To them, the organic attributes are well worth the price difference. The fact that we find the organic premiums for most selected fresh produce increased from 2001 to 2004 suggests that the demand for organic produce remains strong, and consumers are willing to pay additional dollars for the organic attribute.
Based on limited data on organic prices over the period 2000—04 at the farmgate and wholesale levels, Oberholtzer, Dimitri, and Greene (2005) show that prices for organic varieties are comparatively more volatile than their conventional counterparts and organic price premiums were higher at the wholesale level than at the farmgate level. Of the three produce (broccoli, carrots, and mesclun mix) studied, they found that average annual organic price premiums at wholesale, as a percent of conventional prices, increased for carrots (143% to 148%) and for broccoli (141% to 153%) between 2001 and 2004, while the price premiums decreased for mesclun mix from 9% to 7%. It should be noted that the organic premiums calculated from the Homescan data are not directly comparable with those reported in Oberholtzer, Dimitri, and Greene (2005). However, one would expect relatively lower organic price premiums at the retail level than at the wholesale or farmgate level as organic foods are becoming more competitive and increasingly marketed through mainstream supermarkets and discount club stores.
A Profile of Consumer by User Group
In our analysis, we categorized each household into user or nonuser group according to whether or not the household purchased organic produce. Then user households are classified into one of three user groups based on sample distribution of per capita spending on organic produce. In 2004, the first quartile of organic users with per capita spending greater than $0 but less than $0.75 is defined as light users, the second and third quartiles are defined as medium users (between $0.76 and $3.65), and the fourth quartile is the heavy users (> $3.65). The nonusers account for 62.5% of the 2004 sample, while light, medium, and heavy users account for 9.6%, 18.6%, and 9.4%, respectively. In comparison, the proportion of user groups in 2001 are 62.9% (nonusers), 9.5% (light users), 18.4% (medium users), and 9.2% (heavy users). Overall, the result shows that proportionally more consumers have become organic users in 2004 than in 2001, with a slightly higher increase in both medium and heavy user groups. Per capita spending on organic produce by medium users increased from $1.45 in 2001 to $1.81 in 2004; an increase of 16% in real terms. For the light and heavy users, the growth in real per capita organic spending increased by 10% from 2001 to 2004.
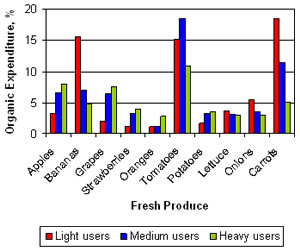
With respect to market shares of selected organic produce across user groups, Figure 4 shows that light users spent the largest proportion of their organic expenditures on carrots, bananas, and tomatoes. The medium users purchased more tomatoes and carrots relative to other kinds of fresh produce, while heavy users seemed to expend a larger proportion of their organic budgets on tomatoes, apples, and grapes. Overall, organic tomatoes appear to be the favorite fresh produce among the organic users, accounting for more than 15% of light and medium users' organic produce expenditure and more than 10% for heavy users. It is interesting to note that organic vegetables appear to be the preferred organic produce of light users, while the heavy users seem to have an affinity for organic fruits, especially apples and grapes. Heavy users buy proportionately more of each fruit than either the light or medium users, except for bananas. On the other hand, they tend to buy less of each vegetable than either the light or medium users, except for potatoes.
Comparing demographic information across user groups in 2004 gives us further insights in terms of how organic expenditures are related to these characteristics. As shown in Table 1, heavy and medium users have the largest proportions of those who have at least a bachelor's degree, while a larger portion of nonusers and light users have either a high school diploma or some college. Interestingly, households whose heads have less than a high school education account for 1.9% of heavy users, the highest among all user groups. With respect to age, heavy users seem to comprise the largest proportion of the youngest households (household head age < 30 years), while the light users' group has the largest proportion of household head age between 30 and 49 years old. Medium and heavy users also have the largest proportion of older households relative to nonusers and light users, with the age of household head 50 years and older. Most heavy users are found in the Southern and Western United States, and the fewest are found in the central region. Medium users have the largest proportion of Whites relative to other user groups, while a relatively large proportion of Hispanic consumers belong to the light users' group. In comparison, heavy users are proportionally few among Whites, with the reverse being true for African, Asian, and other Americans.
Summary
We used the Nielsen Homescan data from 2001 and 2004 to analyze consumer purchase patterns of fresh organic produce. Our analysis shows that Asian and African Americans tend to purchase organic over conventional produce more than Whites and Hispanics. Households residing in the western region spent more on organic produce on a per capita basis than those residing in other regions. Contrary to popular opinion, we do not find any consistent positive association between household income and expenditures on organic produce. Although certified organic acreage has increased rapidly in boosting the production of organic foods, our analysis suggests that demand appears to be growing faster than the supply so that organic price premiums for most selected fresh produce remained relatively high in 2004, varying from 9% for oranges to 78% for potatoes. Among all fresh produce studied, organic potatoes appear to command the highest percentage of price premiums in both 2001 and 2004.
We classified all households into four groups: nonusers, light users, medium users, and heavy users, according to their per capita expenditures on organic fresh produce. The proportion of consumers buying organic produce increased between 2001 and 2004, suggesting an increasing organic penetration. In terms of demographic characteristics, medium and heavy users are represented proportionately more by older households with the age of household head 50 years and older. Heavy users also comprise the largest proportion of the youngest households (household head age < 30 years), while light users have the largest proportion of household head age between 30 and 49 years old. In addition, we find that light users expend a relatively larger share of their organic expenditures on bananas and carrots than both the medium and heavy users. Organic vegetables appear to be the preferred organic produce of light users, while the heavy users seem to prefer organic fruits, especially apples and grapes. For all organic users, organic tomatoes are clearly the preferred choice over other vegetables.
Acknowledgements
The views expressed in this study are those of the authors, and do not necessarily reflect those of the United States Department of Agriculture.
For More Information
Dimitri, C., & Greene, C. (2002). Recent growth patterns in U.S. organic foods market.
Agricultural Information Bulletin No. 777, U.S. Department of Agriculture, Economic Research Service.
Food Marketing Institute. (2004). U.S. organic food sales continue to grow. Food Institute Report, Arlington, VA, May 10.
Fromartz, S. (2006). Organic, Inc.: Natural foods and how they grew. New York: Harcourt Trade Publishers.
Hartman Group. (2002). Hartman organic research review: A compilation of national organic research conducted by the Hartman Group. Bellevue, WA.
Hartman Group. (2003). Organic consumer evolution 2003. Bellevue, WA.
Hartman Group. (2006). Organic2006: Consumer attitudes & behavior five years later & into the future. Bellevue, WA.
Nutrition Business Journal (NBJ). (2004). The NBJ/SPINS organic foods report 2004. Cleveland, OH: Penton Media, Inc.
Oberholtzer, L., Dimitri, C., & Greene, C. (2005). Price premiums hold on as U.S. organic produce market expands. VGS-308-01. Washington, DC: U.S. Department of Agriculture, Economic Research Service.
The Organic Trade Association (OTA). (May 2004). The Organic Trade Association's 2004 manufacturer survey. Greenfield, MA.
The Organic Trade Association (OTA). (2006). The OTA 2006 manufacturer survey overview. Available online: http://www.ota.com/organic/mt.html.
Walnut Acres. (2002). Many Americans make eating organic food a top choice to protect health. Boulder, CO, April 9.
|
|
Table 1
Selected Household Characteristics by User Group, 2004.
| Educational Level (%) |
| Less than high school diploma |
1.86 |
0.86 |
1.66 |
1.90 |
1.73 |
| High school diploma |
19.60 |
15.80 |
15.02 |
11.53 |
17.63 |
| Some college |
31.49 |
31.60 |
30.73 |
26.36 |
30.88 |
| College degree |
32.05 |
35.56 |
33.61 |
32.83 |
32.75 |
| Post-college degree |
15.00 |
16.17 |
18.98 |
27.38 |
17.01 |
| |
|
|
|
|
|
| Age of Household Head (%) |
| < 30 years |
1.44 |
0.86 |
1.21 |
2.15 |
1.41 |
| 30—39 years |
12.46 |
13.59 |
9.33 |
11.91 |
11.93 |
| 40—49 years |
24.06 |
29.01 |
20.38 |
19.90 |
23.46 |
| 50—64 years |
38.72 |
35.19 |
39.17 |
39.04 |
38.49 |
| 65 years and older |
23.32 |
21.36 |
29.90 |
27.00 |
24.70 |
| |
|
|
|
|
|
| Region (%) |
| Northeast |
20.41 |
22.59 |
25.24 |
23.45 |
21.80 |
| Central |
18.76 |
16.79 |
14.25 |
10.65 |
16.98 |
| South> |
41.36 |
37.41 |
34.89 |
31.43 |
38.85 |
| West |
19.46 |
23.21 |
25.62 |
34.47 |
22.37 |
| |
|
|
|
|
|
| Race (%) |
| White |
74.08 |
71.48 |
76.61 |
67.93 |
73.72 |
| African |
13.44 |
12.84 |
11.69 |
15.59 |
13.26 |
| Hispanic |
8.17 |
10.49 |
6.84 |
8.37 |
8.06 |
| Asian |
2.72 |
3.46 |
2.81 |
4.06 |
2.93 |
| Other |
1.60 |
1.72 |
2.04 |
4.06 |
1.92 |
| |
|
|
|
|
|
| Number of households |
5,266 |
810 |
1,565 |
789 |
8,430 |
|
|