Source: USDA-ERS, 2014.
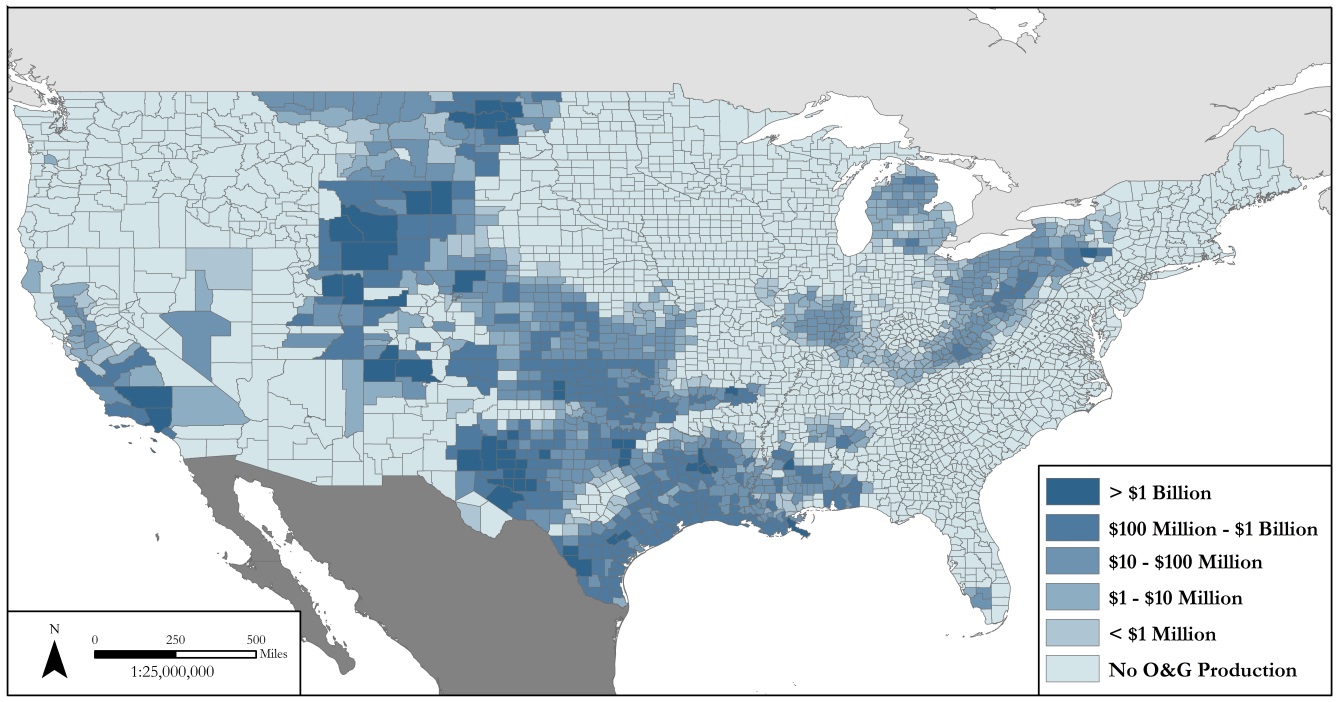
Shale formations rich in oil and gas cover parts of many agriculturally rich states. Since farmers own or operate more than half of the non-urban land in the 48 lower states (U.S. Department of Agriculture, Economic Research Service (USDA, ERS), 2013), the potential for oil and gas drilling to affect the well-being of farmers and the profitability of their farms is high. Most onshore oil and gas production is concentrated in the south-central United States, the western Plains, and the Appalachian Mountain region in the east. The value of this production often dwarfs the local agricultural economy. In 2012, the value of energy production was, on average, 16 times greater than the value of agriculture in energy-producing counties, up from 6 times in 2002 (USDA, National Agricultural Statistics Service (NASS), 2012; USDA, NASS, 2002; and USDA, ERS, 2014).
The overall effect of shale development on agriculture is uncertain and depends on local and individual factors. The energy industry makes large payments to farmers who own mineral rights or land needed for pipelines or access roads.However, energy companies also compete for inputs, such as water and labor, which may weaken the profitability of farms, particularly in remote and dry areas. For example, farmers and drilling companies will compete for water in dry parts of Texas and other western states. In rural areas far from population centers, farmers might find it hard to retain hired workers who can make higher wages driving semi-trucks or pouring concrete for well pads. In North Dakota, competition for trains given the use of rail for transporting oil has led to lower local grain prices and mounting concerns over future backlogged shipments of grain (Nixon, 2014). Drilling pads and access roads can also reduce the surface area available for crops or pasture.
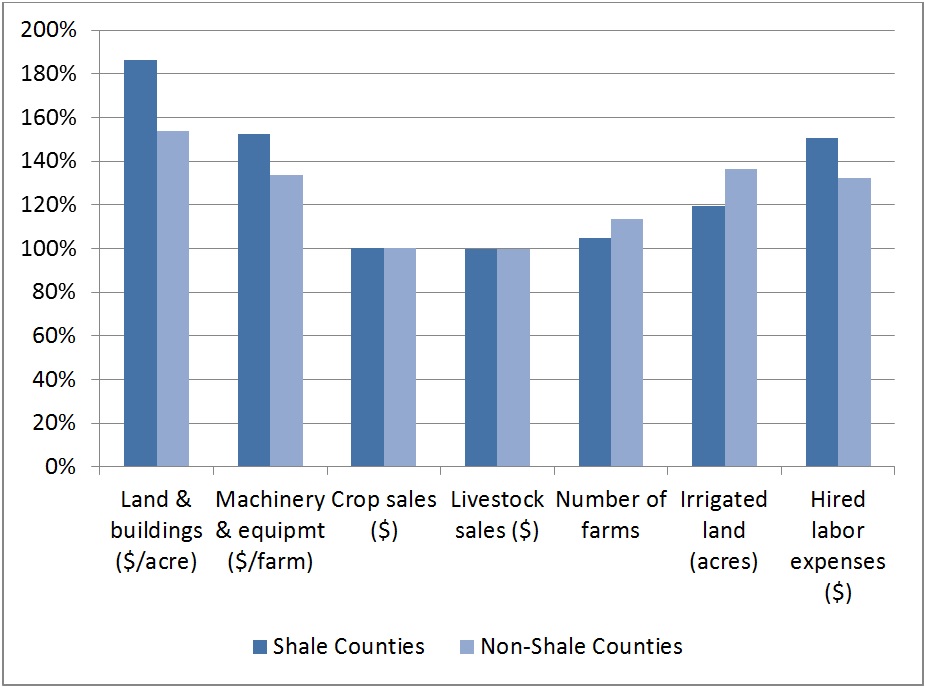
Source: Based on USDA, NASS, 2002
and 2012 Censuses of Agriculture. Note:
Includes counties with shale plays in AR,
CO, LA, MO, NM, ND, OK, and TX.
Shale development from 2002 to 2012 appears to have diverse impacts on agriculture. Farms in shale counties experienced a larger increase in the value of their land and buildings than those outside of shale plays. This suggests that growth in the value of the oil and gas rights has outpaced any decline in the value of land associated with loss of land for agricultural use and potential environmental degradation of the land related to drilling. In addition, within the shale area, the value of machinery and equipment increased compared to non-shale areas. This could be the result of a wealth increase through lease and royalty payments to farmers owning their mineral rights. While crop and livestock production remain unchanged, there is some evidence of farm consolidation in shale areas. Competition for water may explain why shale areas had a smaller increase in irrigated acres, while competition for labor could account for the relatively larger increase in hired labor expenses in shale areas relative to non-shale areas.
The descriptive comparisons, of course, mask exactly why and how shale development may be affecting agriculture.
Much of the concern with the recent wave of oil and gas development regards its potential impacts on water quantity and quality. Shale development uses large quantities of water because of its reliance on hydraulic fracturing to create fissures in rocks to release the oil and gas trapped within. A typical horizontal shale gas well requires 2 to 4 million gallons of water during the fracturing process (U.S. Department of Energy, 2009). Although water use associated with shale development is small at the state level, it may cause large increases in water demand in specific areas (Nicot and Scanlon, 2012). This is especially a concern for water-scarce areas in Texas and other western states where many shale wells have been drilled (Freyman, 2014).
The use of water in hydraulic fracturing has also led to concerns about water quality. In Pennsylvania, Osborn et al. (2011) found evidence that drilling can affect groundwater through methane migration or faulty well casings. It can also affect surface water quality through spills at drilling sites or if drilling wastewater is not properly processed by treatment plants before it is discharged into rivers and streams (Kargbo, Wilhelm, and Campbell, 2010; and Olmstead et al., 2013).
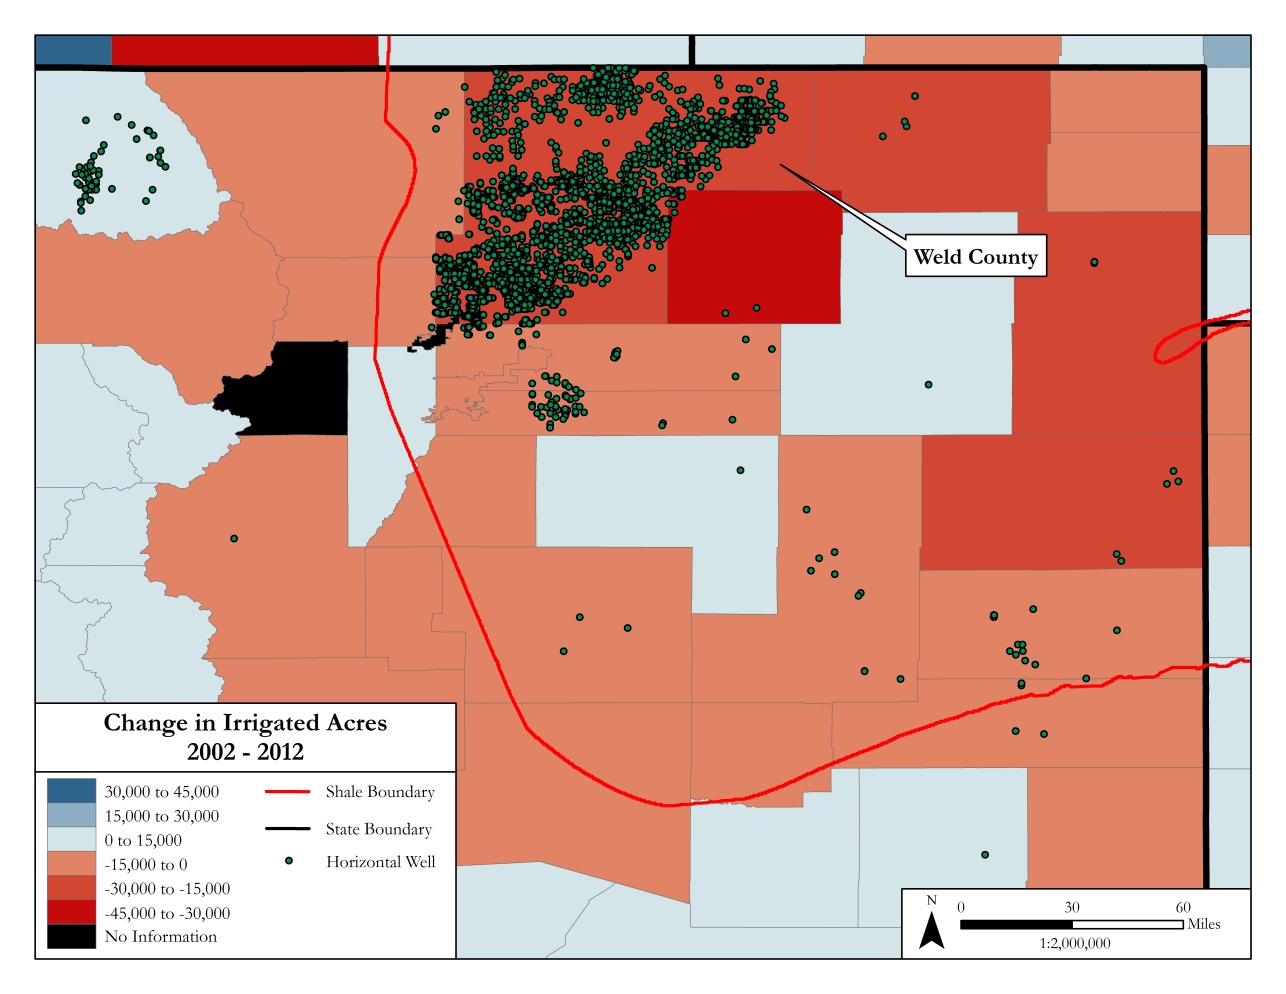
Source: Based on USDA, NASS, 2002 and
2012 Censuses of Agriculture and the
Colorado Geological Survey (2014).
Water quality and quantity concerns associated with shale development may affect farming and ranching in several ways. Farmers may face higher water prices due to competition with energy companies. In certain areas of the country, such as Texas and Colorado, farmers and ranchers may sell their water rights to energy producers thereby diverting water use from agriculture (Gold and Campoy, 2011; and Healy, 2012). Greater demand for water in general could cause farmers to transition from water-intensive crops such as cotton and rice to crops requiring less irrigation or none at all. In particularly dry areas dependent on irrigation, farmers may stop growing crops altogether and switch to ranching. In Weld County, Colo., for example, large-scale drilling accompanied a large decline in irrigation (Figure 3).
Concerns associated with water quality may also affect the decisions of farmers. The Food Safety and Modernization Act of 2010 requires pre-testing of all water used for irrigation. Any decrease in water quality caused by nearby shale development could reduce the water available for irrigation or force farmers to find alternative sources of water that meet the Act’s quality standards. In addition, many farms are also valued for their use as a rural residence, not for production. The potential human health implications described in Finkel and Law (2011) could make such farms less desirable as residences, thereby lowering their value and the well-being of their residents.
Livestock farms are also sensitive to changes in water quality. A recent study by Bamberger and Oswald (2012) suggests that livestock are highly susceptible to water quality impacts from shale gas development. Water contamination effects on livestock health may encourage some livestock farmers to transition to growing crops or to relocate their farms. In addition, organic farmers in areas with shale development areas may face consumers’ fears regarding the quality of their products. This concern has led the Pennsylvania Association for Sustainable Agriculture to call for a moratorium on shale development until the state has fully evaluated its impacts on water quality, food safety, and farmer well-being. Some organic food companies have expressed concern that they could lose their organic accreditation due to nearby unconventional gas development (Miller, 2012).
Aside from water, shale development can affect the price of other agricultural inputs such as labor, land, and infrastructure. Weber (2012) finds that shale gas development added about 1,780 jobs and $69 million in wages in counties in Colorado, Texas, and Wyoming that experienced a boom in natural gas production. While the workers directly involved in drilling, completing, and operating a well are highly specialized, demand for labor in supporting services, such as driving and construction, could force farms to pay higher wages to retain their similarly skilled workers. There is evidence that greater shale development caused the average wage per job in a county to increase, though the effect varies by region (Brown, 2014; and Weber, 2014). In the Bakken Shale region of North Dakota, in particular, finding seasonal workers has become difficult and most farmers are resorting to labor from foreign countries who work under H-2A visas (Deede, 2014). Temporary workers around drilling areas typically rent housing, which has caused rental prices to escalate. In Bradford County of Pennsylvania, houses that previously rented for $500/month could rent for $4,500/month due to the increased demand from the industry (Drohan et al., 2012).
Shale development requires land for drilling sites, gas processing facilities, pipelines, access roads, and water impoundments. Drilling itself occupies relatively little land. Five acres from which multiple wells are drilled can provide the capability to extract gas from about 500 to 1,000 acres (U.S. Department of Energy, National Energy Technology Laboratory (NETL), 2013). Other infrastructure, however, such as access roads and water impoundment areas, also requires land. Companies must clear the right of way over any pipelines they wish to install (Williams, 2012). Many agricultural activities can occur on top of pipeline rights of way, though the disturbing of the soil can lower crop yields. Drohan et al. (2012) find that if all the wells permitted in the Marcellus Shale area in Pennsylvania by June 2011 were developed, it would convert at least 1,600 to 2,600 acres of agricultural land and 1,300 to 2,200 acres of forest land into industrial land.
When farmers do not own the mineral rights to their land, they are unable to direct where wells are placed on their property. Gibson (2013) finds that oil companies in North Dakota drilling in the Bakken often do not respond to even modest requests for change, such as moving a well pad to the other side of a fence to allow for calving. In one North Dakota example documented by Gibson, a farmer could not profitably farm around a 7-acre well pad that was built in the middle of a 20-acre field. Although he received compensation for the loss of use created by the well pad area, it did not cover his losses.
Farms are also affected by an increase in the price of inputs that are used in shale gas development. For example, mulch and straw are used for erosion and sedimentation control on gas sites, but also for animal bedding (Drohan et al., 2012). On the other hand, lower natural gas prices can bring down the cost of nitrogen-based fertilizers since natural gas accounts for about 70% to 90% of the estimated cost of producing them (Pirog and Ratner, 2012). However, the high demand for fertilizers in recent years has translated mainly into increased profits for fertilizer producers compared to cost savings for fertilizer consumers (Pirog and Ratner, 2012).
Greater demand for transportation infrastructure from the oil and gas industry can affect farmers in several ways. Produced oil and gas can be transported by rail, increasing competition for rail resources that farmers rely on for marketing their crops. Olson (2014) estimates that rail shipment delays have caused a loss of $66.6 million in North Dakota’s farm-level revenue for crops that were sold from January through April 2014. In addition, increased truck traffic damages roads, particularly dirt roads, which farmers rely on to move their machinery and agricultural products. Abramzon et al. (2014) find that a new well in Pennsylvania required on average about 600 to 1,100 one-way loaded heavy truck trips. They estimate that heavy truck traffic on Pennsylvania’s state-maintained roadways from shale gas development in 2011 created roughly $13,000 to $23,000 worth of damages per well. Other costs from truck traffic include declining health of livestock due to air pollution. In North Dakota, Bakken-related truck traffic on red-rock gravel roads creates dust. Gibson (2013) found that cattle sometimes reject the dust-laden feed, refuse to lay in the dusty hay, and even die from dust pneumonia. In the long run, farmers could benefit from the subsequent repair of a damaged road or the conversion of dirt roads to asphalt. Similarly, farmers gain from railroad and highway expansions driven by the demand from the oil and gas industry.
In 2011, energy lease and royalty payments to farmers amounted to $2.3 billion, almost half the value of payments provided by the USDA’s direct payment commodity program, which was on average the largest federal farm income support program in the 2000s (Weber, Brown, and Pender, 2013). This increased wealth, in turn, may have various effects on farmer decisions. Payments may provide farmers with the money to expand and upgrade their operations, thereby improving their farms’ long-term financial viability. Alternatively, the payments may allow marginally profitable farmers to retire early or switch to less labor intensive activities, for example, from dairy to beef cattle. The combination of early retirement among farmers and greater investment for others may cause the consolidation of production and land ownership.
Subsurface rights in most of the continental United States are privately owned. Before drilling for oil and gas, companies must lease the rights from the owner through a lease contract, which specify a payment to the owner for signing the lease (often called a bonus payment) and a percentage of the value of production to be paid to the owner (the royalty). The lease will also state a time after which the lease expires if production has not occurred. Upon expiration, the farmer may sign a new lease, earning a new bonus payment. Bonus payments may range from a few dollars to $9,000 an acre (Andrews, 2009; and Pronko, 2013). The standard royalty rate is 12.5%, though this rate can be much higher if there is a strong likelihood of marketable production (Fitzgerald and Rucker, 2013).
Because royalty payments are based on the value of production, they will vary substantially over time as the productivity of wells and energy prices change. A typical shale gas well can produce between 1 and 5 million cubic feet per day during the first month, but production can decline by nearly 70% by the end of the first year (King, 2014). After the initial rapid decline in production, wells can continue to produce gas at a slowly declining rate. There are differences in the methodology and parameters used in life-cycle analyses of well productivity (Branosky, Stevens, and Forbes, 2012), leading to production forecasts that vary from 20 (King, 2014) to 70 years (Fuquay, 2013). For a well that produces 2 million cubic feet of gas per day in the first month and an assumed natural gas price of $4 per thousand cubic feet, annual royalties would start at $200,000, drop to $80,000 in the first and second years, and decline to $23,000 in the sixth year (King, 2014). Since 2008, the wellhead price of natural gas has varied from $3 to $11 per million cubic feet.
Farmers, however, may not always own the rights to the oil and gas beneath the land that they own. In places where oil and gas rights have at one time held meaningful value, they were often severed from the surface rights in what is known as splitting the estate. Where oil and gas rights have value, a landowner may split the estate by selling a property but retaining the rights. Most of the areas with shale oil and gas resources have some history of drilling, making it less likely that the surface owners own the rights to the oil and gas below. Recently, Weber and Hitaj (2014) found small effects of shale gas development on farm real estate values in Texas’ Barnett Shale. In contrast, shale development had a large positive effect on farm real estate in northeastern Pennsylvania, which does not have a history of drilling. The contrasting results likely reflect the prevalence of split estates.
Aside from affecting the profitability of farms, shale development can influence the well-being of farm households if the livability of their surrounding communities changes. The extraction, processing, and transportation of oil and gas have led to substantial decreases in air quality in some areas (Litovitz et al., 2013; and Rich, Grover, and Sattler, 2014), which have been implicated as the potential cause of nearby infant health issues (Hill, 2012). Noise and light pollution occur near shale wells and processing facilities (Clark et al., 2013). Differences in regulations across states can affect the magnitude of these negative impacts (Richardson et al., 2013). In New York and Pennsylvania, residents have expressed concern about the effects of a large influx of workers, and there is evidence that criminal activity can increase in counties experiencing drilling (Stedman et al., 2012; and James and Smith, 2014). Both prostitution and drug use have risen in the Bakken Shale (Boyce, 2014), while the fracking boom in Texas has been connected with a rise in fatal traffic accidents (Olsen, 2014).
Shale development can also create community tensions by increasing inequality (Schafft et al., 2014). Kelsey, Metcalf, and Salcedo (2012) found that lease and royalty income is heavily skewed to a small portion of residents in the Marcellus Shale. In some counties, only 11.3% of lease and royalty income accrues to the bottom 90% of landowners residing in the county.
Despite its various community costs, shale development has improved state and municipal finances through driller fees, severance taxes on gas production, or well fees. In 2011 and 2012, for example, Pennsylvania raised over $400 million in revenue through a per-well impact fee, some of which is allocated to local governments that host drilling operations (McNulty, 2013) to help off-set some of the aforementioned negatives that can occur with rapid business expansions in areas not prepared for the boom. Moreover, in some states, local governments can tax the value of oil and gas rights as property. Looking at the Barnett Shale in Texas, Weber, Burnett, and Xiarchos (2014) found that expansion in the local property tax base through appreciation of oil and gas rights led to greater school spending and higher housing values in shale areas.
Shale development has a range of diverse consequences for agriculture. They can be positive or negative and vary at the regional, local, and even farm levels. Farms in the Marcellus Shale are unlikely to face water quantity issues, compared to areas in North Dakota or Colorado, where water is scarce. Even there, the impact can vary across farms and over time. Farmers in areas without prior oil or gas drilling experience, such as northeastern Pennsylvania, are more likely to own their mineral rights and receive royalty income, which they can then invest in the farm.
The long-term effects of development, both economic and environmental, are still unclear since large-scale drilling began only in the early 2000s in Texas and later elsewhere. By financing investment, expansion, or retirement, the wealth created through lease and royalty payments may have long-term consequences for the agricultural landscape even after well production stops. Likewise, spills or other environmental mishaps could degrade some parcels of land for decades. In balance, shale development comes with challenges and opportunities for farmers and their rural communities with uncertain, long-term effects.
Abramzon, S., C. Samaras, A. Curtright, A. Litovitz, and N. Burger. 2014. “Estimating the Consumptive Use Costs of Shale Natural Gas Extraction on Pennsylvania Roadways.” Journal of Infrastructure Systems 20 (3).
Andrews, A. 2009. Unconventional Gas Shales: Development, Technology, and Policy Issues. Darby, Pa.: Diane Publishing.
Bamberger, M., and R.E. Oswald. 2012. “Impacts of Gas Drilling on Human and Animal Health” New Solutions 22 (1): 51-77.
Boyce, D. 2014. “Booming Oil Fields May be Giving Sex Trafficking a Boost.” National Public Radio. Available online: http://www.npr.org/2014/02/01/265698046/booming-oil-fields-may-be-giving-sex-trafficking-a-boost.
Branosky, E., A. Stevens, and S. Forbes. 2012. Defining the Shale Gas Life Cycle: A Framework for Identifying and Mitigating Environmental Impacts. World Resources Institute Working Paper. Available online: http://www.wri.org/publication/shale-gas-life-cycle-framework-for-impacts.
Brown, J.P. 2014. “Production of Natural Gas from Shale in Local Economies: A Resource Blessing or Curse?” Economic Review (1). Federal Reserve Bank of Kansas City.
Clark, C., A. Burnham, C. Harto, and R. Horner. 2013. Hydraulic Fracturing and Shale Gas Production: Technology, Impacts, and Regulations. Argonne National Laboratory: ANL/EVS/R-12/5.
Colorado Geological Survey. 2014. Oil and Gas Wells Drilled by July 2014. Colorado School of Mines, Golden, CO.
Deede, J. 2014. Balancing Oil and Agriculture. Shale Plays Media, 1 August. Available online: www.eaglefordtexas.com.
Drohan, P.J., M. Brittingham, J. Bishop, and K.Yoder. 2012. “Early Trends in Landcover Change and Forest Fragmentation Due to Shale-Gas Development in Pennsylvania: A Potential Outcome for the Northcentral Appalachians.” Environmental Management 49 (5): 1061-1075.
Finkel, M.L., and A. Law. 2011. “The Rush to Drill for Natural Gas: A Public Health Cautionary Tale.” Public Health 101(5): 784-785.
Fitzgerald, T. and R.R. Rucker. 2013. Estimates of U.S. Private Oil and Natural Gas Royalties. Montana State University, Department of Agricultural Economics/Department of Economics staff paper.
Freyman, M. 2014. Hydraulic Fracturing and Water Stress: Water Demand by the Numbers. A Ceres Report.
Fuquay, J. 2013. “Report Questions Long-Term Productivity of Gas Wells in Barnett Shale.” Fort Worth Star Telegram. Available online: http://www.star-telegram.com/2013/02/12/4617558/report-questions-long-term-productivity.html.
Gibson, J.W. 2013. “Bombing North Dakota: Living Amid the Bakken Oil Boom.” Earth Island Journal 27(4).
Gold, R. and A. Campoy. 2011. “Oil’s growing thirst for water.” Wall Street Journal. Available from: http://online.wsj.com/news/articles/SB10001424052970204528204577009930222847246.
Healy, J. 2012. “For farms in the west, oil wells are thirsty rivals.” The New York Times. Available from: http://www.nytimes.com/2012/09/06/us/struggle-for-water-in-colorado-with-rise-in-fracking.html?pagewanted=all&_r=0.
Hill, E. 2012. “Unconventional natural gas development and infant health: Evidence from Pennsylvania.” Charles H. Dyson School of Applied Economics and Management Working Paper 12.
James, A., and B. Smith. 2014. “There Will be Blood: Crime Rates in Shale-Rich U.S. Counties.” Oxford Centre for the Analysis of Resource Rich Economics Research Paper 140.
Kargbo, D.M., R.G. Wilhelm, and D.J. Campbell. 2010. “Natural Gas Plays in the Marcellus Shale: Challenges and Potential Opportunities.” Environmental Science and Technology 44: 5679-5684.
Kelsey, T.W., A. Metcalf, and R. Salcedo. 2012. Marcellus Shale: Land Ownership, Local Voice, and the Distribution of Lease and Royalty Dollars. Pennsylvania State Center for Economic and Community Development Research Paper Series.
King, H. 2014. “Production and Royalty Declines in a Natural Gas Well Over Time.” Geology.com. Available online:
http://geology.com/royalty/production-decline.shtml.
Litovitz, A., A. Curtright, S. Abramzon, N. Burger, and C. Samaras. 2013. “Estimation of Regional Air-Quality Damages from Marcellus Shale Natural Gas Extraction in Pennsylvania.” Environmental Research Letters 8: 1-8.
McNulty, T. 2013. “Marcellus Shale Drillers to Pay $202.47M in Per-Well Impact Fees for 2012.” Pittsburgh Post-Gazette. Available online: http://www.post-gazette.com/local/region/2013/06/13/Marcellus-Shale-drillers-to-pay-202-47M-in-per-well-impact-fees-for-2012/stories/201306130392.
Miller, J. 2012. “ ‘Fracking’ a Big Concern for Growing Nunda Organic Foods Company.” Hornell Evening Tribune. Available online: http://www.eveningtribune.com/x430730443/-Fracking-a-big-concern-for-growing-Nunda-organic-foods-company.
Nicot, J., and B.R. Scanlon. 2012. “Water Use for Shale-Gas Production in Texas, U.S.” Environmental Science and Technology 46 (6): 3580-3586.
Nixon, R. 2014. “Grain Piles up, Waiting for a Ride, as tTains Move North Dakota Oil.” The New York Times. Available online: http://www.nytimes.com/2014/08/26/us/grain-piles-up-waiting-for-a-ride-as-trains-move-north-dakota-oil.html?_r=1.
Osborn, S.G., A. Vengosh, N.R. Warner, and R.B. Jackson. 2011. “Methane Contamination of Drinking Water Accompanying Gas-Well Drilling and Hydraulic Fracturing.” Proceedings of the National Academy of Sciences 108 (20): 8172-8176.
Olmstead, S.M., L.A. Muehlenbachs, J. Shih, J.Z Chu, and A.J. Krupnick. 2013. “Shale Gas Development Impacts on Surface Water Quality in Pennsylvania.” Proceedings of the National Academy of Sciences 110 (13): 4962-4967.
Olsen, L. 2014. "Fracking Boom Increases ‘Triple Tragedies’ on Texas Highways.” Houston Chronicle. Available online: http://www.houstonchronicle.com/news/science-environment/article/Fracking-boom-increases-triple-tragedies-on-5760588.php#/0.
Olson, F. 2014. “Effects of 2013/14 Rail Transportation Problems on North Dakota Farm Income.” North Dakota State University, requested by Senator Heidi Heitkamp.
Pacsi, A.P., N.S. Alhajeri, D. Zavala-Araiza, M.D. Webster, and D.T. Allen. 2013. “Regional Air Quality Impacts of Increased Natural Gas Production and Use in Texas.” Environmental Science and Technology 47: 3521-3527.
Pirog, R., and M. Ratner. 2012. Natural Gas in the US Economy: Opportunities for Growth. R42814, Congressional Research Service, U.S. Congress, Washington, D.C.
Pronko, R.B. 2013. "Landowner Lease Groups: Finding Strength in Numbers.” Pennsylvania Business Central. Available online: http://www.pabusinesscentral.com/landowner-lease-groups-finding-strength-in-numbers/.
Rich, A., J.P. Grover, and M.L. Sattler. 2014. “An Exploratory Study of Air Emissions Associated with Shale Gas Development and Production in the Barnett Shale.” Journal of the Air and Waste Management Association 64 (1): 61-72.
Richardson, N., M. Gottlieb, A. Krupnick, and H. Wiseman. 2013. The State of State Shale Gas Regulation. Resources for the Future Report.
Schafft, K.A., L.L. Glenna, B. Green, and Y. Borlu. 2014. “Local Impacts of Unconventional Gas Development within Pennsylvania’s Marcellus Shale Region: Gauging Boomtown Development through the Perspectives of Educational Administrators.” Society and Natural Resources: An International Journal 27 (4): 389-404.
Stedman, R.C., J.B. Jacquet, M.R. Filteau, F.K. Willits, K.J. Brasier, and D.K. McLaughlin. 2012. “Marcellus Shale Gas Development New Boomtown Research: Views of New York and Pennsylvania Residents.” Environmental Practice 14 (4): 382-393.
U.S. Department of Agriculture, Economic Research Service. 2014. “County-Level oil and gas production in the U.S.” Available online: http://www.ers.usda.gov/data-products/county-level-oil-and-gas-production-in-the-us.aspx#.VCW3jfldXF8. Washington, D.C.
U.S. Department of Agriculture, Economic Research Services. 2013. Major Land Uses: Overview. Available online: http://www.ers.usda.gov/data-products/major-land-uses.aspx#25962. Washington, D.C.
U.S. Department of Agriculture, National Agricultural Statistics Service. 2012. Census of Agriculture. Available online: http://www.agcensus.usda.gov/Publications/. Washington, D.C.
U.S. Department of Agriculture, National Agricultural Statistics Service. 2002. Census of Agriculture. Available online: http://www.agcensus.usda.gov/Publications/. Washington, D.C.
U.S. Department of Energy. 2009. “Modern shale gas development in the United States: A primer.” Work prepared under DE-FG26-04NT15455 by Ground Water Protection Council and ALL Consulting.
U.S. Department of Energy, National Energy Technology Laboratory. 2013. Modern Shale Gas Development in the United States: An Update. Available online: http://www.netl.doe.gov/File%20Library/Research/Oil-Gas/shale-gas-primer-update-2013.pdf.
Weber, J.G. 2014. “A Decade of Natural Gas Development: The Makings of a Resource Curse?” Resource and Energy Economics 37: 168-183.
Weber, J.G., J.W. Burnett, and I.M. Xiarchos. 2014. “Shale Gas Development and Housing Values over a Decade: Evidence from the Barnett Shale.” 2014 U.S. Association for Energy Economics Proceedings Paper. Available online: http://works.bepress.com/wesley_burnett/9.
Weber, J.G., J.P. Brown, and J. Pender. 2013. "Rural Wealth Creation and Emerging Energy Industries: Lease and Royalty Payments to Farm Households and Businesses.” Federal Reserve Bank of Kansas City Working Paper RWP 13-07.
Weber, J.G. and C. Hitaj. 2014. “What can we learn about shale gas development from land values? Opportunities, challenges, and evidence from Texas and Pennsylvania.” Paper presented at the Agricultural & Applied Economics Association’s 2014 AAEA & CAES Joint Annual Meeting.
Weber, J.G. 2012. “The Effects of a Natural Gas Boom on Employment and Income in Colorado, Texas, and Wyoming.” Energy Economics 34(5): 1580-1588.
Williams, S. 2012. Discovering Shale Gas: An Investor Guide to Hydraulic Fracturing. Sustainable Investments Institute and Investor Responsibility Research Center Institute.

