Figure 1. Cumulative U.S. Soybean Exports during the
Marketing Year, by Destination
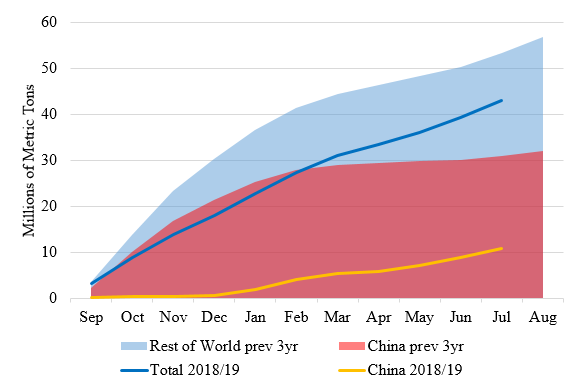
Notes: Author calculations based on U.S. census data.

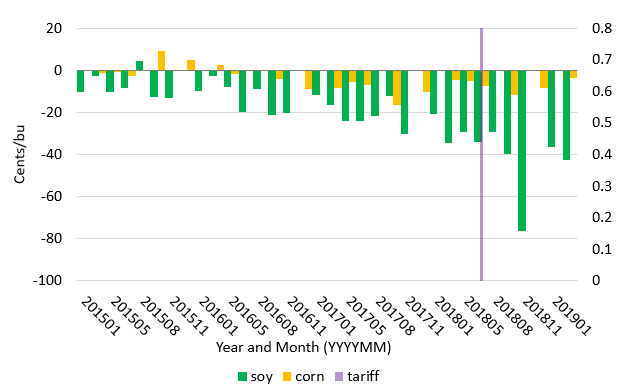
Notes: Geograin.com price bids are aggregated to the county level
and then used to generate an unweighted average; only those
counties with sufficient observations are included. “yoy” denotes
year-over-year. The x axis indicates the week of the year
(e.g., “201801” is first week of 2018).
Notes: Author calculations based on U.S. census data.

Notes: Geograin.com price bids are aggregated to the county level;
only those counties with sufficient observations are included.
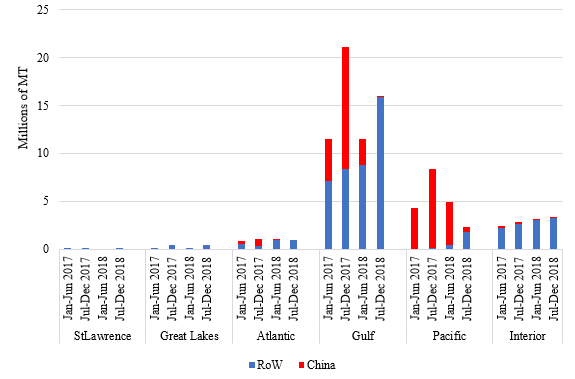
Notes: Author calculations based on USDA Foreign Grain Inspection
Service data.
Notes: Geograin.com price bids are aggregated to the county level.
In response to U.S. Section 232 (national security) tariffs on imports of steel and aluminum on key trading partners and Section 301 (technological transfer) tariffs on Chinese products in 2018, several of major U.S. trading partners imposed retaliatory tariffs on U.S. exports (Bown and Kolb, 2019); agricultural goods in particular were disproportionately targeted. China imposed retaliatory tariffs on virtually all U.S. agricultural exports in July 2018, including a 25% additional tariff on soybeans, the single largest U.S. agricultural export. In 2016/2017, the value of soybeans exported by the United States ($23.8 billion) was 2.5 times greater than the next largest exported commodity, corn (U.S. Department of Agriculture, 2018a).
Normally, the United States exports about half of the soybeans that it grows, and well over half of those are purchased by Chinese buyers. For example, in 2016/2017—the last full marketing year prior to the trade tensions—U.S. exporters shipped 36 million metric tons (MMT) of soybeans to China, 61% of the total 59 MMT of U.S. soybean exports that year; that same year, exports accounted for 50.4% of the 117 MMT U.S. production (Gale, Valdes, and Ash, 2019). In sum, the United States exported to China nearly one out of three soybean rows its producers harvested during 2016/2017.
However, China’s retaliatory tariffs led to drastic reductions in U.S. soybean exports, especially those destined for China. These changes are illustrated by the simple comparison shown in Figure 1. Over the three marketing years between 2015/2016 and 2017/2018, the United States exported an average 30.9 MMT of soybeans to China during the September–July period. During the same period in 2018/2019, U.S. soybean exports to China totaled just 10.78 MMT, a 65% drop.
At the same time, U.S. soybean exports to the rest of the world did not increase enough to make up for the amount displaced by China’s tariff policy. From September 2018 to July 2019, U.S. soybean exports to China fell by 20.1 MMT from the previous three-year average, but the amount of soybeans purchased by other trading partners (e.g., Argentina, the European Union, and Egypt) increased by a much smaller amount (see also Hitchner, Menzie and Meyer in this Choices theme). Taken together, total U.S. exports of soybeans were 10.4 MMT lower in the September to July period compared to the average of the most recent three-year period, even though the U.S. harvest in the fall of 2018 was the largest on record (USDA, 2019b). Although the USDA (2019b) estimates a slightly higher crush in 2018/2019 year-over-year, many of the displaced U.S. soybean exports found their way into domestic storage facilities (Singh, Almeida, and Parker, 2018). Indeed, the latest USDA World Agricultural Supply and Demand (WASDE) estimates U.S. ending soybean stock levels for the 2018/2019 marketing year at nearly 25 MMT, compared to less than 12 MMT the year prior. It should be noted that following severe flooding and adverse planting conditions in the spring (Nafziger, 2019; Kennedy, 2019), the USDA (2019b) projects 2019/20 ending stocks of 12.9 MMT.
As export opportunities evaporated amid the largest-ever soybean harvest, soybean cash market prices fell. In many areas the basis—the difference between the price paid to producers in a local market and the price of (usually the nearest-to-expire) futures contracts listed at the Chicago Board of Trade (CBOT)—widened considerably. In economic terms, the soybean basis represents the difference between local supply and demand conditions and a liquid, globally influenced price benchmark. As the cash price increases relative to futures, the basis is said to “narrow” or “strengthen”; as the cash price falls, the basis is said to “widen” or “weaken.” Local commodity prices are often quoted in terms of basis, and producers compare the basis against its historical levels as an indicator that influences marketing decisions.
The basis is affected by many factors, including transportation costs (the more expensive it is to transport grain, the weaker the basis gets in exporting areas), crop quality (higher quality generally supports a stronger basis), seasonality (basis tends to be weakest when supply is greatest—at harvest), and storage price/availability (more expensive or scarce storage lowers the commodity price today relative to the future). A tariff that displaces exports can weaken the basis if it puts pressure on storage facilities or re-routes transport chains and increases shipping costs, leading purchasers to reduce their cash market bids. But large harvests also tend to weaken the basis, especially in areas where currently available supplies are sufficient to meet demand. Around the same time that China imposed its soybean tariff, the USDA (2018b) began to increase its projections for the 2018 harvest of both soybeans and corn.
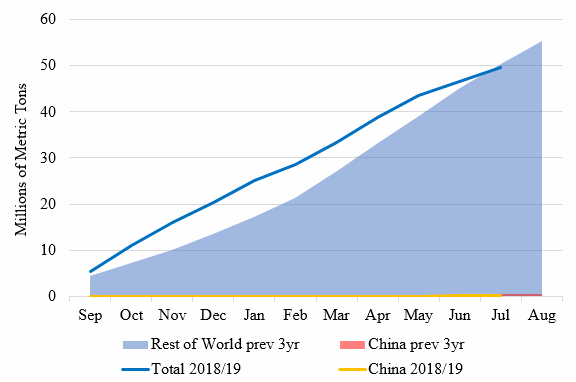
Figure 2 plots the national average weekly basis deviations observed during 2018/2019 against both the 2015/2017 average and the prior year alone; corn is included in the chart as a graphical control, since it was not expected to be as sensitive to China’s retaliatory tariff and corn production in the United States was also unexpectedly large in the fall of 2018—the third-highest on record. The U.S. corn crop is less sensitive to exports (comprising just 17% of production in 2017/2018, compared to 48% for soybeans), and U.S. corn exports to China are fractional compared to soybeans (U.S. Department of Agriculture, 2018b, 2019b), mostly due to government policies that raised China’s domestic planted area and limited its import competition (Hansen et al., 2017). Figure 3 shows that—unlike soybeans—total U.S. corn exports in 2018/2019 were not meaningfully reduced as a result of the trade disruptions, compared to the prior year. The soybean basis did appear to strengthen towards the end of 2018, which may have been attributed in part to seasonal factors and a pickup of exports to alternative markets.
Figure 2 clearly shows that the average U.S. soybean basis fell considerably after China imposed its 25% retaliatory tariff in July 2018. By the beginning of September, U.S. producers were quoted an average price of 95 cents per bushel under the next-delivery November futures, nearly 60 cents lower than they were in 2015/2017, on average. And the price quotes they received were over 30 cents lower per bushel (relative to futures) than they were the previous year, which saw the second-largest U.S. harvest ever. In Figure 2, the average corn basis also weakened beginning in July 2018, relative to its mean value from 2015/2017, as well as its value in 2017 alone. But by early September 2018, corn bids reflected basis levels just 4 cents per bushel wider than average levels from 2015/2017 and 3 cents narrower than they were in 2017. Clearly, although both crops were historically large in 2018, soybeans suffered historically weak basis levels following China’s tariff retaliation, while corn did not.
The soybean tariff impacted some regions more than others. Figure 4 maps the June–September monthly average soybean and corn basis over the three-year period from 2015-2017 and the 2018 deviations from those values at the county level. For both commodities, basis normally tends to be weakest in the Upper Midwest and Plains states, particularly in areas distant from navigable waterways (note the dark blue locations), which lack easy access to futures contract delivery points and/or Gulf export opportunities. As 2018 progressed, corn basis did not deviate much from its historical levels over space, but the soybean basis began to widen significantly after China retaliated in July—especially in the Upper Midwest as the new crop began to come in.
The spatial heterogeneity in basis surfaces depicted in Figure 4 is at least partially explained by disruption of traditional export routes. In normal years, most of the soybeans grown in the Upper Midwest are transported west by rail for eventual export to Asia (especially China) from U.S. ports on the Pacific (Hitchner, Menzie and Meyers, 2019): For North Dakota, around 70% of production is exported from those Western ports (Singh, Almeida, and Parker, 2018). While China’s retaliatory tariff slashed Chinese purchases of U.S. soybeans from all U.S. ports over the second half of 2018 (as shown in Figure 5), it especially drove down soybean exports from the West Coast. Soybeans inspected or weighed for export at Pacific ports during the second half of 2018 fell by over 70% compared to the same timeframe one year earlier, and the amount destined for China fell by 94%. Losing an export market of that size was especially damaging to producers in the Upper Midwest, since those areas lack the crushing capacity to address the local surplus and transport to the Gulf (and alternative foreign destinations) from the region is very costly (Kennedy, 2018; McNew, 2018; Clayton, 2018). As a result, producers there were offered very low prices by local buyers. For example, by September 20, the average bid for soybeans in Burke County, North Dakota, was more than $2 per bushel under the November futures price—nearly a full dollar lower than local producers were offered one year earlier, relative to futures. Famers in the hardest-hit areas could have stored their beans, waiting it out until the local situation improved, but financial constraints and lack of on-farm storage facilities likely forced many producers to exchange their soybean crop for lower cash prices.
Ordinarily, the basis converges to (near) zero in delivery territories as a futures contract expires. Soybean futures can be satisfied via physical delivery of the commodity in specified cash markets so (even the threat of) buying and selling to arbitrage the difference should force the cash and futures prices to equilibrate (within a range allowing for transactions costs). This convergence is important if
Convergence is not a given. During the second half of the 2000s, the CBOT soft red wheat (SRW) contract (but also the CBOT corn, soybean, and KC HRW Wheat Futures contracts) repeatedly failed to converge, with cash prices in delivery territories well below the price of expiring futures contracts. As explained by Irwin (2018) and Adjemian et al. (2013), this nonconvergence episode was most likely the product of artificially low storage fees for delivery instruments. Rather than requiring the transfer of actual physical grain, the delivery process for these futures contracts actually obliges the seller to provide the buyer with transferable delivery instruments (shipping certificates in the case of soybean futures) that permit the holder the right to load physical grain out of a warehouse. The futures exchange mandates that the holder of a certificate pay a storage fee. When these exchange-set storage fees become less expensive than the market price of physical storage, holding these instruments becomes more attractive, causing the futures price to rise higher and widen the basis. The futures price decouples from the expected cash market price, and the futures market fails to converge.
The market price of storage rises as the demand for storage grows, all else equal. And the demand for storing soybeans in the United States grew to historic levels after China imposed its retaliatory tariff ahead of the largest U.S. soybean harvest on record. Media reports indicate that space for storing soybeans became very tight in the latter half of 2018: Some farmers resorted to storing them in plastic bags and piling them on the ground, risking deterioration (Singh, Almeida, and Parker, 2018; Clayton, 2018). The CBOT announced that it intends to raise its storage fee for CBOT soybean and corn futures contracts from 5 cents to 8 cents per bushel per month beginning in late 2019 (CME, 2018). However, these changes did not apply to the contracts traded during the tariff disruption.
Figure 6 plots the average basis over the first five delivery days in counties that include standard delivery locations (i.e., “par,” or areas where the commodity can be physically delivered in return for the futures contract price) for the CBOT soybean and corn futures contract expirations, from 2015 to the present. Corn convergence at these locations was healthier over the period, generally falling within about 10 cents/bushel of the expiring futures contract price. But the difference between soybean cash prices at these locations relative to futures widened notably after China imposed its retaliatory tariff in July 2018. The average basis over the first five delivery days for the following September, November, January, and March soybean contract expiries was −40 cents/bu, −76 cents/bu, −37 cents/bu, and −43 cents/bu in par locations, respectively, well outside the range observed over the previous several years. Even though the 2018 U.S. corn harvest was similarly very large, the weakest per-county delivery basis for the CBOT corn contract was observed in September 2018, averaging −12 cents/bu over the first five delivery days. Although both commodities have the same futures contract storage fee, only soybean convergence at these locations worsened in late 2018, likely as a result of China’s tariff retaliation. The bottom line is that soybean producers in these areas, even if they had hedged around planting time and before China imposed tariffs, were not protected against their impact on U.S. soybean prices.
Producers responded to the retaliatory tariff, in part, by shifting away from soybean production in 2019 (Wilde, 2019). Soybean planted acreage in the United States fell by 14%, while acreage planted to feed grains like corn increased by 1% (USDA, 2019b). In addition, severe flooding and adverse planting conditions for soybeans contributed to a smaller crop and tighter stock conditions this year (Nafziger, 2019; Kennedy, 2019), strengthening the basis and improving convergence conditions compared to what was observed in 2018.
China’s retaliatory tariff effectively shut off Pacific ports as a major export channel for U.S. soybeans. Alternative foreign markets did not make up the difference. As a result, U.S. soybean inventories spiked in late 2018. Many U.S. producers, especially in the Upper Midwest, received lower prices for their crop than they would have without the tariff retaliation. And the additional inventory demand likely weakened the effectiveness of hedging strategies—even hedging at planting time could not shield U.S. producers that year. But adverse planting conditions, a smaller crop, and tighter inventory conditions contributed to a stronger soybean basis in 2019.
Adjemian, M.K., P. Garcia, S. Irwin, and A. Smith. 2013. “Non-Convergence in Domestic Commodity Markets: Causes, Consequences, and Remedies.” Washington, DC: U.S. Department of Agriculture, Economic Research Service, Economic Information Bulletin EIB-115.
Bown, C.P., and M. Kolb. 2019. “Trump’s Trade War Timeline: An Up-to-Date Guide.” Peterson Institute for International Economics. Available online: https://piie.com/blogs/trade-investment-policy-watch/trump-trade-war-china-date-guide.
Chicago Mercantile Exchange (CME). 2018. “Increase in Premium Charge for Corn, Mini-Sized Corn, Soybeans, and MiniSized Soybean Futures Contracts Effective Fourth Quarter 2019.” Chicago, IL: CME Group Special Executive Report 8198RRR, October. Available online: https://www.cmegroup.com/content/dam/cmegroup/notices/ser/2018/10/SER-8198RRR.pdf.
Clayton, C. 2018, August 30. “North Dakota Marketing Challenges: Farmers Typically Sell Soybeans at Harvest, but May Have to Scramble to Store Them.” Progressive Farmer. Available online: https://www.dtnpf.com/agriculture/web/ag/news/article/2018/08/30/farmers-typically-sell-soybeans-may.
Gale, F., C. Valdes, and M. Ash. 2019. Interdependence of China, United States and Brazil in Soybean Trade. Washington, DC: U.S. Department of Agriculture, Economic Research Service, Special Outlook Report OCS-19F-01, June.
Hansen, J., M. Marchant, F. Tuan, and A. Somwaru. 2017. “U.S. Agricultural Exports to China Increased Rapidly Making China the Number One Market." Choices 32(2): 1–6.
Irwin, S. H. 2018. “Trilogy for Troubleshooting Convergence: Manipulation, Structural Imbalance, and Storage Rates.” Journal of Commodity Markets, forthcoming.
Kennedy, M. 2018, September 17. “Lack of Pacific Northwest Export Bids Keeping New-Crop Soybean Basis in the Cellar.” Progressive Farmer. Available online: https://www.dtnpf.com/agriculture/web/ag/blogs/market-matters-blog/blog-post/20181/09/17/lack-pacific-northwest-export-bids.
Kennedy, M. 2019, October 28. “Soybean Basis Climbs Out of Cellar.” Progressive Farmer. Available online: https://www.dtnpf.com/agriculture/web/ag/columns/cash-market-moves/article/2019/10/28/soybean-basis-climbs-cellar-2.
McNew, K. 2018. “The Problem with the Pacific Northwest [blog post].” Emergence/Farmers Business Network, Inc. Available online: https://emergence.fbn.com/the-problem-with-the-pacific-northwest.
Nafziger, E. 2019, July 26. “Corn and Soybean Crops at Mid-Season, 2019.” Farmdoc daily (9):137.
Singh, S., I. Almeida, and M. Parker. 2018. “Frozen Out of China, American Farmers Refuse to Sell Their Soy.” Bloomberg. November 12th. Accessed at: https://www.bloomberg.com/news/articles/2018-11-12/frozen-out-of-china-american-farmers-refuse-to-sell-their-soy
U.S. Department of Agriculture (USDA). 2018a. Foreign Agricultural Trade of the United States: Value of U.S. Agricultural Trade, by Fiscal Year [ERS data product]. Washington, DC: U.S. Department of Agriculture, Economic Research Service. Available online: https://www.ers.usda.gov/data-products/foreign-agricultural-trade-of-the-united-states-fatus/fiscal-year/.
U.S. Department of Agriculture (USDA). 2018b. World Agricultural Supply and Demand Estimates. Washington, DC: U.S. Department of Agriculture, Economics, Statistics and Market Information System, July. Available online: https://usda.library.cornell.edu/concern/publications/3t945q76s?locale=en#release-items.
U.S. Department of Agriculture (USDA). 2019a. USDA Agricultural Projections to 2028. Washington, DC: U.S. Department of Agriculture, Office of the Chief Economist, Long-Term Projections Report OCE-2019-1, March. Available online: https://www.ers.usda.gov/webdocs/publications/92600/oce-2019-1.pdf?v=3630.9.
U.S. Department of Agriculture (USDA). 2019b. World Agricultural Supply and Demand Estimates. Washington, DC: U.S. Department of Agriculture, Economics, Statistics and Market Information System, November. Available online: https://www.usda.gov/oce/commodity/wasde/wasde1119.pdf.
Wilde, M. 2019, May 30. “King Corn Adds Acres: Switching Soy Acres to Corn.” Progressive Farmer. Available online: https://www.dtnpf.com/agriculture/web/ag/news/business-inputs/article/2019/05/30/switching-soy-acres-corn.

