

Throughout the recent economic downturn, U.S. agricultural trade was one sector of the economy that remained relatively healthy. Agricultural trade provides a significant contribution to the U.S. agricultural economy and creates positive effects throughout the nonfarm sectors of economy as well.
The United States is a net exporter of agricultural products and this trade surplus helps offset a portion of the U.S. nonfarm trade deficit. In 2010, U.S. agricultural exports reached $115.8 billion, setting a new record (Table 1). With imports valued at $81.9 billion in 2010, the agricultural trade sector recorded a trade surplus of around $33.9 billion; a sharp contrast to the over $668 billion deficit in nonagricultural trade.
The purpose of this article is to provide background information on the important contribution agricultural exports make to the overall economy as a generator for output, employment and income. In addition we will provide an overview of how this contribution is distributed across the United States on a regional basis.
The information provided in this article is based on an analysis using the Impact Analysis for Planning (IMPLAN). This economic input-output model was originally designed in the mid-1970s by the USDA Forest Service for community impact analysis (USDA, NRCS, Economics, updated 8/21/2009). The current version of the model is maintained and sold by the Minnesota IMPLAN Group, MIG, Inc. With over 1,500 clients currently reported to be using this modeling framework the results are accepted and widely used in inter-agency analysis. The IMPLAN model shows the impact of how agricultural exports produce direct and indirect effects on the other industries and sectors that support the flow of U.S. agricultural commodities in international commerce. Accordingly, the output from the model reflects backward linkages in the economy and may actually understate the total overall contribution of the agricultural export sector to the U.S. economy.
In this article we report the findings from our analysis of the contribution of U.S. agricultural exports to the U.S. economy. We provide results for the economy as a whole, along with results of the effects for four regional areas, the South, Midwest, Northeast and West. In addition we provide a comparison with earlier estimates from models that include both forward and backward linkages to provide a feel for the range of effects that agricultural exports may have on total output and employment.
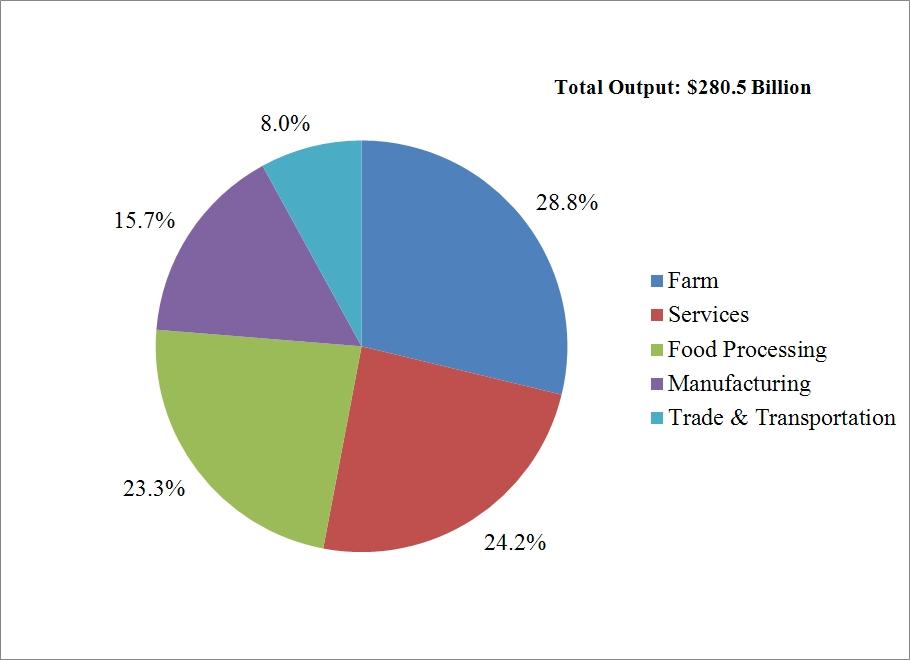
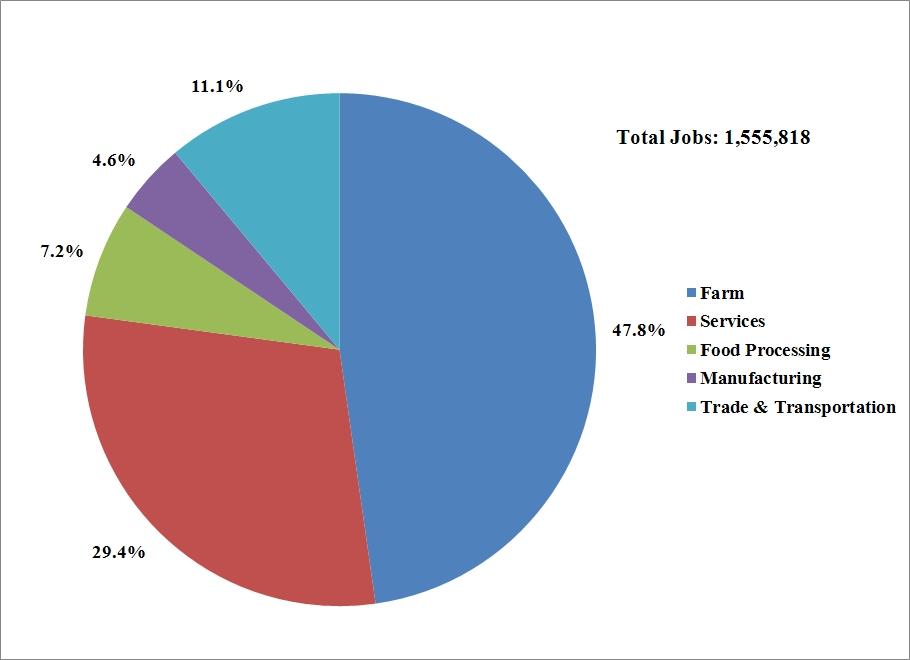
In calendar year 2009, U.S. agricultural exports of $98.4 billion were supported by $280.5 billion in output in sectors throughout the economy (Table 2). Every $1 billion in U.S. agricultural exports generated 15,811 jobs. Employment resulting from agricultural exports included direct farm employment of 742,966 jobs and nonfarm related employment of 812,852 jobs for a total of 1.6 million jobs. The jobs resulting from agricultural exports reflect the output that is stimulated as farmers purchase inputs for production, and as commodities are harvested, transported and stored.
Output and job creation related to agricultural exports is spread across supporting sectors of the economy. In 2009, for example, the $280.5 billion in output created by agricultural exports was largely focused in the farm, services and food processing sectors but also made contributions in the manufacturing, trade and transportation sectors (Figure 1). In the same way employment associated with agricultural exports is also distributed across the various sectors (Figure 2).
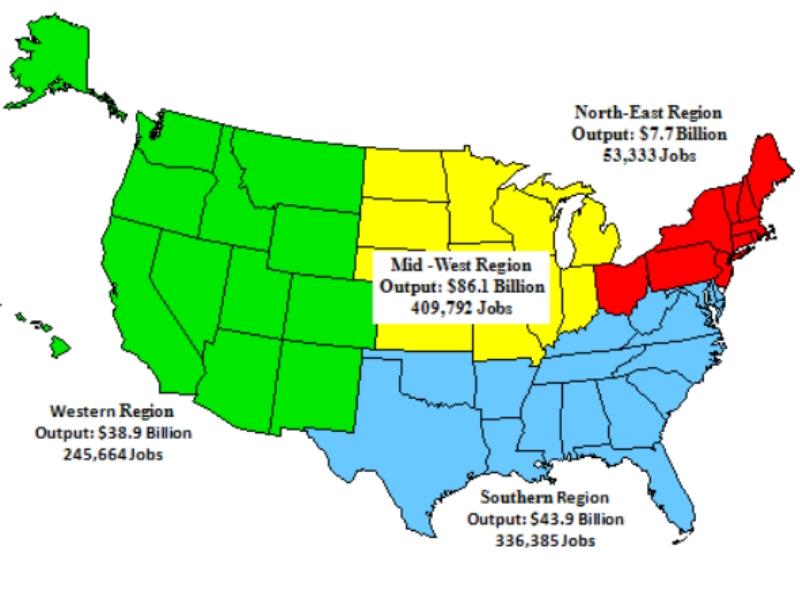
All of U.S. agriculture is dependent to some extent on foreign demand, with some commodities being more dependent than others. The same is true for the areas where those products are grown. Accordingly, the economy in some areas of the country is more influenced by agricultural exports than in other areas. In 2009 the Midwest region received the largest boost in output resulting from agricultural exports, while the Northeast area of the country received the least (Figure 3).
The economic impact of agricultural exports on a regional basis reflects the relative importance of export markets for certain commodities and the geographical concentration of the production of those commodities. The dominant position of the Midwest in overall output generated and number of jobs related to exports reflects in large part the importance of feed grain and oilseed production in the region. In 2009, over 30% of the total value of all agricultural exports was accounted for by feed grain and oilseed products, in large part originating from the Midwestern region. Along with the host of other Midwestern products finding their way to international markets the economic stimulus from trade related activities is greatest for this region. Agricultural exports accounted for over $86 billion of output and around 410,000 jobs in the region in 2009 (Table 3).
While the farm sector impacts were important, nonfarm sectors benefitted from Midwest agricultural exports. In fact, nearly 60% of the total output from exports can be attributed to non-farm sectors. Food processing was most important, with $16 billion in output, followed by services, manufacturing and trade and transportation. The nonfarm sectors accounted for 49% of employment, with trade and transportation being the most important.
The next largest regional impact from agricultural exports is reported for the Southern region. Benefiting from the increasing prices of feed grain and oilseed exports as well as rice and cotton, states in the Southern region are well positioned to meet a sustained increase in international demand for U.S. agricultural products. In addition the numerous sea ports in the Southern region play a vital role in facilitating the movement of products from other regions of the United States to international destinations. In 2009 agricultural exports accounted for $43.8 billion and 336,385 jobs in throughout the region (Table 4).
About 65% of the Southern region output can be attributed to nonfarm sectors. Food processing and services were dominant. Manufacturing and trade and transportation accounted for about 19% of output. Employment concentration was dominated by the farm with 63% of the total jobs. Services accounted for 19% of employment, while trade and transportation was nearly 8% and manufacturing only 2% of jobs attributed to exports. Employment concentration in the farm sector indicates the relative importance of labor intensive jobs associated with crop and livestock production in the region.
The third largest area of impacts resulting from agricultural exports occurs in the Western region. Led by California with individual state agricultural exports valued at $34.8 billion in 2009, the Western region is the source of a wide variety of agricultural commodities including the majority of fruit, tree nuts and vegetables produced in the country, many with important export markets as well. From the total $98.4 billion in U.S. agricultural exports the Western region is assigned an additional $38.9 billion in output (Table 5). An additional 245,664 jobs are also estimated to result from the activities associated with agricultural exports for the western region.
Economic output is concentrated in nonfarm sectors of the Western region economy. Food processing and services dominate, while manufacturing and trade and transportation are about evenly split. Employment from exports favors the farm sector, accounting for 56% of the jobs. Services, however, are also important and account for 24% of jobs, followed by trade and transportation, and then manufacturing.
Characterized by smaller farm size, the Northeast region contributes the least output from U.S. agricultural exports. In 2009 U.S. agricultural exports accounted for a relatively small but important $7.6 billion in output and 53,333 civilian jobs in the region.
Northeast region exports are supported by output attributed mostly to nonfarm sectors, as with the other regions. Food processing is dominant with 28% of output attributed to that activity. Employment is quite different, though, with two-thirds of all regional jobs concentrated on the farm. This high degree of farm jobs associated with exports likely reflects the more labor intensive production of tree fruits and other fresh commodities, along with dairy farming.
While beyond the scope of this report, agricultural commodities imported into the United States also generate additional output. The transformation of imports to consumer goods involves the same type activities—transportation, management, marketing—as do exports. As a result each dollar spent on imports has been estimated to result in additional output from support activities to produce a multiplier of 2.48 (USDA, ERS, FAU-124, April 2008). Using this measure the imports of $71.7 billion of agricultural commodities in 2009 would have generated a domestic output of $177.8 billion. It is important to note that while imports of agricultural products can have a negative effect if they displace products that would otherwise be produced domestically, they do bring a benefit due to their linkage to supporting industry activity.
U.S. agricultural exports make a significant contribution to the overall U.S. economy, supporting $280.5 billion in economic output and 1.6 million jobs nationwide. This output is most heavily concentrated in the Midwestern United States, followed by the Southern region, the West, and then the Northeast. Employment attributed to exports is about evenly split between the Midwest and South, followed by the West and Northeast. Important too is that these economic gains associated with exports are not just accruing to the farm sector. In fact, in most regions of the country, the non-farm sectors of food processing, services, and trade and transportation receive an equal share of both output and employment.
Also important to note is that as the U.S. Congress considers pending trade agreements with Korea, Colombia and Panama, there will be economic gains if these agreements are implemented. The Trans Pacific Partnership also holds promise as creating new markets for U.S. agricultural exports and the associated output they would create. Further, successful completion of the Doha Development Agenda is also important because of potential economic gains associated with exports to a wider array of countries than in the past.
Edmondson, W. (2008). U.S. Agricultural Trade Boosts Overall Economy. U.S.D.A., Economic Research Service, FAU-124, pp. 11, April 2008. Available online: http://www.ers.usda.gov.
Minnesota IMPLAN Group. (2008). IMPLAN Professional 2.0 and 2008 data. Input/Output Economic Impact Analysis Software. Stillwater, Minn.
United States Census Bureau Foreign Trade Statistics. (2011). U.S. Trade in Goods (Imports, Exports and Balance) by Country. Available online: http://www.census.gov/foreign-trade/balance/index.html.
United States Department of Agriculture Foreign Agricultural Service. (2011). U.S. Global Agricultural Trade System. Available online: http://www.fas.usda.gov/gats/default.aspx.
United States Department of Agriculture Natural Resources Conservation Service. (2011). Economics, Technical Resources, IMPLAN Analysis Site. Available online: http://www.economics.nrcs.usda.gov/technical/implan/index.html.
United States Department of Agriculture National Agricultural Statistics Service. (2010). Various production data resources. Available online: http://www.nass.usda.gov.
| Year | Agricultural Revised | Nonagricultural | Total | Agricultural Proportion of Total |
| Million Dollars | Percent | |||
| U.S. Exports: | ||||
| 2000 | 51,265 | 730,653 | 781,918 | 6.6 |
| 2001 | 53,679 | 675,421 | 729,100 | 7.4 |
| 2002 | 53,143 | 639,961 | 693,104 | 7.7 |
| 2003 | 59,392 | 665,379 | 724,771 | 8.2 |
| 2004 | 61,418 | 753,457 | 814,875 | 7.5 |
| 2005 | 63,182 | 837,900 | 901,082 | 7.0 |
| 2006 | 70,949 | 955,020 | 1,025,969 | 6.9 |
| 2007 | 89,990 | 1,058,207 | 1,148,197 | 7.8 |
| 2008 | 114,760 | 1,172,682 | 1,287,442 | 8.9 |
| 2009 | 98,453 | 957,588 | 1,056,041 | 9.3 |
| 2010 | 115,809 | 1,162,330 | 1,278,139 | 9.1 |
| U.S. Imports for Consumption (customs value): | ||||
| 2000 | 38,974 | 1,179,047 | 1,218,021 | 3.2 |
| 2001 | 39,366 | 1,101,633 | 1,140,999 | 3.5 |
| 2002 | 41,915 | 1,119,451 | 1,161,366 | 3.6 |
| 2003 | 47,384 | 1,209,737 | 1,257,121 | 3.8 |
| 2004 | 53,989 | 1,415,714 | 1,469,703 | 3.7 |
| 2005 | 59,291 | 1,614,165 | 1,673,456 | 3.5 |
| 2006 | 65,326 | 1,788,613 | 1,853,939 | 3.5 |
| 2007 | 71,913 | 1,885,049 | 1,956,962 | 3.7 |
| 2008 | 80,488 | 2,023,152 | 2,103,640 | 3.8 |
| 2009 | 71,681 | 1,487,944 | 1,559,625 | 4.6 |
| 2010 | 81,856 | 1,830,185 | 1,912,071 | 4.3 |
Sources: Global Ag Trade Statistics (GATS), USDA/FAS; Foreign Trade Statistics-Trade in Goods, U.S. Census Bureau
|
Output |
Employment (Jobs) | |||
| Total | $280,511.9 | 1,555,818 | ||
| Farm | $80,731.3 | 28.8% | 742,966 | 47.8% |
| Services | $67,890.0 | 24.2% | 457,136 | 29.4% |
| Food Processing | $65,367.7 | 23.3% | 112,723 | 7.2% |
| Manufacturing | $44,124.6 | 15.7% | 70,860 | 4.6% |
| Trade & Transportation | $22,398.4 | 8.0% | 172,133 | 11.1% |
Economic impacts calculated using IMPLAN, Minnesota IMPLAN Group
| Output (Million Dollars) | Employment (Jobs) | |||
| Total | $86,055.9 | 409,792 | ||
| Farm | $34,792.0 | 40.4% | 209,650 | 51.2% |
| Services | $16,037.4 | 18.6% | 113,399 | 27.7% |
| Food Processing | $21,943.3 | 25.5% | 28,093 | 6.9% |
| Manufacturing | $7,372.9 | 8.6% | 12,416 | 3.0% |
| Trade & Transportation | $5,910.3 | 6.9% | 46,234 | 11.3% |
Economic impacts calculated using IMPLAN, Minnesota IMPLAN Group.
| Output (Million Dollars) | Employment (Jobs) | |||
| Total | $43,862.4 | 336,385 | ||
| Farm | $15,546.8 | 35.4% | 211,505 | 62.9% |
| Services | $8,891.2 | 20.3% | 64,831 | 19.3% |
| Food Processing | $11,044.6 | 25.2% | 26,901 | 8.0% |
| Manufacturing | $5,208.4 | 11.9% | 7,643 | 2.3% |
| Trade & Transportation | $3,171.3 | 7.2% | 25,501 | 7.6% |
Economic impacts calculated using IMPLAN, Minnesota IMPLAN Group.
| Output (Million Dollars) | Employment (Jobs) | |||
| Total | $38,898.3 | 245,664 | ||
| Farm | $14,014.0 | 36.0% | 138,329 | 56.3% |
| Services | $8,941.3 | 23.0% | 59,130 | 24.1% |
| Food Processing | $9,330.1 | 24.0% | 17,642 | 7.2% |
| Manufacturing | $3,426.0 | 8.8% | 6,565 | 2.7% |
| Trade & Transportation | $3,181.8 | 8.2% | 23,999 | 9.8% |
Economic impacts calculated using IMPLAN, Minnesota IMPLAN Group.
| Output (Million Dollars) | Employment (Jobs) | |||
| Total | $7,657.8 | 53,333 | ||
| Farm | $2,727.7 | 35.6% | 35,875 | 67.3% |
| Services | $1,602.7 | 20.9% | 9,460 | 17.9% |
| Food Processing | $2,108.7 | 28.5% | 3,006 | 5.6% |
| Manufacturing | $607.0 | 7.9% | 1,111 | 2.1% |
| Trade & Transportation | $539.8 | 7.0% | 3,781 | 7.1% |
Economic impacts calculated using IMPLAN, Minnesota IMPLAN Group.