
For many years, the price of food was a nonstory. Food price inflation was about the same as the general rate of inflation, and farm commodity market developments rarely drew the attention of those not directly involved in agriculture and the food industry.
That has changed. Rising commodity prices and high food price inflation here and abroad have put agricultural commodity markets in the spotlight. The media are full of stories about the causes and impacts of the commodity boom. In this context, it may be hard to imagine that there is an angle to the story that has not already been covered repeatedly. However, some very simple economics may help us to understand some of the reasons for the increase in prices and to speculate about what might happen in the future.
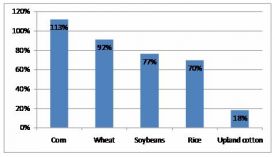
The prices of corn, wheat, soybeans, rice and many other farm commodities have increased sharply since 2006. Exactly how much prices have increased depends on the indicator. Looking at marketing year averages, the U.S. producer price of corn has more than doubled over the last two years, and prices for wheat, soybeans, rice, and many other commodities have also increased sharply (Figure 1). Comparing the lowest futures prices of 2006 to the highest futures prices of 2008 would yield even greater estimates of the increase in commodity prices.
In contrast, the decline in the value of the dollar means that farm commodity prices have not increased as much in terms of most foreign currencies as they have in dollar terms. While grain, oilseed and milk prices have increased sharply, prices for cotton, cattle, hogs and many other commodities have not. Consumer food prices have increased more than at any time since 1990 and more than the general rate of inflation in the U.S. economy. Still, current annual consumer food price inflation of about 5% is far below the rate of increase in farm commodity or energy prices.
The increase in farm commodity prices clearly cannot be ascribed to any single cause. Two of the best explanations of how we got to the current situation are provided in reports by Trostle and Schnepf. Both make it clear that the list of contributing factors is very long, and that it is difficult even to rank the factors in order of importance.
Instead of trying to identify all the causes of the current market situation, let us apply some very simple economics to isolate developments that warrant further attention. All else equal, economists normally expect higher prices to increase quantities supplied and reduce quantities demanded. If grain prices have roughly doubled over the last two years, the quantity of grain produced in the world should have increased and the quantity of grain utilized should have declined. If instead we observe reductions in production or increases in use, we can conclude there must have been some underlying shift in supply or demand that is contributing to the rise in prices.
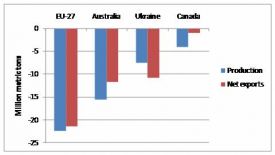
Focusing first on the supply side, consider what has happened to grain production in a number of important exporting countries over the last two years. In the European Union, Australia, Ukraine and Canada, production of wheat and other grains was actually lower in 2007 than in 2005, in spite of sharply higher market prices (Figure 2). Reduced production translated into reduced exports, thus limiting supplies in international markets.
Why would production decline in the face of higher prices? The whole story may be complex, but weather is clearly an important factor. In all four exporters, grain yields per acre in 2007 were below 2005 levels, primarily because of drought and other weather–related factors. If better growing conditions result in a return to normal yields in 2008, the increase in production could put downward pressure on prices. The prospect of increased 2008 production in these major wheat exporting countries may be one reason why July futures market prices for wheat declined from over $12 per bushel in mid–March to less than $8 per bushel just two months later.
It would be a mistake to blame poor crops for all of the increase in world grain prices. While global wheat production in 2007 was less than in 2005, world corn production increased by almost 12%, with increased production in the United States accounting for most of the change. Considering five major grains (corn, wheat, rice, barley and sorghum), total world grain production increased by an estimated 81 million tons, or 4.1%, between 2005 and 2007 (Foreign Agricultural Service 2008). That suggests world grain production actually increased in per–capita terms, which is inconsistent with a story that production shortfalls are solely to blame for the run–up in world grain prices.
The full story on the supply side is, of course, far more complicated than suggested by these simple comparisons. While world grain production increased between 2005 and 2007, world oilseed production declined slightly, in large part because of the shift in U.S. acreage away from soybeans and into corn in 2007. World grain stocks have been declining, as consumption has exceeded production in most recent years. Stocks have now dropped to levels where it is harder to satisfy demand by continuing to draw down stocks. Grain production and exports from some countries may increase in 2008, but market participants are also well aware that U.S. corn acreage appears likely to decline significantly this year, limiting future supplies.
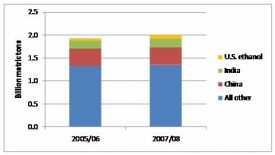
In spite of sharply higher prices, global grain consumption has actually increased by an estimated 83 million metric tons, or 4.3%, over the last two years (Figure 3). This only makes sense if there has been a significant shift in the demand for grain, as population growth alone could only explain an increase of about half that magnitude.
The data represented in Figure 3 can serve as a type of Rorschach test. Some look at the figure and note that demand has increased in a number of countries and that U.S. ethanol use of grain accounts for less than 4% of global grain consumption in 2007/08. These people tend to argue that strong economic growth in India, China and elsewhere is causing diets to change in ways that increase the demand for grain and other foods, and that growth in biofuel demand is at most a small part of the story.
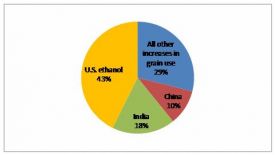
Other people prefer to focus on the changes in global grain consumption over the last two years (Figure 4). India and China continue to be an important part of the story, together accounting for about 28% of the increase in global grain consumption. However, since India and China account for an even larger share of the world’s population, that suggests per–capita grain consumption in those two countries has not increased more than it has in the world as a whole.
Instead, the spotlight shifts to the 35 million metric ton increase in U.S. use of corn to make ethanol. This accounts for 43% of the increase in global grain consumption between the 2005/06 and 2007/08 marketing years. Excluding the use of U.S. corn to make ethanol, the increase in global grain consumption is about 2.5%, just slightly more than the increase in the world’s population over the same period. In other words, world per–capita use of grain for purposes other than making ethanol is essentially unchanged from what it was two years ago.
In spite of sharply higher prices, oilseed meal and vegetable oil consumption also have increased in a wide range of countries. China is an even more important factor for oilseed meal and vegetable oil markets than it is in the case of grains. Biofuels are again an important part of the story. Industrial uses (including for biodiesel production) account for 36% of the increase in global vegetable oil consumption between the 2005/06 and 2007/08 marketing years. Unlike the case of grains, most of this increase in industrial use of vegetable oil has occurred in the European Union and other countries outside the United States.
Most would agree that food demand for grain is not very responsive to prices, but it is remarkable that even a doubling of world prices appears to have caused barely a ripple in the estimated consumption figures in most countries. Rising incomes change food consumption patterns, often in ways that make consumer purchases less responsive to the prices of basic farm commodities such as grain and vegetable oil. Policies and other factors can limit how much of any given change in world commodity prices is transmitted to food consumers. Still, it is surprising that sharply higher world commodity prices have not made at least a dent in consumption estimates.
Three additional factors affecting both the supply and the demand for food require at least a brief mention.
A paper prepared by the Food and Agriculture Organization (FAO) reviews many of the factors contributing to the current situation. News reports about the FAO’s High–Level Conference on World Food Security, held in June 2008, highlighted debates about the contribution of biofuels to the increase in global food prices (See Box).
Some of the factors that have caused farm commodity prices to increase are likely to prove transitory, suggesting prices could decline from the lofty levels of early 2008. Already, the prospect of a larger 2008 wheat crop has contributed to a significant decline in wheat futures prices. By mid–May, futures prices for rice and soybeans had also retreated somewhat from record levels, as the most severe concerns about tight supplies had at least slightly lessened.
Producers have already demonstrated a willingness and ability to adjust their crop mix quickly to exploit changes in relative returns, as seen in the shifts in U.S. corn and soybean acreage in 2007 and 2008. However, a more important question is how supplies will respond in the aggregate and in the long run. So far, the sharp increase in prices has not resulted in large increases in the total area used for crop production in the United States or in other countries, nor has there been a large increase in yields that can be attributed to improved returns. Over time, however, one would expect high prices to result in more land being used for crop production than would have been the case otherwise, and investments in new technologies that will eventually pay off in terms of higher crop yields per acre.
Some of the demand–side factors that contributed to the increase in prices appear likely to stay with us for some time to come. Unless there is a severe global recession, continued income growth in China, India and many other middle–income countries is likely to result in further dietary changes and increased demand for many commodities.
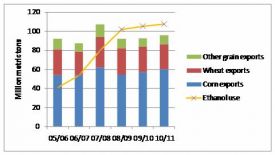
While growth in the demand for biofuels could eventually slow, a lot of biofuel production capacity has already been built or is under construction. If petroleum prices stay above $100 per barrel and supportive policies remain in place, it seems likely that most of that capacity will be used and additional capacity will be built, provided feedstock prices do not rise to levels that make biofuel production unprofitable. Even at the lower petroleum prices assumed in baseline projections prepared by the Food and Agricultural Policy Research Institute in early 2008, ethanol use of corn exceeds total U.S. exports of all grains combined in the 2008/09 marketing year (Figure 5).
The growth in biofuel production further tightens the linkages between energy and agricultural markets. If petroleum prices are high enough, petroleum and biofuel prices are likely to be closely linked—by mid–May 2008, the U.S. price of ethanol was already approximately equal to its energy value relative to gasoline, after correcting for the $0.51 per gallon tax credit then in effect.
In the long run, one would not expect biofuel producers either to make excess profits or to fail to cover operating costs. If expected biofuel profits are large, new plants will be built. This will result in increased biofuel production that will tend to increase demand for feedstocks, which in turn will result in prices for those feedstocks being bid up until the returns to biofuel production are no longer excessive. On the other hand, if plants cannot cover operating costs, they eventually will be forced to shut down.
To oversimplify somewhat, petroleum prices are likely to largely determine biofuel prices and biofuel prices are likely to largely determine prices for corn and other feedstocks in the long run. Since producers will choose which crops to plant based on relative profitability, this suggests that long–run prices for soybeans, wheat and other commodities also will be largely determined by petroleum prices.
This stylized picture does not tell the full story, of course. When they are binding, biofuel use mandates weaken or even sever the linkage between the price of petroleum and the demand for biofuels. In any given year, there is only so much capacity to produce biofuels, so biofuel demand for agricultural commodities is likely to be much less price responsive in the short run than it will be in the long run. There are many reasons why petroleum prices and grain prices will not always march in lockstep in the future.
Finally, one should not be blinded by short–run developments. Several times in the past, most recently in the mid–1990s, many people became convinced that the world had fundamentally changed and that agricultural commodity prices would be on a new higher plateau forever more. In each case the conventional wisdom was shattered shortly thereafter, and real prices for agricultural commodities resumed their long–term decline. While there are many reasons to think, “This time is different,” it’s important to remember that the same has been said before.
Food and Agriculture Organization. (2008). Soaring Food Prices: Facts, Perspectives, Impacts and Actions Required. Paper prepared for the High–Level Conference on World Food Security. Rome, FAO. Available online: http://www.fao.org/fileadmin/user_upload/foodclimate/HLCdocs
Food and Agricultural Policy Research Institute. (2008). FAPRI 2008 U.S. and World Agricultural Outlook (FAPRI Staff Report 08–FSR 1). Ames, Iowa, Iowa State University. Available online: http://www.fapri.iastate.edu/
Foreign Agricultural Service, USDA. (2008). Production, Supply and Distribution Online database. Available online: http://www.fas.usda.gov/
Lynch, C. (2008, June 2). U.N. Chief to Prod Nations on Food Crisis: Trade, Price Policies at Issue. Washington Post, p. A07. Available online: http://www.washingtonpost.com/wp–dyn/content/article/2008/06/
Schnepf, R. (2008). High Agricultural Commodity Prices: What Are the Issues? (CRS Report for Congress, Order Code RL34474). Available online: http://assets.opencrs.com/rpts/RL34474_20080506.pdf.
Trostle, R. (2008). Global Agricultural Supply and Demand: Factors Contributing to Recent Increases in Food Commodity Prices (USDA Economic Research Service Report WRS–0801). Available online: http://www.ers.usda.gov/
World Agricultural Outlook Board, USDA. (2008). World Agricultural Supply and Demand Estimates (WASDE–458 (May)). Available online: http://www.usda.gov/oce/commodity/wasde/.
The role of biofuels in the increase in food prices is hotly debated. Press reports from FAO’s conference on world food security highlighted widely different estimates. USDA Secretary Schafer was quoted as saying, “According to our analysis, the increased biofuels production accounts for only 2 to 3% of the overall increase in global food prices” (Lynch). The same news story reports that, “A World Bank analyst estimated that biofuel production has accounted for 65% in the rise of world food prices.”
Why do these and other estimates differ so greatly? In digging a little deeper, one quickly discovers that comparing the various studies is like comparing apples to rutabagas. The estimates often refer to different time periods, define “food” differently, and hold different things constant. One study may look at the last twelve months, consider a wide range of food products and separate effects caused by higher energy prices from effects caused by other factors. Another study may look at a longer time period, focus only on grain prices, and more broadly define biofuel effects. Thus, in trying to reconcile the various estimates, it is important to understand just what is being measured. It is critical to be clear about what the estimates do and do not mean in a case like this, where different parties have a very strong interest in “spinning” expert estimates to their advantage.
The author thanks Wyatt Thompson, William Meyers, Seth Meyer and Daniel Madison for helpful comments on an earlier draft.