

Farm support programs based on price have been an integral part of farm policy since the 1930s. However, two concerns have emerged with existing price–based programs. One is that the current marketing loan and counter–cyclical programs provide little protection when yields are low. Widespread reduction in yields raises prices and reduces or eliminates payments from these two programs while localized reduction in yields reduce marketing loan payments for affected individual farms because marketing loan payments are based on production. The second concern is that farmers can receive marketing loan and counter–cyclical payments even when revenue is above average because high yields more than offset low prices.
After decades of debate, a revenue assurance program finally became a reality in the new Food, Conservation and Energy Act of 2008. Specifically, farmers are offered the choice of the following program options:
Many concepts included in the ACRE state revenue program were first contained in the Integrated Farm Revenue Proposal by Carl Zulauf. American Farmland Trust was the first organization to endorse these concepts, followed by the National Corn Growers Association. Senators Richard Durbin of Illinois and Sherrod Brown of Ohio provided initial congressional support and co–authored the first bill (S.1872) containing a program that became ACRE.
This article describes the legislative provisions and policy background of the new ACRE state revenue program, as well as some analytical results that provide insights into the farmer decision regarding which suite of programs to choose.
The direct payment program pays farmers a fixed dollar amount per historical base acre. This dollar amount does not change with market prices or with production on the farm. Like direct payments, counter–cyclical payments are based on historical production. In contrast, marketing loan payments are based on current production. Both the counter–cyclical and marketing loan programs are price–based programs. Congress specifies the marketing loan rates and counter–cyclical target prices in the Farm Bill. These fixed support rates essentially establish a floor or lower bound on the per unit value of the crop, as payments are triggered when market price drops below them. The creation of a floor reflects the policy objective of traditional price support programs, which is to assist farmers with managing the systemic risk of chronically low market prices that extend over a long period of years. A systemic risk is a risk beyond the control of an individual producer. The combination of direct payment, counter–cyclical, and marketing loan programs will be referred to in this article by the acronym DCP+ML.
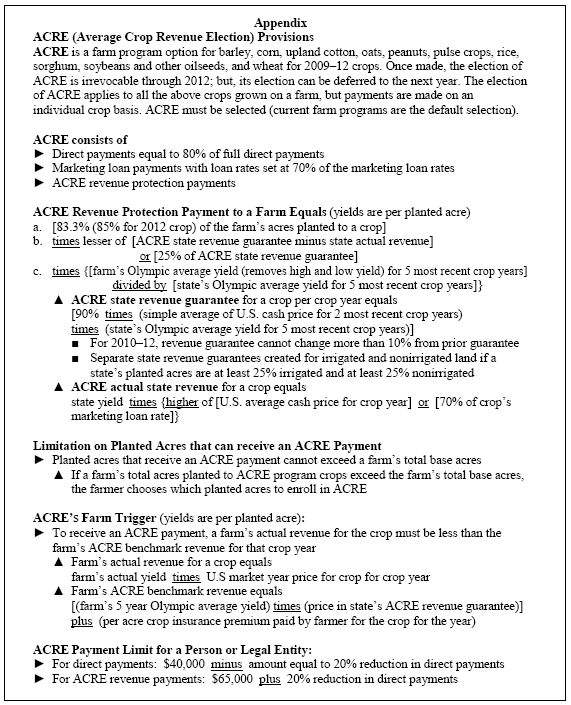
In contrast, ACRE’s policy objective is to assist farmers with managing the systemic risk of a decline in revenue of a crop over a short period of years. Revenue is defined as U.S. price times state yield. ACRE’s policy objective is implemented by establishing the following revenue guarantee for each state and crop combination (crops are barley, corn, upland cotton, oats, peanuts, pulse crops, rice, sorghum, soybeans and other oilseeds, and wheat):
(90%) x (2–year moving average of U.S. crop year cash price) x (5–year Olympic moving average [excludes high and low values] of state yield per planted acre)
A state revenue payment is triggered for a given crop and year when actual state revenue (state yield per planted acre times U.S. crop year price) is less than the state’s ACRE revenue guarantee. This difference is the state’s ACRE payment rate. For any crop in any year, the payment rate cannot exceed 25% of the crop’s state revenue guarantee.
ACRE’s state revenue guarantee cannot increase or decrease more than 10% from the prior year’s guarantee. Over time, the guarantee will follow prices and yields up and down. Thus, ACRE’s revenue guarantee is not a floor, implying that ACRE will not provide protection against chronically low prices.
Receipt of an ACRE payment also requires that a farm’s revenue for the crop and year be less than its benchmark revenue for the crop. The latter equals (1) the product of the farm’s 5–year Olympic average yield per planted acre times the 2–year U.S. average price, plus (2) the farm’s insurance premium if the farmer bought insurance for the crop.
The ACRE revenue protection payment is made on acres planted to eligible crops, but total planted acres covered by ACRE are capped at the farm’s total base acres. Total payment a farm receives from ACRE is the sum of (1) 80% of the farm’s current direct payment, (2) ACRE revenue protection payments, and (3) marketing loan payments at a 30% lower loan rate.
This discussion focuses on ACRE’s basic features. Additional details on ACRE are contained in the appendix.
The ACRE state revenue program has several important departures from DCP+ML:
A rarely–discussed hole exists in the traditional farm safety net. The combination of higher prices, higher production costs, and fixed support prices provide the foundation for farm financial stress.
History and economic theory tell us that high farm prices will decline as supply responds to incentives and expands faster than demand. But, history and economic theory do not tell us if the decline will occur in one, two, five, etc. years. Moreover, high farm prices, especially when based on strong growth in demand, increase the demand, and in turn price, for farm inputs. Because costs are increasing and support prices are fixed at levels substantially below market prices, a large price decline that lasts a year or two can lead to financial stress in the agricultural sector.
This stylized story played out when the farm boom of the 1970s became the farm crisis of the 1980s. Today, most people are aware that many crop prices have increased substantively since 2006. Fewer people are aware that the cost of farm production inputs is rising rapidly as well (see Figure 1). In fact, relative to crop prices, input prices are increasing faster today than in the 1970s. Moreover, most crop prices are well above the price support rates enacted in the 2008 Farm Bill. The similarities with the 1970s do not mean that a farm financial crisis will emerge as in the 1980s, but it does suggest that policy should not ignore this possibility.
In the 1980s crisis, we learned that providing immediate assistance is critical to minimizing financial stress. Providing immediate assistance requires an appropriate policy mechanism for identifying when revenue is low. Given its objective of addressing systemic revenue risk, ACRE’s mechanism is to calculate a revenue guarantee using moving averages of recent U.S. prices and state yields. ACRE focuses on revenue because revenue incorporates changes in costs of production, productivity, supply response, and price response over time, unlike a price–based safety net fixed at politically–determined levels. For example, if costs increase faster than production efficiency, supply will decline. Given that demand for crops responds relatively slowly to changes in price in the short–term, price and revenue should increase, resulting in an increase in ACRE’s revenue guarantee. On the other hand, if production efficiency increases faster than costs, ACRE’s revenue guarantee should decline as the resulting increase in production leads to lower prices and revenue.
In conclusion, economic theory suggests that ACRE’s support level is implicitly tied to the cost of production adjusted for gains in productivity. By following prices and yields, ACRE provides protection in situations when costs increase faster than production efficiency (such as is happening now). In contrast, ACRE’s support level will decline when productivity increases faster than costs. However, due to the use of historical moving averages and a 10% limit on year–to–year changes in its revenue guarantee, ACRE should provide farmers a somewhat longer period of time in which to adjust to declining revenue.
For farmers making a decision on participation in ACRE, a key question will be: “Does the ACRE suite of farm programs provide revenue to fill the gap in years when actual farm revenue is significantly below average farm revenue?”
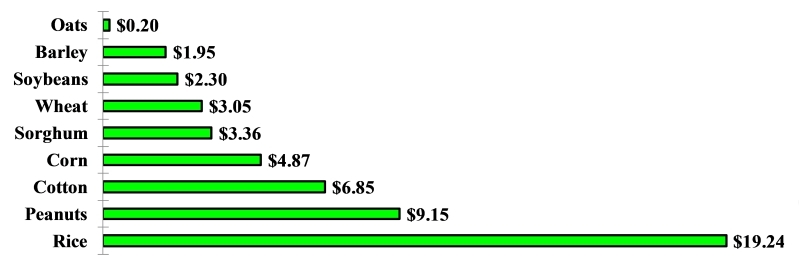
One key factor in answering this question is the 20% reduction in direct payments under ACRE. This reduction can be thought of as ACRE’s risk management fee. Using the average U.S. direct payment yield for program crops, the 20% reduction ranges from $0.20 per acre for oats to $19.24 per acre for rice (see Figure 2).
A second key factor is the timing and size of payments from ACRE. The results presented below are from an analysis of average annual payouts of the ACRE and DCP+ML programs over a 30 year historical period for corn, sorghum, soybeans and wheat in the principle and marginal production areas. The analysis uses (1) historic variability in county level yields adjusted to current levels of yield as a proxy for future yield variability and (2) the historic relationship between state yield and national price to predict the variability of future price at the U.S. Department of Agriculture average annual forecasted price for 2009–12. In essence, the results are for the representative average acres in the county.
ACRE has both a farm level and a state level revenue loss trigger. Actual farm income must be less than 100% of the farm’s benchmark revenue in order for the farm to receive an ACRE payment (see the appendix for specifics). The state trigger occurred in 5 to 15 years depending on the state and the crop, or on average in about one–third of the 30 historical observations. The county farm trigger occurred in roughly twice as many years as the state trigger. These findings are not surprising since (1) the state trigger is set at a more restrictive 90% level compared to the 100% level for the farm trigger and (2) yield is more variable at the county than at the state level. Last, in only about 10% to 20% of the observations in which the state trigger occurred did the representative county farm not trigger.
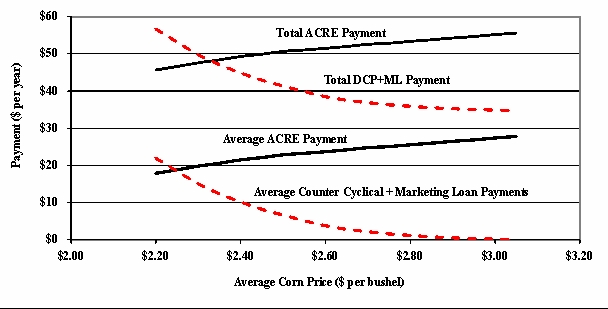
The higher the average annual price the more likely that the ACRE suite of farm programs will pay out a higher average payment than the DCP+ML suite of programs. As average annual market price increases, DCP+ML payments decline since counter–cyclical payments are tied to fixed target prices and marketing loan payments are tied to fixed loan rates. In contrast, expected revenue payments and thus total payments (80% of direct payments plus revenue payments) from ACRE increase as price increases. The reason is the associated increase in the state revenue guarantee and farm revenue benchmark. However, it is important to note that actual payments from ACRE may not equal expected payments. Actual payments depend on revenue declining for a state by at least 10%. Thus, if prices and revenue increase continuously in the future, ACRE revenue payments will be zero.
Figure 3 illustrates the importance of a producer’s expectations of future prices. It contains the expected level of ACRE and DCP+ML payments at various average prices for 2009–12 using data for Champaign County, Ill. Payments are the same for ACRE and DCP+ML at average prices between $2.30 and $2.35. The higher are a producer’s expectations of prices in the near future, the more likely is the ACRE program to generate larger income streams than the existing DCP+ML program.
Examination of the analytical results also indicate that expected payments from ACRE are larger (1) the lower is the correlation between changes in state yield and U.S. price and (2) the higher is predicted average annual (2009–12) state yield relative to the direct payment and counter–cyclical program yield. The lower is the yield–price correlation, the more likely that a decline in yield or price will trigger a revenue payment. The yield component of ACRE’s revenue guarantee is continually updated since it is based on a moving average. In contrast, the payment yield for counter–cyclical and direct payments is fixed at a historical yield level. Thus, the higher are current yields relative to historical base yields, the greater is the expected payment advantage of ACRE.
Adding the crop insurance premium to a farm’s revenue benchmark increases the revenue benchmark, and thus increases the chance of receiving a payment from ACRE. The impact of adding the insurance premium is usually minimal, although the size of this impact increases as the insurance premium increases relative to the crop’s revenue per acre.
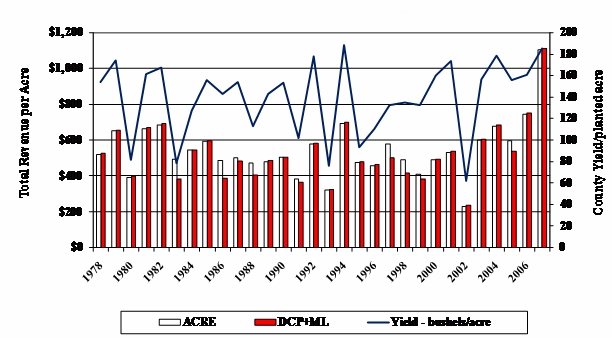
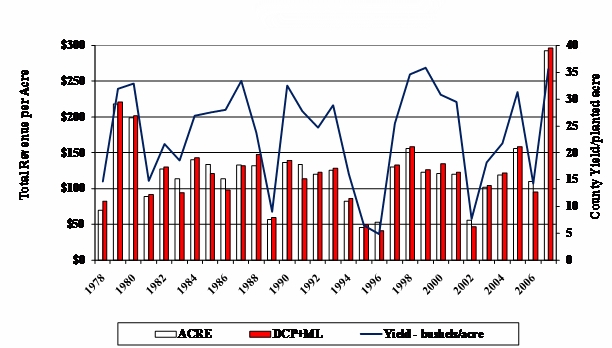
Neither ACRE nor DCP+ML are substitutes for crop insurance. For the representative county farms, the lowest revenue years occurred when their yield was low and price had not increased sufficiently to offset the low yield. This situation most often occurred when yield–reducing weather events were on a geographical scale smaller than a state. Such declines in production generally are not large enough to cause price to increase. Figures 4 and 5 illustrate this discussion for corn in De Kalb County, Ill., and wheat in Texas County, Okla., respectively. The graphs are generated assuming U.S. Department of Agriculture average predicted prices for the 2009–12 crop years: $3.60 for corn and $4.55 for wheat. County average yields also are included in the figures. Significant yield shortfalls occur in six years in De Kalb County and 7 years in Texas County. The ACRE suite of programs provides higher revenue than the DCP+ML program in only two of the six years in De Kalb County and three of the seven years in Texas County. However, neither program provides much revenue protection in most of these years because the declines in yield occurred over a small area relative to the U.S. market. These findings clearly indicate a continued need for crop insurance.
Both ACRE and traditional price support programs address a systemic risk that occurs beyond the individual farm. However, ACRE addresses a risk associated with a market at or near equilibrium while traditional price programs address a risk associated with a market out of equilibrium. Compared with the current marketing loan and counter–cyclical price programs, ACRE has several policy innovations: (1) ACRE’s target is revenue not price, (2) ACRE’s revenue guarantee is not fixed, (3) a farm level revenue loss must occur to receive an ACRE payment, and (4) ACRE is partially coordinated with crop insurance.
For most farmers, a central question will frame their decision regarding ACRE: “Over the period of participation, does ACRE improve the management of systemic revenue risk relative to current programs enough to compensate for the 20% reduction in direct payments and 30% reduction in loan rates?” Our analysis finds that at prices and yields forecast by the U.S. Department of Agriculture through the 2012 crop year, ACRE generally provides larger expected average annual total revenue and smaller variation in total revenue. The differences can be small, depending on what other assumptions are made. However, exceptions occur. For example, if prices and revenue continue to increase, the current programs will provide higher payments than ACRE because of ACRE’s 20% reduction in direct payments.
As with any analysis, assumptions are important. These assumptions involve not only prices and yields, but also how the regulations will interpret the Farm Bill’s ACRE provisions. The importance of regulations is illustrated by the current debate over whether the phrase, “the most recent crop year prices,” means the “most recent crop years for which complete information exists” or “includes the current crop year.” For the 2009 crop, this debate translates into whether ACRE’s revenue guarantee is based on U.S. average cash prices for crop years 2007 and 2008 or for crop years 2006 and 2007. To put the significance of this debate in numerical context, average U.S. cash corn price is $3.65 for 2006–07 vs. $4.83 for 2007–08, using the latest data from the U.S. Department of Agriculture. Clearly, using 2007–08 instead of 2006–07 prices makes ACRE more attractive to farmers.
This analysis and economic theory suggest ACRE is most likely to benefit the following:
Decision aids to assess participation in ACRE are being developed and various analyses of ACRE have been completed or are underway. These will provide useful information to producers and share–renting landlords as they assess their decision. They also will need to consider the role of crop insurance as they put together their risk management plan. As this analysis clearly shows, neither ACRE nor the current set of programs will cover all low revenue situations on a farm, in particular those associated with localized weather conditions.
In conclusion, like any policy, ACRE’s performance will be assessed in the real world. And, being a new policy, unintended consequences are likely. The combination of individual farmer decisions and policy experience will aid in more clearly defining policy objectives and will provide insights into the level and type of risk protection desired by producers across crops, states and regions. This information will provide vital input in future legislation. In short, ACRE will contribute to the evolutionary discussion that shapes and defines U.S. farm policy.
Dicks, Michael R. and Kim Anderson (2007). Analysis of Revenue Assurance Programs. Western Economics Forum, 6(2), 15-24.
U.S. Department of Agriculture, Economic Research Service (2008). The 2008 Farm Bill Side-By-Side Comparison. Available online: http://www.ers.usda.gov/FarmBill/2008/
U.S. Senate Committee on Agriculture, Nutrition, and Forestry (2008). Farm Bill Conference. Available online: http://agriculture.senate.gov/
Zulauf, Carl (2008). 2008 Farm Bill: With Focus on ACRE and SURE. Department of Agricultural, Environmental, and Development Economics, Ohio State University. Available online: http://aede.osu.edu/people/publications.php?user=zulauf.1
Zulauf, Carl (2007). U.S. Farm Policy at a Crossroads. Perspectives on 21st Century Agriculture: A Tribute to Walter J. Armbruster. Edited by Ronald D. Knutson, Sharron D. Knutson, and David P. Ernstes. IL: Farm Foundation. Pages 150-157.

The authors thank Allan Lines, Joe Schultz, and three anonymous reviewers for their helpful comments on the presentation and content of the paper.