Prices of corn, soybeans, and wheat started moving higher in the fall of 2006 and then surged to new record highs in the spring and summer of 2008. The main factors powering the surge included demand growth from developing nations, U.S. monetary policy, diversion of row crops to biofuel production and weather-related production shortfalls (Trostle, 2008). Prices have declined markedly in recent months from the highs reached in the spring/summer of 2008. Market specific factors, such as larger U.S. crop prospects than feared when Midwest flooding peaked in June, contributed to the sharp drop in prices, but the biggest factor by far has been demand pressure brought on by the severe problems in U.S. and global credit markets.
The volatility of crop prices has stressed both market participants and market institutions, in some cases literally beyond the breaking point. High profile examples include the bankruptcy of VeraSun, one of the largest ethanol manufacturers in the United States, and Pilgrim’s Pride, the second largest poultry processor in the United States. Several questions are prominent in this highly uncertain economic environment. Are higher prices here to stay? Will prices continue to be as volatile in the future as in recent years? What are the likely impacts on different market participants and how easily can they adapt to the ongoing structural changes?
In this article, we first analyze the history of nominal corn, soybean, and wheat prices for clues as to the likely level and variability of prices in the future. We focus specifically on 1973–1975 as the last comparable period of structural change and use the shifts observed during this period as a template for the currently emerging era. The experience of this earlier time period is combined with an assessment of current market fundamentals to generate expectations about future price behavior. We follow this analysis with a discussion of the implications for three groups of market participants.
Insight regarding the probable magnitude and volatility of prices in the future can be provided by the previous shift in nominal price levels that occurred beginning in 1973. The first period examined is January 1947 through December 1972 and the second is the period from January 1973 through November 2006. These periods were selected because each is thought to represent a structural shift in market conditions from the previous period, resulting in a higher level of nominal prices. The first period starts immediately after World War II when price controls were lifted and the postwar rebuilding effort began. The second period begins with the changes brought about by shifts in exchange rate policies, grain purchases by the former Soviet Union, and a period of escalating energy prices and more rapid inflation.
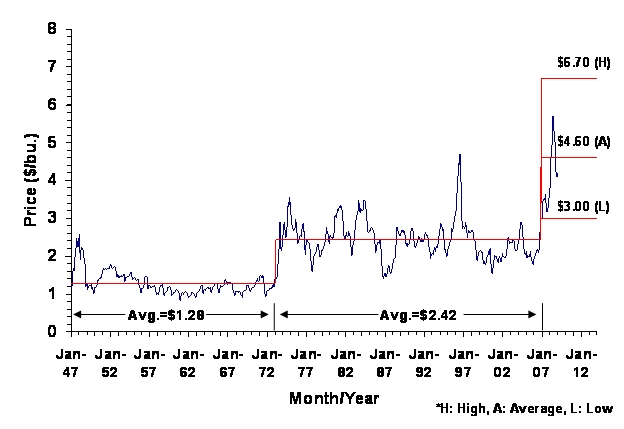
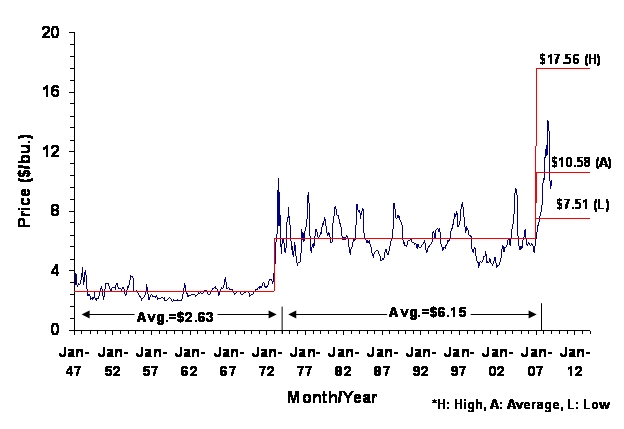
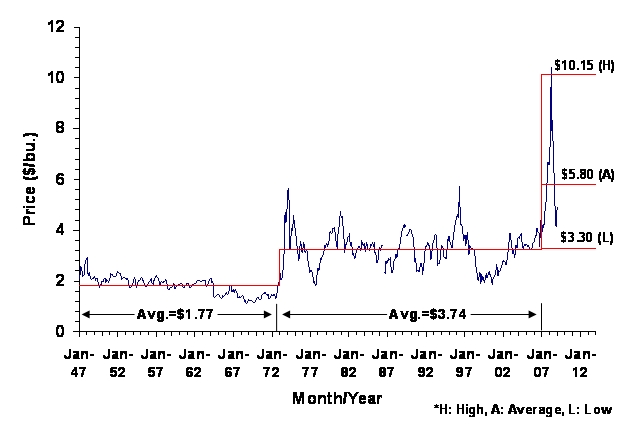
Figures 1 though 3 depict the average monthly farm price of corn, soybeans, and wheat, respectively, in Illinois from January 1947 through January 2009. These charts clearly illustrate the change in the nominal price levels that occurred in the early 1970’s and the extreme volatility in prices during the early years of both periods. The charts also present the average nominal price for each commodity in the post-World War II and post-1972 eras. Note that the post-1972 era is assumed to end in November 2006. For all three commodities, nominal price levels appear to have jumped to a new level, rather than a temporary spike, late in 2006.
As shown in Table 1, the average monthly price of corn increased by 89% from the post-World War II period to the post-1972 period. The average price of wheat increased by a similar amount, 79%. The largest increase, 134%, was for soybeans as that crop transitioned from a minor to a major crop in the United States. As a starting point, if average monthly nominal prices in the new era that appears to have begun in late 2006 increase by a similar amount to those over the post-1972 period, averages would project to about $4.60 for corn, $5.80 for wheat, and $14.40 for soybeans.
The relationship between projected corn and wheat prices appears reasonable, reflecting a wheat/corn price ratio of 1.26. That ratio is somewhat lower than in either of the two prior periods, but consistent with the trend towards a lower ratio. The projected average monthly price of soybeans is likely too high relative to the other two crops as it reflects a soybean/corn price ratio of 3.13. That ratio is well above historic relationships and above the ratio that makes the two crops competitive from a production standpoint. A ratio of 2.3 would more closely reflect differences in current production costs and would result in an average soybean price projection of $10.58.
The expectation of higher nominal prices raises the issue of the potential for a positive supply response that would exceed that needed to keep per capita crop production constant. That type of supply response was evident in the early 1970’s as the initial price increase exceeded costs of production. However, the initial supply response, along with higher production costs, resulted in a return to more typical levels of net profits to crop producers. The supply response, then, was temporary. The same scenario appears to have unfolded over the 2007 and 2008 crop years.
In addition to the average monthly price, history provides some insight into the likely nominal ranges in monthly prices during the first few years of the current price era. As indicated in Table 1, the lowest monthly price of corn in the first five years of the previous two price eras ranged from 66 to 77% of the average of the monthly prices over the entire period. The highest monthly price in the first five years ranged from 146 to 201% of the average. For soybeans, the lowest monthly price during the first five years ranged from 71 to 81% of the average of the monthly prices for the entire period, and the high ranged from 161 to 166% of the average. For wheat, the lowest monthly price ranged from 57 to 96% of the average of the entire period, and the highest monthly price ranged from 162 to 175% of the average.
The average of the percentage price ranges during the first five years of the previous two periods and an average price of $4.60 for corn, $10.58 for soybeans, and $5.80 for wheat projects to nominal ranges in average monthly prices over the first few years of the current era of $3.30 to $8.00 for corn, $8.05 to $17.30 for soybeans, and $4.45 to $9.75 for wheat. Using the percentage price ranges only during the first five years of the most recent period results in projected monthly price ranges for the current period of $3.00 to $6.70 for corn, $7.51 to $17.56 for soybeans, and $3.30 to $10.15 for wheat. The primary differences between using the most recent period rather than the average of the two are the projection of the high price of corn and the low price of wheat. We use the projections based only on the most recent period to project the likely range of prices in the future. To aid the reader, average prices and ranges projected for the future are presented both in Table 2 and Figures 1–3.
In the period from December 2006 through January 2009, the average monthly price of corn in Illinois was $4.05, in a range of $3.00 to $5.71. The average monthly price of soybeans was $9.69, in a range of $6.21 to $14.10. The average monthly price of wheat was $5.82, in a range of $3.97 to $10.40. To date, then, the average monthly price of corn and soybeans has been lower than projected for the new era. The average price of wheat has been near the projected average for the period.
The lowest average monthly price of soybeans since December 2006 is lower than the lowest price projected from performance in the first five years of the previous period. The lows were in December 2006 and January 2007, perhaps indicating the designation of the new price era should be a few months later than December 2006. The highest average monthly price of wheat projected by past performance ($10.15) was exceeded in March 2008 ($10.40). Prices have declined sharply since then. Average monthly corn prices since December 2006 have been within the projected range.
Are the average price level projections for the current era consistent with known fundamentals? The question centers on corn prices. While the methods employed here are quite simple, the average nominal price level projected for corn ($4.60) is consistent with other price projections that use sophisticated econometric models (e.g., Babcock, 2008). Compared to the futures market, which is currently projecting prices between $4.00 and $4.20 through 2011, our projection of the average corn price may be somewhat high.
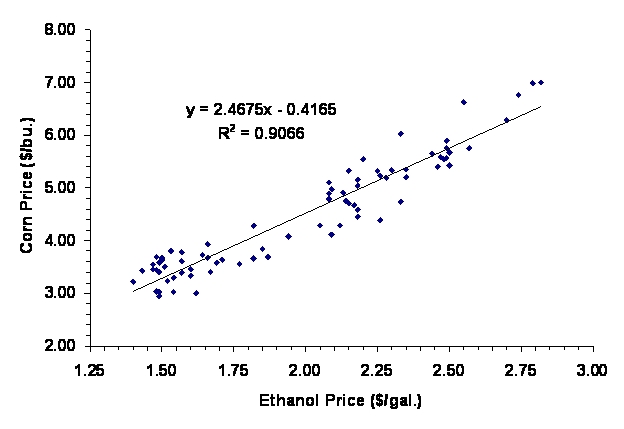
Current market fundamentals center on large amounts of corn used for ethanol production. Through last fall, ethanol production was largely driven by high crude oil prices. With the collapse of crude oil prices to $40/barrel and below, ethanol production now appears to be driven by government mandates for renewable fuels. Whether market-driven or policy-driven, the result is that corn prices and ethanol prices are closely tied together. This is demonstrated in Figure 4 which shows weekly corn and ethanol prices at Iowa ethanol plants since the start of the 2007/08 marketing year.
Not only do ethanol prices explain about 90% of the variation in corn prices, but the relationship is evident over the entire wide range of ethanol prices during the last couple of years.
At the margin, the simplest way to think about corn prices now is the value of corn to an ethanol producer (Babcock, 2009). This value is a function of the price of ethanol, which in turn is a function of the structure of biofuel subsidies and the price of gasoline. Our current biofuel policies (i.e., ethanol blending credit, import tariff, and renewable fuel mandate) appear to be sufficient to support corn prices near $4.00/bushel for the next several years. A rise in crude oil prices back to $80/barrel would also support corn prices near $4.00 (Perrin and Roberts, 2009). All else constant, the price of soybeans and wheat will have to be competitive with this level of corn prices to avoid large declines in acreage allocations.
The linkage between energy and corn prices formed so quickly that it is easy to overlook the profound nature of this change. For at least the last half-century, the fundamental value of corn was determined by its feeding value to livestock (e.g., Good, Hieronymus, and Hinton, 1980). While feeding value is still a factor in determining corn prices, it is now dominated by energy value. This means that uncertainty in energy markets and about energy policy is directly transmitted into grain markets. And this is added on top of the traditional weather and disease risks that are so familiar in these markets. The combination of new and traditional sources of risk supports the wide trading range of corn, soybean, and wheat prices shown in Figures 1–3.
The average price and the range in prices of corn, soybeans, and wheat over the next several years have important implications for producers, merchandisers, and end users of these crops. Following is a brief review of some of these implications for the three segments of the industry.
There are several important “take-home” points for producer’s struggling with the question, “What is a good price for corn, soybeans and wheat?” First, it is likely that a permanent shift has occurred in the level of corn, soybean, and wheat prices. The main point of debate is the size of the shift. Second, peak prices since December 2006 for all three commodities were well above average prices projected for the new era. This does not mean even higher prices cannot occur in the near future, but it does provide useful perspective on just how high prices did move. Third, prices can still move to “low” levels in this new era, particularly in relation to production costs, and they can stay there for considerable periods of time. For example, corn prices could easily return to the low $3 range for a period of time, soybean prices to the low $8 range, and wheat prices to the mid $3 range.
Both the level of price and the pattern of price movements have financial and decision making ramifications for producers of corn, soybeans, and wheat. The average price of these commodities will obviously be a major factor determining the level of profitability for producers and, therefore, the value of land used for the production of these commodities. The annual variation in price level, then, will influence the annual variation in profitability.
The inter-year variation in prices may also have important implications for decisions relative to pricing annual production. Prospects for large ranges in annual price movements suggest that producers may find more value in the use of futures options contracts to protect profitable price levels, but also capture higher prices should they occur. In addition, expectations for large ranges in prices may continue to limit the forward pricing opportunities offered by grain merchandisers. Such limitations emerged in 2008. Those limitations may take the form of shorter time horizons for forward contracting production and/or in weak basis levels for forward contract bids. Fewer pricing opportunities from merchandisers, then, might require producers to manage price risk directly with the use of futures and options contracts. Direct use of futures and the related risk of margin requirements have obvious cash flow and credit implications for producers. In some instances, merchandisers may continue to offer a full array of pricing alternatives, but require producers to participate in the margining of the underlying futures and options positions.
Price levels will also be important in determining producer eligibility for price support payments under provisions of current legislation. At the levels projected in the previous analysis, prices of corn, soybeans, and wheat would remain above the levels that trigger loan deficiency payments. In addition, corn and soybean prices would remain above the levels that would trigger counter cyclical payments under the traditional program ($2.35 for corn and $5.36 for soybeans). Counter cyclical payments would more likely be triggered under the new Average Crop Revenue Election (ACRE) program. Analysis of the appropriate yield and price data in Illinois, for example, from 1977 through 2007 revealed that if the ACRE program had been in place during that period, the state level revenue guarantee would have triggered counter-cyclical payments in 10 of the 31 years for corn and five of the 31 years for soybeans (Schnitkey and Paulson, 2009).
Finally, price levels will have implications for the level of revenue protection provided by crop revenue insurance, for producers’ choice of crop insurance product, and for the frequency and magnitude of crop insurance payments. Under current rules, minimum prices for crop revenue insurance products are established in February each year. The level of prices during February then should influence the selection of insurance products and the level of coverage selected for the product. Again, under current rules, prices during October or November, along with actual yields, determine the indemnity payments, if any, for the various insurance products.
The level of and magnitude of variability of crop prices have at least three important implications for merchandisers (grain dealers and elevators). First, the general level of prices will influence the amount of capital or credit that will be required of dealers to buy and inventory crops. Higher prices, then, would increase the capital requirement to own a fixed amount of inventory for a specific length of time. If capital or credit limitations emerge, dealers may chose to own smaller inventories or own inventories for a shorter period of time.
Second, the magnitude of volatility in prices within a marketing year will influence the amount of capital or credit needed to maintain margin accounts on hedged ownership. For short hedgers, futures price increases subsequent to acquiring crop ownership would require margin payments in order to maintain hedged positions. Large margin requirements that increase borrowings would increase the cost of merchandising. Inadequate capital or credit might prevent merchandisers from maintaining otherwise profitable market positions, limit contract alternatives for producers, or require producers to participate in the capitalization of futures market positions.
A third implication of volatile prices for merchandisers is the risk of nonperformance on producer contracts. Producers who contract for delivery at an agreed upon price may be more reluctant to deliver on those contracts if spot prices are much higher at the delivery period. Fortunately, instances of non-performance are rare and that would likely be the case in the future, but such risk may be higher than has traditionally been the case.
For end users of corn, soybeans, and wheat, the most important implication of the magnitude of price volatility is on the timing of purchases. This is especially the case for end users who are not able to profitably price the end product at the same time that forward contracts for crops are made. The implication is that where simultaneous pricing of crops and end products is possible, there will be a tendency to maintain a balanced position rather than speculating on prices in either the input or output market. For those who are not able to forward price output at the same times as forward contracting crops, there will be a tendency to operate in the spot market for both products, minimizing the risk of either net short or net long positions.
We believe there is compelling evidence that a new era of crop price levels and volatility has begun. There is considerable uncertainty about the new level of average nominal prices and we do not have a better crystal ball than anyone else. We are more confident that the recent wide trading range of corn, soybean, and wheat prices is here to stay. Market participants and market institutions have been greatly stressed in many cases by the large swings in prices. It is important to keep in mind that we have been here before. The changes in crop markets during the mid-1970s are comparable to those we are experiencing today. Like then, we anticipate that market participants will adjust to the new pricing environment with surprising speed.
Babcock, B.A. (2008). When will the bubble burst?” Iowa Ag Review, 14(1), 1–3. Available online: http://www.card.iastate.edu/iowa_ag_review/winter_08/IAR.pdf.
Babcock, B.A. (2009). Renewable identification numbers and the renewable fuels standard: How they support corn and soybean prices.” Iowa Ag Review, 5(1), 7–9. Available online: http://www.card.iastate.edu/iowa_ag_review/winter_09/IAR.pdf.
Good, D.L., T.A. Hieronymus, and R.A. Hinton. (1980). Price forecasting and sales management: Corn, soybeans, cattle, and hogs. Urbana, IL: Cooperative Extension Service. Available online: http://www.farmdoc.uiuc.edu/irwin/links_archive_book1.asp.
Perrin, D., and J. Roberts. (2009). Is corn ethanol economically viable in the long run? Cornhusker Economics, University of Nebraska-Lincoln Extension. Available online: http://www.agecon.unl.edu/Cornhuskereconomics/2009cornhusker/2–11–09.pdf.
Schnitkey, Gary D., and Nick D. Paulson. (2009). Historical evaluation of ACRE. Department of Agricultural and Consumer Economics, University of Illinois at Urbana-Champaign.
Trostle, R. (2008). Global agricultural supply and demand: Factors contributing to the recent increase in food commodity prices.” Outlook report No. WRS–0801, Economic Research Service, U.S. Department of Agriculture. Available online: http://www.ers.usda.gov/Publications/WRS0801/WRS0801.pdf.
| Jan. 1947 – Dec. 1972 | Jan. 1973 – Nov. 2006 | % Increase | |||
| CORN | $ per bushel | ||||
|
Average Monthly Price
|
1.28 | 2.42 | 89 | ||
|
Highest Monthly Price in First 5 Years
|
2.57 | (2.01) | 3.54 | (1.46) | N/A |
|
Lowest Monthly Price in First 5 Years
|
0.99 | (0.77) | 1.60 | (0.66) | N/A |
| SOYBEANS | |||||
|
Average Monthly Price
|
2.63 | 6.15 | 134 | ||
|
Highest Monthly Price in First 5 Years
|
4.24 | (1.61) | 10.20 | (1.66) | N/A |
|
Lowest Monthly Price in First 5 Years
|
2.14 |
(0.81) | 4.35 | (0.71) | N/A |
| WHEAT | |||||
|
Average Monthly Price
|
1.81 | 3.24 | 79 | ||
|
Highest Monthly Price in First 5 Years
|
2.94 | (1.62) | 5.66 | (1.75) | N/A |
|
Lowest Monthly Price in First 5 Years
|
1.74 | (0.96) | 1.84 | (0.57) | N/A |
| Wheat/Corn Price Ratio | 1.41 | 1.34 | |||
| Soybean/Corn Ratio | 2.05 | 2.54 | |||
Note: Number in parentheses is the ratio of the high or low price in the first 5 years of the period to the average price for the entire period. N/A denotes 'not applicable.'
| Corn | Soybeans | Wheat | |
| $ per bushel | |||
| Average Monthly Price | 4.60 | 10.58 | 5.80 |
| Highest Monthly Price | 6.70 | 17.56 | 10.15 |
| Lowest Monthly Price | 3.00 | 7.51 | 3.30 |