

In 2008,The USDA’s National School Lunch Program (NSLP) and School Breakfast Program (SBP) fed almost 31 million children each school day. On a typical school day, lunch participants obtain more than one-third (35%) of their daily caloric intake at school; for children participating in both breakfast and lunch, the contribution of school food to caloric intake rises to almost one-half (47%) (Story, 2009). The programs promote the food security of low-income households with children by providing meals to those children at free or reduced price. In addition, the programs strive to improve the diets and health of all participating children.
When school meal programs began (see timeline, Table 1), their focus was on ensuring that all children had something to eat for lunch. Today, overweight and obesity have become the most common nutrition problems among American children. Children are described as “overweight but undernourished” as they consume diets high in saturated fat, added sugars, and sodium, but low in fruits, vegetables, whole grains, and lowfat milk. Public concern has risen concerning the quality of foods available to schoolchildren and whether USDA school meal programs contribute to the growing problem of childhood obesity. In response, there is a desire to update and strengthen nutritional requirements for USDA-funded school meals and regulate the nutritional content of other foods and beverages sold at school—often referred to as “competitive foods.”
At the same time, the economic downturn has brought renewed emphasis on the role of the programs as a nutrition safety net for children, with advocates proposing changes to make more children eligible for free meals. However, there is an important issue related to this. School meal providers find it challenging to cover program costs and encourage student participation while improving the quality of meals served to children. Here, drawing primarily on a review by Ralston et al. (2008), we briefly discuss the history of the national school meal programs, current evidence of their association with children’s diet and health, and proposed changes in the programs to meet the changing nutrition problems facing American children.
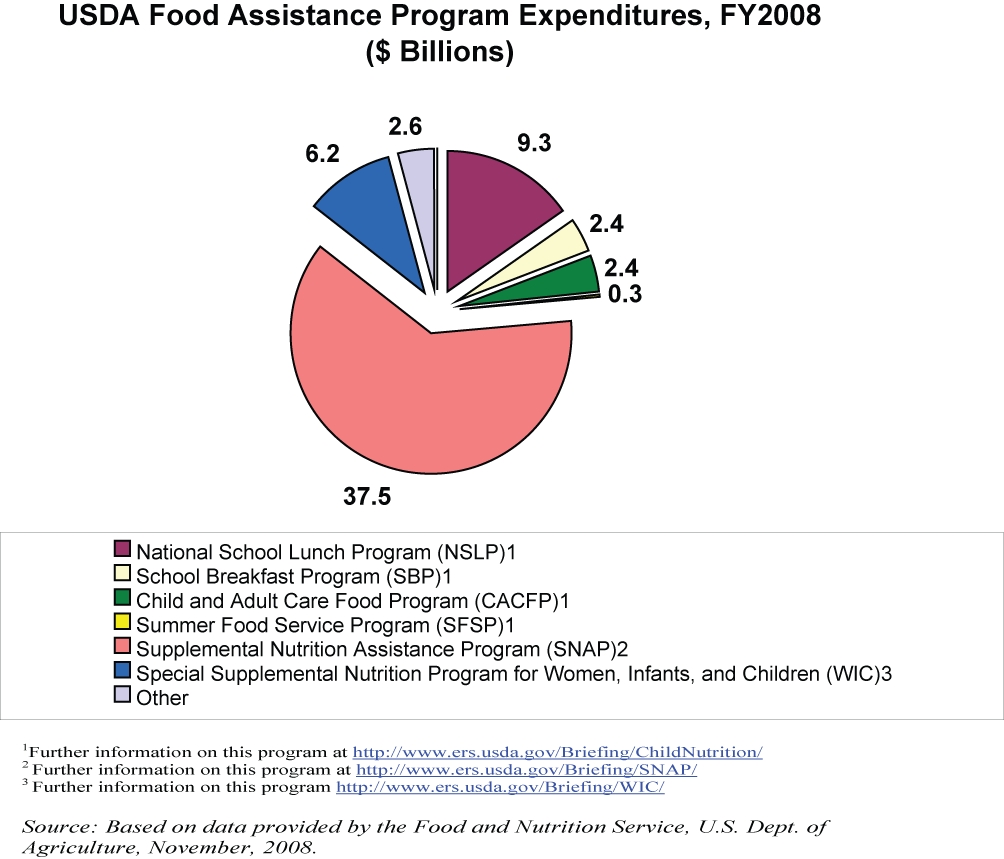
The NSLP was founded in 1946, building on smaller, localized efforts to provide school meals to needy children. Over time, federal involvement in providing meals to children and youth expanded, with the creation of the School Breakfast Program, the Child and Adult Care Food Program, and the Summer Food Service Program (see Table 1). In 2008, combined Federal spending for these programs reached $14.4 billion, second in terms of expenditures only to the Supplemental Nutrition Assistance Program or SNAP, (formerly known as the Food Stamp Program) (see Figure 1).
USDA’s Food and Nutrition Service (FNS) administers the child nutrition programs and reimburses participating schools’ foodservice departments for the meals served to students. Schools must provide meals for free or at a reduced price to children eligible on the basis of household income and USDA reimburses those meals at a higher level. Children from families with incomes at or below 130% of the poverty level are eligible for free meals. Those with incomes between 130% and 185% of the poverty level are eligible for reduced-priced meals. Students in the reduced-price category pay no more than $0.40 for lunch and $0.30 for breakfast.
USDA reimbursement rates are adjusted annually for inflation, using the Consumer Price Index (CPI) for Food Away from Home for Urban Consumers. Table 2 shows reimbursement rates for school year 2009-10. For both lunch and breakfast there is a standard rate and a higher rate provided to schools with higher proportions of needy students. Because the SBP targets low-income districts, the severe-need reimbursement is common; in school year 2005-06, 89% of all free breakfasts served were reimbursed at the severe-need rate (USDA, 2008). The use of the CPI for food away from home for the annual rate adjustment is somewhat controversial; it has been argued that it may not reflect increases in labor costs for schools, because their employees are more likely to receive benefits than are workers in other food-away-from-home outlets.
Besides cash reimbursement, USDA also provides commodities to states for use in school lunch but not for school breakfast. In FY 2007, the commodities given to schools were worth 17 cents per meal for a total of $1.04 billion. States select from a wide variety of foods, based on local preference. In addition to the basic “entitlement” commodities, “bonus” commodities are sometimes available through USDA’s price support and surplus removal programs.
Critics of the NSLP have charged that commodities tend to be high-fat meats and cheeses, undercutting efforts to reduce the fat content of school meals. During the 1990s, USDA increased efforts to provide lower fat meat, poultry, and cheese products as commodities. There have been recent federal efforts to use farm bill provisions as a means of making fruits and vegetables more available to schools. The 2002 Farm Bill directed that USDA spend $200 million of entitlement funds for fruits and vegetables from 2002 through 2007, and the 2008 Farm Bill increased that amount to $406 million by 2012.
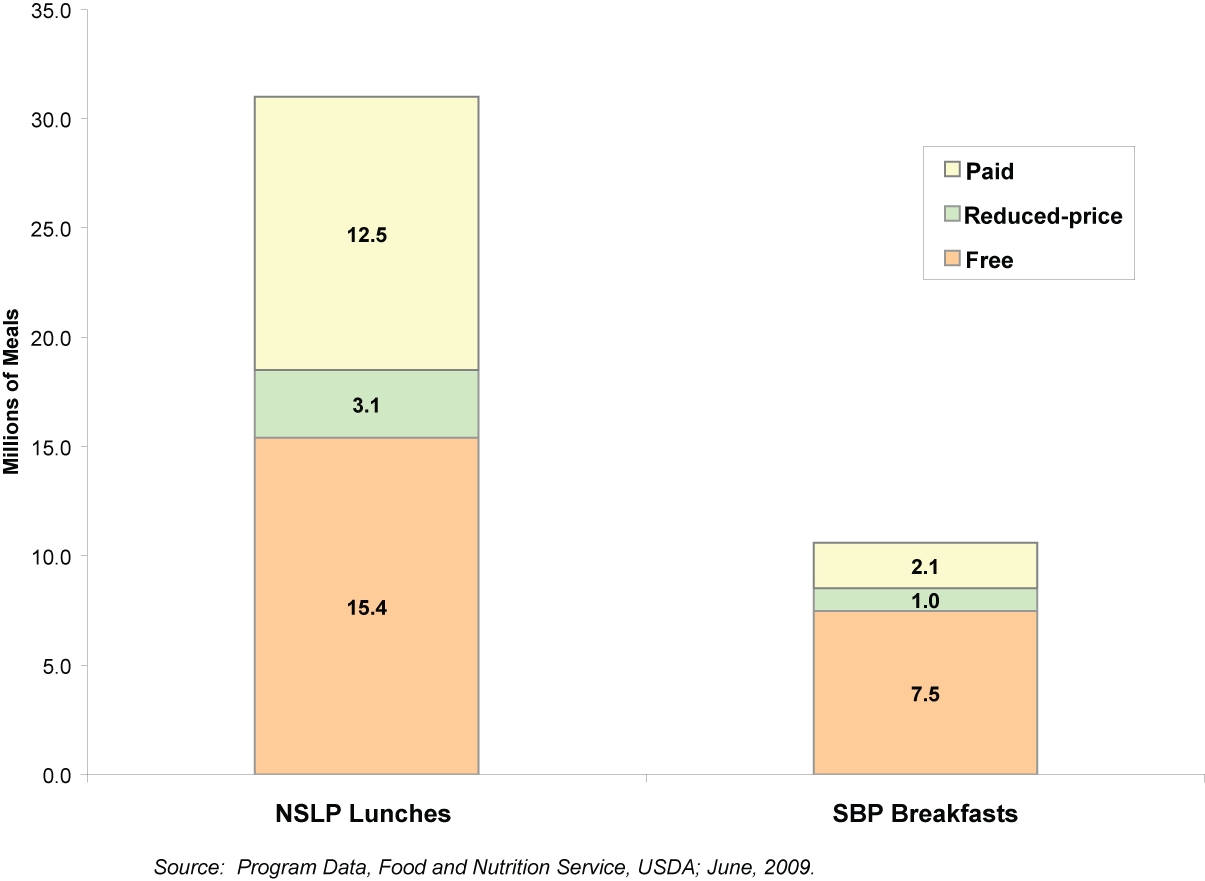
In 2008, the USDA School Meal Programs served 30.9 million lunches and 10.6 million breakfasts on an average school day, more than half of them for free or at a reduced price (see Figure 2). In terms of participation, these programs reached more Americans that year than any other food assistance program. SNAP (formerly known as the Food Stamp Program) reached a smaller number of individuals in 2008—in that year, 28.4 million people lived in households receiving SNAP benefits. However, SNAP’s higher benefit levels make it the largest USDA food assistance program in terms of expenditures.
Student participation in the NSLP has increased over most of the life of the program, with 62% of American school children participating in the program in 2008. There was a drop in participation in the early 1980s when the Omnibus Budget Reconciliation Act of 1980 and 1981 reduced the reimbursement rates for full and reduced-price lunches, and raised the household income limit for eligibility for free lunches. Since 1990, the increase in participation among children receiving free and reduced-price lunches has outstripped that of full-price participants, with the program now serving more free and reduced-price meals than full-price meals.
In contrast, the SBP has always served primarily low-income students. The program began with a very targeted focus on needy schools. The number of schools participating in the SBP has grown dramatically, with the program now offered in the majority of schools. In 2008, 81,517 schools participated in the SBP, up from 79,915 in 2007. In comparison, the NSLP operated in 96,038 schools in 2008. Student breakfast participation also has grown considerably. In fiscal 2008, 10.6 million students participated in the program daily, 3.2% more than the previous year. Nevertheless, participation continues to be much lower than for lunch and to be concentrated among low-income students who also participate in the lunch program.
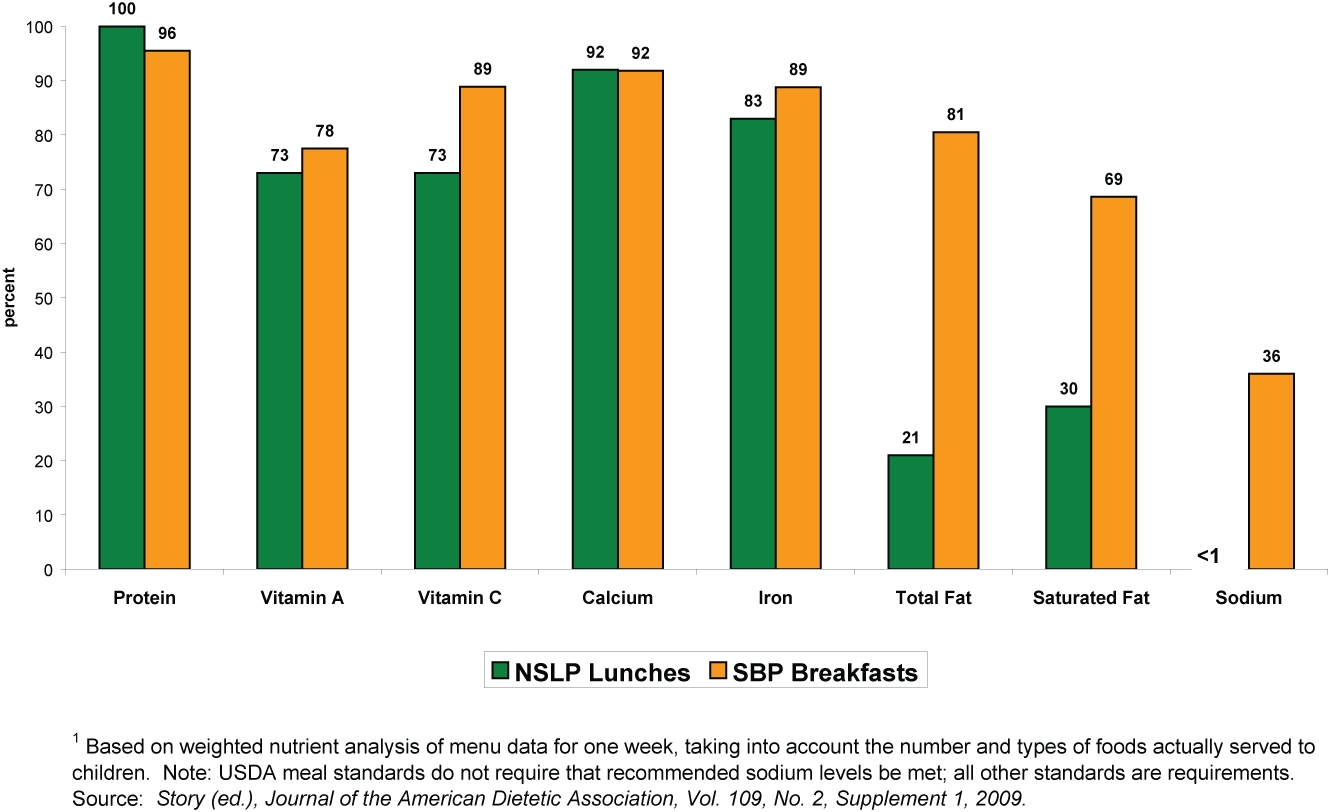
Program regulations require that schools serve lunches that meet one-third and breakfasts that meet one-quarter of the 1989 Recommended Dietary Allowance (RDA) of protein, calcium, iron, and vitamins A and C. No more than 30% of the meal’s calories can come from fat, and no more than 10% can come from saturated fat. Schools are also encouraged to minimize sodium but are not held to a specific standard. Findings from the third School Nutrition Dietary Assessment (SNDA-III), conducted in the 2004-05 school year, indicate that most schools serve lunches and breakfasts that meet nutrition standards for protein, vitamins, and minerals, but many fewer meet standards for total fat and saturated fat (Story, 2009). This is especially true for lunch; schools are more successful in meeting fat and saturated fat standards for breakfast (see Figure 3). The sodium content of meals is also high, compared to the federal Dietary Guidelines for Americans.
School meals are higher in total fat, saturated fat, and sodium than is recommended—but so are the diets of most Americans. Analyses of the SNDA-III data (Story, 2009) found that the majority of American school children need to lower their intakes of these nutrients. Participation in the NSLP did not have a statistically significant effect on total or saturated fat intake, but it was associated with higher sodium intake. Lunch entrees, many of them commercially prepared items such as pizzas, chicken nuggets, or burritos, were leading sources of fat and sodium, suggesting a need for improved food products to be made available for school food service.
School meal participation was associated with some positive nutrition outcomes (Story, 2009). Very few children suffered from inadequate vitamin and mineral intakes, but school meal participation appeared to further reduce the likelihood of inadequacy. School lunch participants were significantly more likely to drink milk and to eat fruit and vegetables at lunchtime and less likely to eat desserts and snack items. Their intakes of sugary beverages at lunch were sufficiently lower at lunch to result in a lower overall daily intake. Milk is served with USDA school meals, but sugar sweetened beverages are often sold at school in competition with the USDA meal, from vending machines and other sources. In 2004-2005, these competitive foods were available in 73% of elementary schools, 97% of middle schools, and 100% of high schools (Story, 2009). Children who did not participate in the NSLP were more likely to consume competitive foods. Whole grains and orange/dark-green vegetables, two types of foods stressed by current Federal Dietary Guidelines, were very rarely consumed by either participants or nonparticipants.
Originally designed to prevent undernutrition, it has been argued that school meal programs may now be contributing to overconsumption and obesity among American children. The program may encourage overeating by making food more available and inexpensive to children, especially those children receiving meals free or at a reduced price, or by offering meals high in fat and calories.
Ralston et al. (2008) found that while the available research evidence is not conclusive, there is little evidence that school lunch participation promotes obesity. Several studies that made simple comparisons of the weight status of NSLP participants and nonparticipants have found NSLP participants more likely to be overweight. However, in most studies that attempted to account for characteristics associated with likelihood of participating in the NSLP, such as income, age, gender, and ethnicity, those differences disappeared and NSLP participants were no more likely to be overweight than nonparticipants. This is true for a study using SNDA-III, the most recent data on USDA school meal programs. However, there is one contradictory study that found an obesity-promoting effect among nonpoor first graders, using data from a large, national, longitudinal data set.
Participation in the SBP may actually reduce obesity risk (Story, 2009). Analysis of SNDA-III data identified a relationship between participating in SBP and a lower Body Mass Index (BMI), a measure of weight status. Program participation appeared to increase the likelihood of eating breakfast, and of having a more substantial breakfast. Through these means, participation is associated with spreading calories more evenly over the course of the day; an eating pattern that appears to help maintain a healthy body weight. Another study, using a national, longitudinal sample of elementary-school students, also found the SBP to possibly have a protective effect against obesity. However, other studies have found no effect.
Given these conflicting findings, more research on program effects is warranted. It may be that the programs’ effects differ across subgroups. Or they may differ across schools, given different menus and other aspects of implementation.
Food security is defined as a condition in which a household, for economic or social reasons, has limited or uncertain access to adequate food. In 2007, 12.4 million children lived in households that were food insecure at some time during the year (Nord, Andrews, and Carlson, 2008). Access to school meal programs may help shield children from the effects of a limited household food supply. In addition, other household members may indirectly benefit if school meals add to the household’s overall food resources.
The probability of children from lower-income families participating in the SBP has been found to rise when local food prices increase (Datar and Nicosia, 2009). SBP availability has been linked to a lower probability of anxiety over possible food shortages among families at risk for food security. Still, analysis of a national sample of elementary-aged students found that 38% of children from food insecure households did not participate in the SBP (Bartfeld et al., 2009).
In summer, school meals are available to some children attending summer school. In addition, USDA’s Summer Food Service Program (SFSP) provides meals to children living in low-income areas. These efforts provide limited coverage: Nord and Romig (2006) found a higher prevalence of food insecurity in the summer, particularly for households with school-age children. Higher state levels of summertime participation in the NSLP and SFSP were associated with lower likelihood of food insecurity.
Summarizing, there is no clear evidence that USDA school meals are major contributors to childhood obesity. In fact, school breakfast may reduce obesity risk for many children. School meals also are associated with reduced risk of inadequate intakes of some vitamins and minerals, and reduced consumption of sugar-sweetened beverages, the major source of added sugar calories for most American children. The child nutrition programs, especially the SBP, also may promote the food security of low-income households with children. Nevertheless, given the important role they play in the everyday diets of millions of school children, it is reasonable to examine how school meals can do more to improve nutrition and reduce the high prevalence of overweight among American children.
Given the mixed record of school meals in meeting Dietary Guidelines, the Food and Nutrition Service of USDA has commissioned the Institute of Medicine (IOM) to review and update nutrition standards and meal requirements for the NSLP and SBP. The committee is expected to provide its recommendations for the NSLP and SBP in October 2009.
This will present a new challenge to school food authorities as they strive to meet food security, nutrition, and obesity prevention objectives. To succeed, meals planned according to these new standards must be appealing, so that students will continue to participate and to eat the healthier foods provided. At the same time, meals must be affordable for school food authorities to prepare and serve. Balancing nutrition, participation, and cost is the “trilemma” that must be solved by successful school food authorities.
The IOM committee has noted that the school meal programs operate in a challenging economic environment, with many school foodservice representatives stating that costs are a barrier to meal improvement. The USDA-sponsored School Lunch and Breakfast Cost Study II (SLBCS-II) (USDA, 2008) found that in school year 2005-06, most schools were able to serve NSLP lunches for a reported cost that was below the free price reimbursement rate. However, when unreported costs which vary across schools but often include such items as administrative labor, equipment depreciation, and utility costs were added, these “full costs” exceeded the free price reimbursement rate in 68% of School Food Authorities (SFAs). The study concluded that breakfast costs generally exceeded reimbursements. When reported costs of breakfast were considered, the applicable reimbursement rate was exceeded in 64% of SFAs; when the full cost of breakfast was calculated, 82% of SFAs exceeded the reimbursement. One problem may be the lower participation rate for breakfast; smaller case studies have found that breakfast programs must achieve some minimum participation level to cover food and labor costs. Once this is achieved, the relatively lower food and labor costs for breakfast can make it more financially viable (Hilleren, 2007).
The SLBCS-II findings, along with concern that improving the nutritional quality of school meals will result in higher costs, have led some interest groups to press for increased meal reimbursements. In addition, it has been argued that funding for such capital improvements as modernized equipment is needed. As part of the American Recovery and Reinvestment Act of 2009, USDA obtained $100 million in equipment grants to improve the quality and safety of school meals, expand participation, and increase energy efficiency.
Policy changes intended to improve child nutrition may decrease school revenue opportunities, further exacerbating school foodservice concerns about cost. In past years, many schools have sought to increase revenue by selling additional foods and beverages outside the USDA school meals. Because these “competitive foods” are generally low in nutrients and high in added sugars or fats, child health advocates have called for the removal or limitations on the sale of such foods. The Child Nutrition Reauthorization Act of 2004 required school food authorities that participated in the USDA school meal programs to establish wellness committees that would set local policies on foods sold in school. Many localities responded by limiting competitive foods and 27 states have set nutrition requirements for competitive foods sold in schools. The accompanying article in this theme by Just and Wansink provides some interesting insights for consideration.
In 2009, the Child Nutrition Promotion and School Lunch Protection Act of 2009 was introduced in both the Senate and the House of Representatives. This bill would amend the Child Nutrition Act to require the Secretary of Agriculture to establish science-based nutrition standards for all foods served in schools, not just USDA school meals.
Along with concerns for improving school foods, there are proposals to expand program benefits to needy children. Some advocates urge that the reduced-price category be dropped and free meal benefits be extended to children in households earning up to 185% of the Federal poverty level. A recent study estimated that this would result in a 13% increase in the likelihood of participating in the NSLP among students currently eligible for reduced-price meals (Moore, Hulsey, and Ponza, 2009).
Advocates have also argued for further expanding the availability of breakfast to ensure access for more low-income students. Low breakfast participation rates could make this economically difficult for some schools as participation rates may be too low to cover minimum costs.
Other proposals include expansion of program benefits to provide coverage when school is not is session. For example, legislation has been introduced that would expand Child Nutrition Program benefits to allow provision of evening meals to children in low-income areas who are attending after-school programs (currently after-school snacks can be provided to such programs through Child Nutrition Programs). Proponents argue that this expansion will provide support for at-risk children of parents working long or non-standard hours.
With reauthorization of Child Nutrition Programs now scheduled for 2010, many changes in the school meal programs are under consideration. Child obesity levels remain high, but an economic downturn has given renewed emphasis to the programs’ role in assuring the food security of needy children. While improving nutrition and increasing program access are more important than ever, in a time of budgetary constraint evidence of the effectiveness and efficiency of program changes will be demanded by policymakers. The ERS food assistance and nutrition research program conducts, supports, and disseminates research on the child nutrition programs that may be useful to program administrators and policymakers. In addition, a number of other agricultural economists can play an important role in providing decision makers with the timely, policy-oriented research they need.
Bartfeld, J., Kim, M., Ryu, J., and Ahn, H.-M. (2009). The school breakfast program: Participation and impacts. CCR-54, U.S. Dept. of Agriculture, Economic Research Service.
Datar, A. and Nicosia, N. (2009). Food prices and transitions in school meal participation during elementary school. WR-669, RAND Health.
Hilleren, H. (2007). School Breakfast Program Cost/Benefit Analysis: Achieving a Profitable SBP. University of Wisconsin-Extension, Family Living Program.
Moore, Q., Hulsey, L., and Ponza, M. (2009). Factors associated with school meal participation and the relationship between different participation measures. CCR-53, U.S. Dept. of Agriculture, Economic Research Service.
Nord, M., Andrews, M. and Carlson, S. (2008). Household food security in the United States, 2007. ERR-66, U.S. Dept. of Agriculture, Economic Research Service.
Nord, M., and Romig, K. (2006). Hunger in the summer: Seasonal food insecurity and the National School Lunch and Summer Food Service Programs,” Journal of Children and Poverty 12(2), 141-58.
Ralston, K., Newman, C., Clauson, A., Guthrie, J., and Buzby, J. (2008). The National School Lunch Program: Background, trends, and issues, ERR-61, U.S. Dept. of Agriculture, Economic Research Service.
Story, M. (Editor). (2009). The school food environment, children’s diets and obesity: findings from the Third School Nutrition Dietary Assessment Study. Journal of the American Dietetic Association, 109(2), Supplement 1.
U.S. Department of Agriculture, Food and Nutrition Service. (2008). School Lunch and Breakfast Cost Study-II, Executive summary, by S. Bartlett, F. Glantz, and C. Logan. Project Officers: P. McKinney and J.R. Endahl.
| 1900s | Private charities and local school boards provide funding for school lunches in some locations in response to concern over learning abilities of malnourished students. |
| 1932 | Locally organized school lunch programs receive Federal loans and agricultural surpluses. |
| 1935 | The Works Progress Administration (WPA) provides labor to schools for cooking and serving lunches. |
| 1936 | USDA becomes authorized to purchase surplus farm commodities and distribute them to local school lunch programs. |
| 1946 |
The National School Lunch Act (NSLA) establishes the NSLP, which includes the following requirements:
|
| 1962 | NSLA is amended to change funding from grant aid to States to a guaranteed meal reimbursement, and additional funding is provided to schools with high percentages of low-income children. |
| 1966 | Child Nutrition Act (CNA) is signed into law. The act funds 2-year pilot school breakfast program. |
| 1968 | CNA is amended to extend program authority for the School Breakfast Program to 1971; amendment also creates the Summer Food Service Program and the Child and Adult Care Food Program. |
| 1975 | CNA amendment makes the School Breakfast Program permanent. |
| 1980 | First Dietary Guidelines for Americans published. |
| 1980-81 |
Omnibus Budget Reconciliation Acts of 1980 and 1981 are enacted. The acts:
|
| 1983 | Restriction on sales of foods of minimal nutritional value is relaxed; sales are prohibited only in foodservice areas during meal times, rather than all through the schoolday, throughout the school. |
| 1993 | Results from the 1991-92 School Nutrition Dietary Assessment (SNDA-I) find that school meals generally meet the nutritional needs of children but school lunches exceed the dietary guidelines for fat and saturated fat as a percent of calories. |
| 1994 |
Healthy Meals for Healthy Americans Act requires school lunches to conform to the Dietary Guidelines by 1996 and requires that commodities account for at least 12 percent of total assistance USDA launches the School Meals Initiative for Healthy Children to implement changes in meal requirement regulations and support improvements in the nutritional content of school lunches through technical assistance, nutritional improvement in commodity donations, and an alternative nutrient-based meal planning system. |
| 2001 | Results from the 1998-99 School Nutrition Dietary Assessment (SNDA II) find that the average fat content of school lunches has fallen from 39 percent to 35 percent of calories but still exceed the 2000 Dietary Guidelines. |
| 2002 |
Nutrition Title of 2002 Farm Act (Farm Bill) provides $6 million for the Fruit and Vegetable Pilot ProgTablram to provide free fresh and dried fruits and fresh vegetables to designated schools in four States and one Indian Tribal Organization. Fifty million dollars is allocated for fresh produce for school meals through the Department of Defense. |
| 2004 |
The Child Nutrition and WIC Reauthorization Act of 2004 is enacted. The act:
|
| 2005 |
Release of 2005 Dietary Guidelines for Americans has implications for school meal requirements. New guidelines recommend different calorie limits for different levels of activity; recommend fat intake between 25 and 35 percent of calories, rather than below 30 percent; and encourage a shift from refined to whole grains. Agriculture, Rural Development, Food and Drug Administration and Related Agencies Appropriations Act of 2006 further expands the Fresh Fruit and Vegetable Program to a total of 375 schools in 14 States and 3 Indian Tribal Organizations. |
| 2008 |
The Food, Conservation, and Energy Act of 2008 (Farm Bill):
|
| 2009 | The American Recovery and Reinvestment Act of 2009 provides $100 million in equipment grants to improve the quality and safety of school meals, expand participation, and increase energy efficiency. |
Source: Adapted from Ralston et al., The National School Lunch Program Background, Trends, and Issues, 2008.
| Breakfast Rate | Lunch Rate | |||
| Reimbursement Category | Standard | Severe Need1 | Standard | Higher Need2 |
| Free | $1.46 | $1.74 | $2.68 | $2.70 |
| Reduced Price | $1.16 | $1.44 | $2.28 | $2.30 |
| Full Price | $0.26 | $0.26 | $0.25 | $0.27 |
1districts serving at least 40% of breakfasts at free or reduced-price
2districts serving at least 60% free/reduced price meals
*In addition to these needs-based adjustments in reimbursement rates, there are higher meal reimbursement rates for Alaska and Hawaii.
The views expressed in this article are those of the authors and may not be attributed to the Economic Research Service or the U.S. Department of Agriculture.