

The economic performance of China’s agricultural economy in the decades ahead will increasingly rely on the growth of total factor productivity rather than the growth of input use. Total factor productivity, or TFP for short, is positive when one of the following conditions holds: if output increases while inputs stay constant; if inputs fall while output remains the same; or a combination of both the prior conditions. However, the substantial structural changes in production agriculture and the institutions that serve it make it difficult to gauge the nature and sources of productivity growth in Chinese agriculture. Agricultural research spending at times has remained stagnant. At other times the government has invested large amounts of funds into agricultural R&D. Policies to encourage the importation of foreign technologies have been applied unevenly. Structural adjustment policies also triggered wrenching changes in the sector. Horticulture and livestock production has boomed; while the output of other crops, such as rice, wheat and soybeans, has stagnated or fallen. At a time when China’s millions of producers are faced with complex decisions, the public extension system is crumbling and farmer professional associations remain in their infancy. In short, there are almost as many reasons to be pessimistic as optimistic about the country’s productivity trends in agriculture.
Somewhat surprisingly perhaps, little effort has been devoted to assessing the productivity performance of Chinese agriculture—especially in the past decade. We describe the productivity trends in the nation’s agricultural sector during the reform era that began in the 1980s, with an emphasis on the period 1995-2005. Because our analysis examines TFP growth on a crop by crop basis, we focus primarily on technical efficiency and are not able to assess changes to allocative efficiencies, or those efficiencies that would arise by adjusting crop structure or crop mixes.
The pace of TFP growth is influenced by investments in agricultural research and extension and other factors. Moreover, changes in technologies can have differential impacts on the rate of measured productivity over time.
After the 1960s, China’s research institutions grew rapidly, from almost nothing in the 1950s, to a system that now produces a steady flow of new varieties and other technologies. Yields of Chinese-bred rice, wheat and maize varieties were comparable to the yields that were being produced by varieties in some of the most productive agricultural economies in the world (Stone 1988). After the economic reforms in the late 1970s and early 1980s, a nationwide reform in research was launched in the mid-1980s (Rozelle, Pray, and Huang 1997). The reforms attempted to increase research productivity by shifting funding from institutional support to competitive grants, support research useful for economic development, and encouraged applied research institutes to be more self-supporting by commercializing the technologies they produced (Fan, Zhang, and Qian 2006).
After remaining stagnant in terms of the share of agricultural gross domestic product for more than a decade (between the early 1980s and mid-1990s—Pray, Rozelle, and Huang 1997), investment into R&D finally began to rise in both absolute and relative terms. Government investment in agricultural R&D increased by 5.5% annually between 1995 and 2000 and by more than 15% annually after 2000 (Hu et al. 2007). Funding was greatly increased for plant biotechnology, although Bt cotton is the only genetically engineered crop that has been commercialized to any significant extent (Huang et al. 2002).
The extension system in China was once known as a system that was effective in moving technology from the experiment station to the farm and for giving farmers advice in combating diseases and insects. With the publicly funded system, there were extension agents at the county and township levels. After the mid-1980s, however, fiscal pressures at all levels of government induced local officials to commercialize the extension system. Extension agents had their salaries reduced by half or more. The extension system—focused on supplying technology and other information to farmers—almost collapsed completely. Surveys found that most cropping farmers rarely, if ever, saw extension agents. Likewise, livestock and horticulture farmers received little support from the formal extension system.
There also are other economic factors affecting the nation’s productivity. First, China’s agricultural economy has been steadily transforming from a grain-first sector to one producing higher-valued cash crops, horticultural goods, and livestock and aquaculture products. In the early reform period, output growth—driven by increases in yields—was experienced in all subsectors of agriculture, including grains. However, after the mid-1990s, the area sown to rice and wheat production has fallen, as has the domestic production of these two staple food crops. The contraction in grain supply was preceded by a reduction in demand as increasing per capita incomes, rural to urban migration and a reduction in government marketing controls shifted the pattern of consumption away from staple food grains. Like the grain sector, production of cash crops in general and specific crops, such as cotton, edible oils and vegetables and fruit, also grew rapidly in the early reform period. In contrast to staple grain crops, the output of these other crops continued to grow throughout the reform era beginning in the 1980s, some at rates in excess of 5% per year.
The growth in livestock and fishery output outpaced the growth in output from the cropping sector, in total and in most crop subcategories. Livestock production increased by 9.1% per year in the early reform period and has continued growing at between 4.5 to 8.8% per year since 1985. Fisheries production has been the fastest growing component of agriculture, increasing by more than 10% per year during 1985-2000. Today, more than 70% of the world’s fresh water aquaculture production occurs in China. At the same time, the combined share of livestock and fisheries in total agriculture rose to 45% in 2005, more than doubling their 1980 share. Dairy production also is rising extremely rapidly (Fuller et al. 2006).
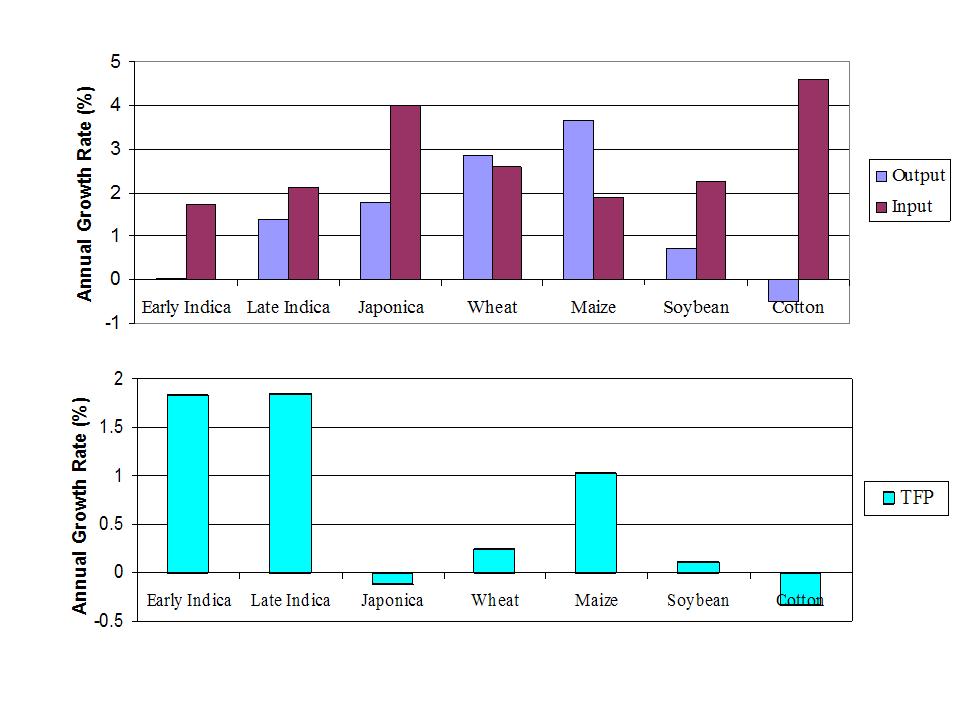
After the rapid growth in output and the decline in inputs—involving mostly labor that shifted to off-farm activities—during the early 1980s (McMillan, Whalley, and Zhu 1989; Lin 1992), policy-makers became increasingly concerned about the slowing pace of agricultural output growth. In fact, our data suggest that these concerns were justified in the case of some crops but not others. For example, Figure 1 (Top Panel) demonstrates that output of early and late indica rice, japonica rice, and soybeans grew by less than 2% per year during the decade 1985-1994, substantially below the average rates of growth of the prior decade. For these four crops, input use actually increased by 1.7 to 4.0% per year, depending on the crop, which was faster than the corresponding rate of growth in crop output. In contrast, during the same decade, production of wheat and maize grew by 2.8 and 3.7% per year respectively, generally exceeding the corresponding rate of growth in input use, which averaged about 2% per year.
While pre-1995 data for cash crops and livestock production are limited, the record of output and input trends also varied among commodities. Widespread problems with cotton pests meant cotton production contracted by 0.49% per year between 1985 and 1995, while input use in this sector expanded by more than 4% per year. Inputs used in hog production also grew faster than output, whereas output grew faster than inputs for beef production.
TFP analysis demonstrates that policy concerns regarding the relatively poor performance by Chinese agriculture during 1985-1994 were justified (Figure 1, Lower Panel). For early and late indica rice and soybeans, our estimates indicate that TFP during this period grew by a relatively modest rate compared with the early 1980s. The growth rates of TFP were even smaller for wheat and maize. Japonica rice productivity actually fell by 0.12% per year from 1985 to 1994.
The record is mixed during this period for nongrain crops. The decline in the rate of growth in cotton TFP shows that China’s cotton production sector was becoming less competitive during the decade 1985-1994 (Qiao et al. 2006). Although the research system helped stem the fall by producing some new conventional cotton varieties, production efficiency declined; TFP trends in the hog sector followed a similar path.
The relatively slow rates of growth of output experienced in 1985-1994, compared with the pace of growth in previous years, raised concerns that the underlying rate of TFP growth had systematically slowed after 1984. Hitherto information has been lacking on the pace of productivity growth for the major grain crops for the decade after 1995. In addition, there has never been a systematic analysis of the productivity performance of rapidly emerging agricultural sectors, such as horticulture, poultry and dairy.
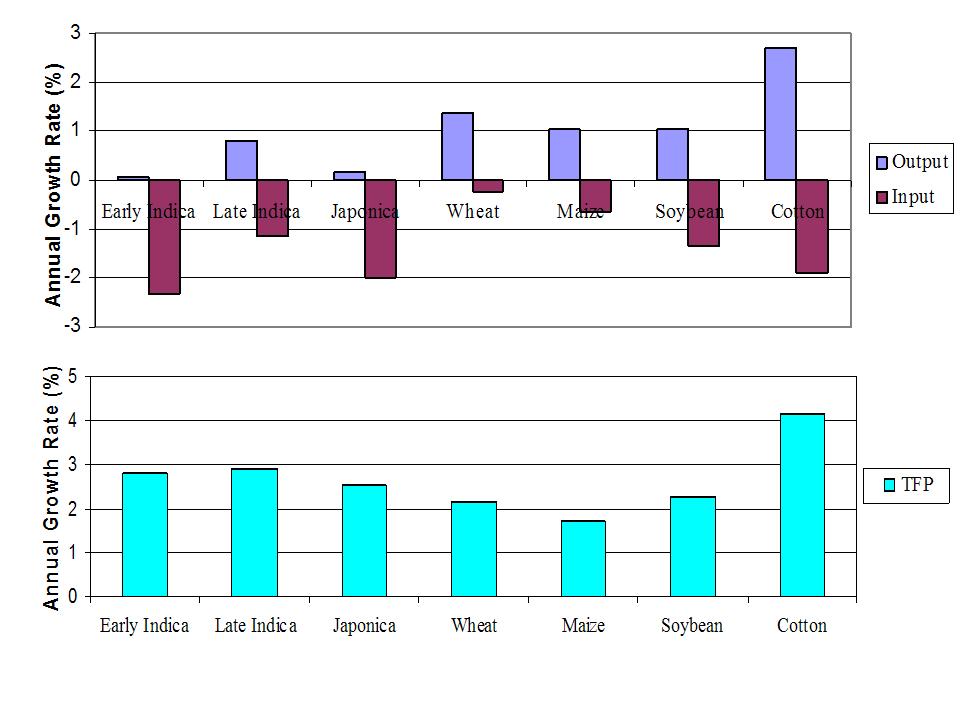
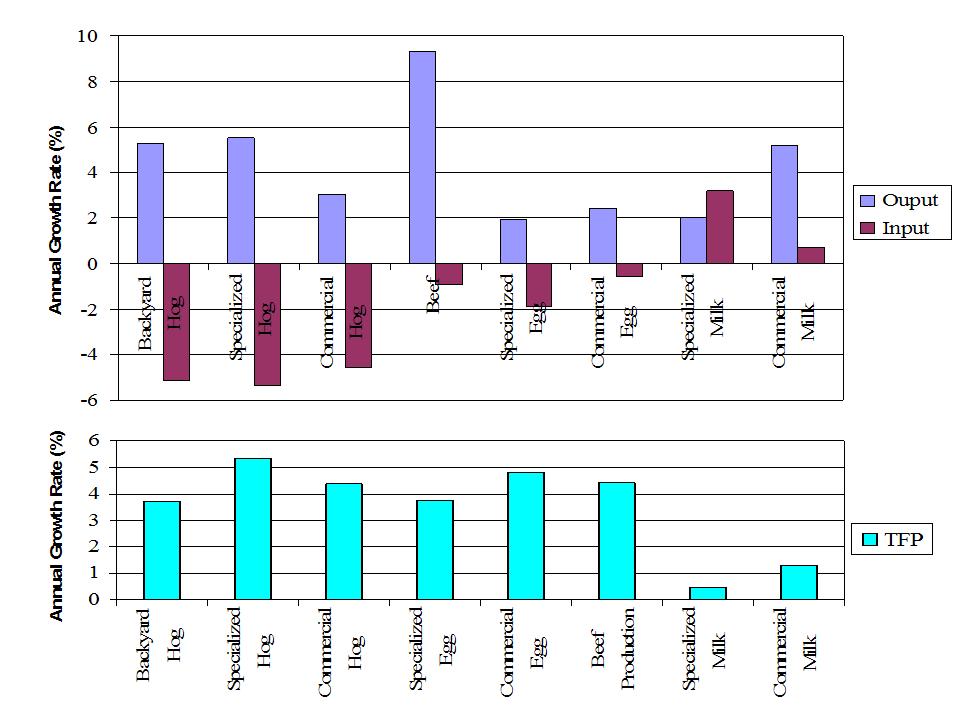
Agricultural output growth for most commodities rebounded during the period 1995-2004 (Figure 2, Top Panel). For 20 of the 23 commodities, for which we have more-complete data, output grew at a faster rate than inputs. This was so for all the grain crops as well as soybeans. Other sectors within agriculture showed similar trends. Cotton production expanded by 2.68% per year, whereas measured inputs declined by 1.90% per year. Most likely, the widespread uptake of Bt cotton—which allowed farmers to dramatically reduce pesticide use and labor for spraying while increasing yields—is a large part of the story. With the exception of the specialized milk sector that is mostly made up of large commercial dairies, the livestock sector also saw output growing faster than inputs during 1995-2004.
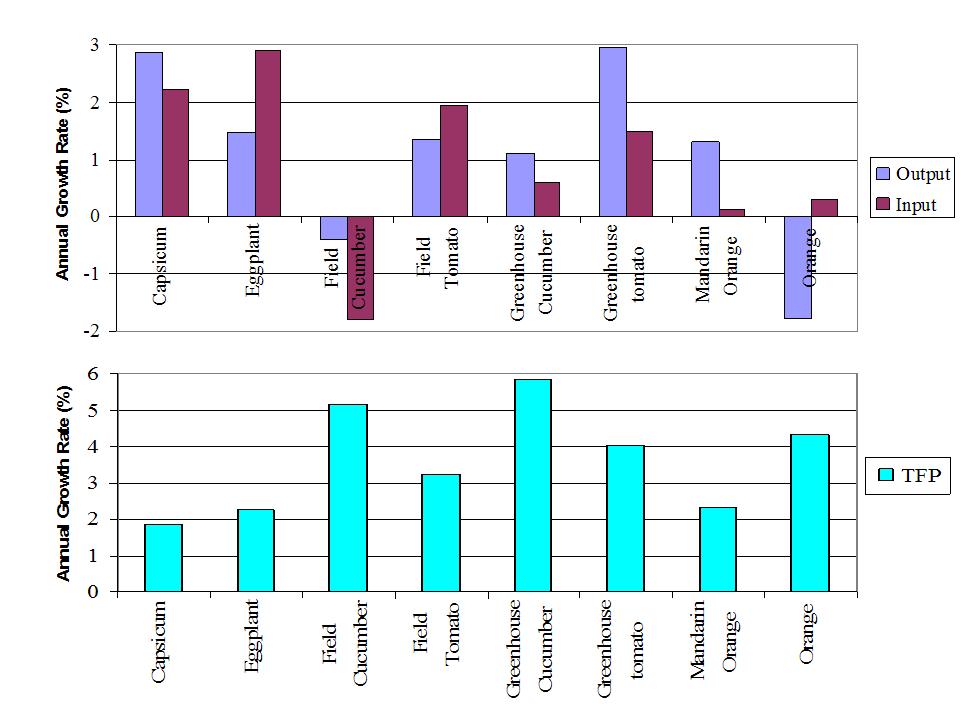
The horticultural sector has a more mixed record (Figure 3, Top Panel). The pace of output growth exceeded the pace of growth in input use for five of the horticultural crops, namely capsicum, field cucumbers, greenhouse cucumbers, greenhouse tomatoes, and mandarins. In contrast, the opposite held for eggplants, field tomatoes, and oranges. The fact that greenhouse tomatoes and other greenhouse vegetables experienced faster output growth relative to input growth—compared with less favorable output-input trends for field tomatoes and some other crops—might reflect the greater farming abilities of those commercial farmers who adopted greenhouse technologies.
TFP growth during 1995-2004 was positive for all 23 commodities and in all cases was greater than the measured TFP for the pre-1995 period (Figures 2, 3 and 4, Lower Panel). With just a few exceptions, TFP growth for these commodities exceeded 2% per year after 1994. In fact, using the respective value shares of output as weights when aggregating these 23 commodities, the implied rate of growth of TFP for Chinese agriculture exceeded 3% per year between 1995 and 2004. Coupling these estimates with the corresponding TFP estimates for 1978-1994 implies that TFP growth in China over the period 1978-2004 sustained an average rate of growth in excess of 3% per year; a remarkable achievement over a quarter of a century. It also appears that TFP growth accelerated between the late 1980s and 2005.
Some of the highest rates of TFP growth have been in the livestock sector. If one considered the fact that domestic investment into livestock productivity-enhancing research during the 1980s and 1990s was relatively low this might seem surprising. It could be, however, that foreign technologies have played a role in the rapidly increasing TFP growth in the livestock sector after 1995 (Figure 4). During the 1990s, China encouraged the importation of large amounts of new genetic material for the hog, beef, poultry and dairy industries. The quality of the genetic stock in China’s livestock industry has greatly increased through the introduction of new hog varieties from the United States and Japan; new beef and dairy cattle genetics from Canada, New Zealand and Australia; and poultry technology from around the world, including the United States. Apparently these new innovations have found their way into individual farms in China’s villages as well as fledgling commercial operations.
Our analysis shows that agricultural TFP in China grew at a relatively rapid rate since 1995 for a large number of commodities. TFP for the staple commodities generally increased by about 2% per year; TFP growth rates for most horticulture and livestock commodities were even higher at between 3 and 5% per year. The rate of increase in agricultural TFP in China over the quarter century, 1978-2004, was high by historical standards and compared with corresponding rates of TFP growth reported for many other countries around the world. We ascribe much of this TFP growth to changes in the technologies flowing to and being used by these sectors. Both domestic and foreign technologies have played a role. Sustained and increasing support of China’s agricultural research has been vital to this success, as has an openness to trade in technologies produced by public research agencies in foreign countries and foreign firms.
Rapid TFP growth is important for the competitiveness and national food security in China in the coming years. It is also important to keep China from putting too much pressure on international markets. If China’s economic growth continues, its consumers are going to demand increasing quantities of meat, fish, fruits and vegetables. These demands mean that large increases in production will be needed to feed China. Simulation modeling has shown that continued rapid growth of the economy and slow productivity growth would result in extremely large demands for imports. Being such a large country with access to foreign reserves, international prices would feel upward pressure. However, if agricultural productivity growth in China remains strong, simulations clearly demonstrate that its own farmers will be able to produce most of the food that China’s consumers will demand. The race between China’s future supply and demand of food will be a key determinant of future international trade flows, and in no small part will depend on the future productivity performance of its own farming sector.
Fan, S., K. Qian, and X. Zhang. (2006). China: an Unfinished Reform Agenda. Chapter 3 in Agricultural R&D in the Developing World: Too Little, Too Late? Eds. P.G. Pardey, J. M. Alston, and R. R. Piggot. Washington DC: International Food and Policy Research Institute.
Fan, S., and Zhang, X. (2002). Production and Productivity Growth in Chinese Agriculture: New National and Regional Measures. Economic Development and Cultural Change, 50(4), 819-838.
Fuller, F., Huang, J., Ma, H., and Rozelle, S. (2006). Got Milk? The Rapid Rise of China’s Dairy Sector and Its Future Prospects. Food Policy, 31(3), 201-215.
Hu, R., Shi, K., Cui, Y., and Huang, J. (2007). China’s Agricultural Research Investment and International Comparison (Working Paper). Beijing, China: Center for Chinese Agricultural Policy, Institute of Geographical Sciences and Natural Resource Research, Chinese Academy of Sciences.
Huang, J., Rozelle, S., Pray, C., and Wang, Q. (2002). Plant Biotechnology in China. Science, 295(25): 674-677.
Jin, S., Ma, H., Huang, J., Hu, R., and Rozelle, S. (in press). Productivity, Efficiency, and Technical Change: Measuring the Performance of China’s Transforming Agriculture. Journal of Productivity Analysis.
Lin, J.Y. (1992). Rural reform and agricultural growth in China. American Economic Review, 82(1), 34-51.
McMillan, J., Whalley, J., and Zhu, L. (1989). The Impact of China’s Economic Reforms on Agricultural Productivity Growth. Journal of Political Economy, 97(4), 781-807.
Pray, C. E., Rozelle, S, and Huang, J. (1997). Can China’s Agricultural Research System Feed China? (Working Paper). New Brunswick, NJ: Department of Agricultural Economics, Rutgers University.
Qiao F., Huang, J., Rozelle S., and Wilen, J. 2006. Managing Pest Resistance in Fragmented Farms: An Analysis of the Risk of Bt Cotton in China and its Zero Refuge Strategy and Beyond (Working Paper). Palo Alto, CA: Freeman Spogli Institute, Stanford University. Available online: http://iis-db.stanford.edu/pubs/21622/managing_resistance_new_version_3.pdf
Rozelle, S., Pray, C. E., and Huang, J. (1997). Agricultural Research Policy in China: Testing the Limits of Commercialization-led Reform. Comparative Economic Studies, 39(2), 37-71.
Stone, B. (1988). Developments in Agricultural Technology. China Quarterly, 116, 767-822.
We thank Julian Alston, Ruifa Hu, Hengyu Ma, Philip Pardey and the anonymous reviewers for valuable comments that have improved the quality of the paper.