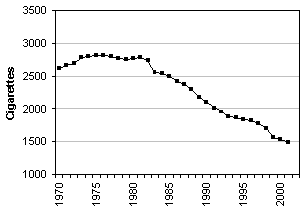
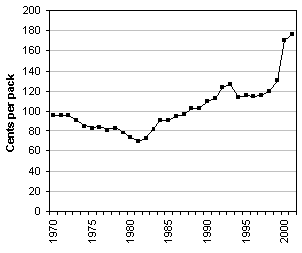
Over the past 20 years, there has been a decreasing trend in per-capita cigarette consumption and an increasing trend in cigarette prices in the United States (Figures 1 & 2). In addition to the increase in cigarette prices, public awareness of negative health issues related to smoking has increased substantially during the past three decades. Does the increase in cigarette prices contribute to the decrease in cigarette consumption, or is the decrease in cigarette consumption mainly influenced by a change in consumers' desire for cigarettes in the United States over the past two decades? Health Issues
The United States Department of Health and Human Services and voluntary health agencies are continuing efforts to improve public awareness on the possible causes of illnesses associated with smoking. Three decades ago, the 1972 Surgeon General's report on smoking and health indicated a danger from passive smoke; that is, involuntary smoking, which occurs from breathing in a smoke-filled room.
Cigarettes, cigars, and pipes could be smoked almost anywhere 30 years ago. Since the 1972 Surgeon General's report, laws in most states prohibit smoking in certain places or segregate smokers from nonsmokers. Indoor areas at restaurants and bars in New York City are some of the most recent additions to the list, since a ban was made official on March 30, 2003. Many cities and counties have similar laws. Many subsequent studies have condemned environmental tobacco smoke and implemented regulations restricting where people can smoke. During the past two decades, restrictions on where people can smoke have increased dramatically in the United States.
Public awareness of health-related issues reached another peak in November 1998, when the attorneys general from 46 states and the major cigarette companies signed the Master Settlement Agreement (MSA). The MSA was intended to reimburse states for expenses related to the treatment of smoking-related illnesses as well as to create prevention and control programs to discourage smoking. Cigarette companies agreed to numerous changes in the way cigarettes are marketed, especially in response to misleading advertising targeted toward youth.
Increase in Cigarette Prices
In addition to health concerns in response to evidence of links between smoking and various diseases as well as a general social bias against smoking, the decrease in cigarette consumption can be attributed to higher prices. The MSA payments as well as increases in federal and state excise taxes play an important role in cigarette price increases. Cigarette manufacturers have been forced to raise prices to cover the $246 billion cost of the settlement and separate agreements with four other states. The very day of the settlement, manufacturers boosted prices by 45 cents per pack, the largest increase ever. Between the MSA date and April 2002, wholesale manufacturers prices rose eightfold (Tobacco Outlook Report, 2003).
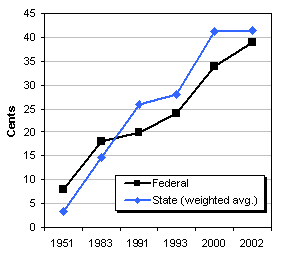
The first federal excise tax increase since 1951 occurred in 1983; it raised federal excise taxes on cigarettes by 8 cents per pack (Figure 3). During the 1990s, federal taxes rose an additional 8 cents per pack. In 2000 and 2002, the federal excise tax increased a cumulative 15 cents per pack, bringing the current level to 39 cents per pack. Fiscal year 2001 (October 2000-September 2001) federal cigarette excise tax collections are estimated at $7.4 billion compared with $7.2 billion the previous year. Collections are likely to increase further in fiscal year 2002 because of the higher federal excise tax. State taxes have also risen dramatically in recent years, and even cities have jumped onto the tax bandwagon (Tobacco Outlook Report, 2003).
State excise taxes have increased at a much greater rate then federal taxes. During the 1970s, state excise taxes (weighted by consumption) increased from 10.2 to 12.9 cents per pack. By the end of the 1980s, tax increases accelerated until the weighted average was 21.8 cents. The trend continued in the 1990s, with state excise taxes ending the decade at 38.2 cents per pack. By the end of 2002, 19 states had excise taxes exceeding 50 cents per pack, and 5 states collected $1.00 per pack or greater. State tax collections in 2002 increased by $97 million to $8.4 billion.
Higher taxes offset lower consumption. State excise taxes were collected on 411.7 billion cigarettes. States taxes range from 2.5 cents to $2.05 per pack. The average state cigarette excise tax in 2002, weighted by consumption, is 41.4 cents per pack. Vermont, Kansas, and Hawaii were set to increase cigarette excise taxes on July 1, 2003 (Tobacco Outlook Report, 2003).
Although consumption is declining, increases in per pack federal tax rate and average state tax rate weighted by consumption on a per state basis have resulted in higher tax collection. Likewise, MSA payments, which are adjusted by changes in consumption, have not been affected to the extent expected by large price and tax increases due to the inelastic nature of demand for cigarette.
What do Price Elasticity of Cigarette Demand and the Correlation between Cigarette Consumption and Education Attainment Tell Us?
Higher prices increase costs to consumers and discourage cigarette consumption. As the price of an item increases by a certain percentage, consumption of the item falls. The percentage decline in consumption caused by a percentage increase in price is measured by price elasticity of demand. Price elasticity of demand can help show that some of the decline in cigarette consumption can be explained by higher prices, but most of the decline is attributed to expanding health concerns.
According to the Surgeon General's Report on Reducing Tobacco Use, most studies provide an estimate between -0.3 to -0.5 for price elasticities of demand for cigarettes. For instance, Lewit and Coate (1982), using the 1976 National Health Interview Survey, reported an estimated price elasticity of -0.42. Chaloupka and Wechsler (1997), using the Harvard College Alcohol Study, reported an estimated price elasticity of -0.58. The studies in the Surgeon General's Report on Reducing Tobacco Use apply various theoretical and empirical modeling techniques. Traditional demand and rational addiction models are the most commonly used theoretical frameworks. Studies on cigarette demand examine both aggregate data and individual level data. Regardless of the use of various modeling techniques and data structures, price elasticities of demand for cigarettes in the United States are inelastic (Bradford, 2003).
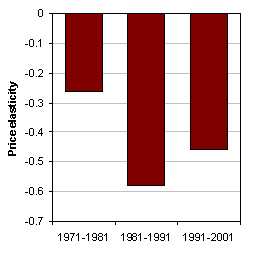
Despite the simplicity of the method used to calculate elasticities of demand in this study (the percentage change in consumption to change in real price), our results closely replicate other empirical studies using different techniques. As with other empirical studies, our prices do not reflect price discounts and promotions (due to data limitations). Our calculations for price elasticities of demand for cigarettes between the 1971 to 2001 are shown in Figure 4.
The price elasticity is -0.26 for the period 1971-81, which indicates that a 10% increase in cigarette price brings a 2.6% decrease in cigarette consumption. The role of cigarette price in determining cigarette consumption increased materially in the 1980s, with a 5.8% reduction in consumption associated with a 10% increase in price. However, over the last three decades, cigarette consumption has remained price inelastic, which means a change in price has a relatively modest downward impact on consumption.
According to the Center for Nutrition Policy and Promotion, individuals with less education have lower average scores on the Health Eating Index (1995). To show that the diminished consumer desire for cigarettes has a major role in the decreasing trend in cigarette consumption, the correlation coefficient for cigarette consumption per capita and the ratio of graduate students to the total population is shown in Table 1. The proportion of graduate students in the total population is used to capture the change in education attainment, which is used as a proxy for practicing healthy eating habits.
The correlation coefficient measures the degree to which cigarette consumption per capita and the number of graduate student per capita vary together (i.e., positively or negatively). A correlation coefficient of 0 represents complete independence among the two variables. The maximum positive and negative correlation coefficients are 1 and -1 respectively. A correlation coefficient of 1 indicates the two variables covary positively and perfectly, whereas a -1 specifies a negative and perfect covariation. The correlation index changed from positive to negative during 1970-1980 and remained positive for the past 20 years. The result reflects that increase in practicing healthy eating habits did not deter cigarette consumption in the 1970s, as it does in the 1980s and 1990s. The result explains the increasing trend in cigarette consumption in the 1970s, which was followed by a continuous decrease to the present. The findings implies that the increase in consumer awareness of the negative health effects from smoking have a major role in contributing to the change in consumers' desire for cigarettes.
Conclusions
The decline in cigarette consumption over the past two decades in the United States reflects both economic and noneconomic factors. The costs incurred by cigarette companies have increased prices during this period—frequently in excess of the overall Consumer Price Index. Higher manufacturer wholesale prices, taxes at all levels, and increased costs through the marketing chain have further contributed to the increase in prices. Noneconomic factors, such as widely understood links between cigarettes and disease, widespread restrictions on where people can smoke, and the effects of secondhand smoke on nonsmokers, also play a major role in deterring cigarette consumption.
The inelastic nature of demand for cigarettes indicates that only some of the decline in cigarette consumption can be explained by higher prices during the last three decades. The correlation indexes between cigarette consumption and better educated consumers indicate that health concerns, in response to evidence of links between smoking and various diseases, have a major role in deterring consumers' desires for cigarettes, which contributes to the decrease in consumption over the past 20 years.
For More Information
Bradford. (2003). Pregnancy and the demand for cigarettes. American Economic Review, 93(5), 1752-1763.
Chaloupka & Wechsler. (1997). Tobacco control policies and smoking among young adults. Journal of Health Economics, 16(3), 359-73.
Lewit & Coate. (1982). The potential for using excise taxes to reduce smoking. Journal of Health Economics, 1(2), 121-45.
Orzechowski & Walker. (2001). The tax burden on tobacco. Arlington, VA.
United States Census Bureau. (2003a). College enrollment of students 14 years old and over, by type of college, attendance status, age, and gender: October 1970 to 2001. Available on the World Wide Web: http://www.census.gov/population/socdemo/school/tabA-7.xls.
United States Census Bureau. (2003b). Income statistics. Washington, DC. Available on the World Wide Web: http://www.census.gov/hhes/www/income.html.
United States Department of Agriculture Center for Nutrition Policy and Promotion. (1995). The healthy eating index. Washington, DC.
United States Department of Agriculture Economic Research Service. (2002). Tobacco outlook report. Washington, DC.
United States Department of Agriculture Economic Research Service. (2003). Tobacco outlook report. Washington, DC.
United States Department of Labor Bureau of Labor Statistics. (2003). Consumer price index—all urban consumer. Washington DC. Available on the World Wide Web: ftp://ftp.bls.gov/pub/special.requests/cpi/cpiai.txt.
|


