Access and proximity to large nearby population concentrations, high population density in general, and high per capita income have traditionally been competitive advantages for commercial farmers in the Mid-Atlantic states and larger Northeast region. However, as population in this already densely populated area has increased, so has land development, causing the commercial growers in the area to operate on a relatively small land base with high production costs. Encroachment on farmland, coupled with the challenge to maintain profitability, make it particularly difficult for viable production of larger-scale agronomic crops that require substantial acreage in order to breakeven. In addition, modern produce distribution practices are allowing commodity products from distant areas, with lower production costs, to be shipped into the Northeast region's population centers. In response to these new challenges and to remain profitable, many farmers in the region have been shifting production and adopting methods to grow higher value horticultural and specialty crops. Such crops are usually targeted toward a specific, small consumer base or market niche that is particularly interested in and highly values the inherent uniqueness of the crop. Therefore, this study seeks to identify the local demand for ethnic produce, assess ethnic consumer shopping patterns, analyze consumer willingness to pay for the ethnic produce, and suggest products for potential local production. The research area is fresh Asian ethnic fruits and vegetables, and in particular those preferred by Chinese, Indians, and Koreans. The perishable nature of such crops, combined with the local growth trends in these Asian segments, will well position farmers in the region who grow such crops to exploit the comparative advantages associated with marketplace proximity.
Identify Ethnic Market Niches (Who?)
The study targets Asian consumers as an ethnic market niche opportunity, chosen for their prevalence and significant growth in the United States, and even more notable growth in the Northeast. The significant Asian population proportions and recent growth trends in the Northeast are consistent with Asian representation and trends at a national level (U.S. Census, 2000; 4.0% and 3.6% Asian population in the Northeast and United States, respectively, with growth over U.S. Census 1990 at 60% and 48%, respectively, for the Northeast and United States). Correspondingly, the Northeast's absolute population growth of Asians exceeds that of any other race category, contributing significantly to the overall population growth for this region. Another consideration for selection, and for which the Asian group stands out at a national level, is the purchasing power for each ethnic population segment. With median household income as the selection criteria, Asians far exceed the national totals for all races combined, as well as Whites, Blacks, and Hispanics, and have consistently done so since before 1990 (Current Population Survey, 2000, 2004).
Assess and Address Ethnic Market Demand (Research Approach)
The research approach entailed the use of a mail-administered written survey that was sent to and completed by the (self-identified) principal grocery shopper for each household. Prior to survey administration, a panel of experts was formed to provide input, offer suggestions, and ultimately review the three ethnic group selections and varieties of fruits and vegetables included in the questionnaire for each Asian group. Upon completion of the crop selection and survey design process, the questionnaires were mailed to samples of Chinese, Asian Indian, and Korean residences (presumed households per address, as identified by leads purchased via InfoUSA.com) throughout New Jersey, New York, and Pennsylvania. Specifically, sample targets were identified based on 2000 Census populations for Chinese, Asian Indians, and Koreans in the three Mid-Atlantic states (NJ, NY, PA). A sample size of 1,800 surveys was statistically determined, with 600 surveys for each of the three groups. Further sample size requirements were established, based upon ethnic group by state, in accordance with a stratified random sampling method. A total of 447 useable surveys were returned. A roughly 25% response rate was realized and was fairly consistent across groups. The usable surveys by group were 152 from Chinese, 135 from Indians, and 160 from Koreans, with overall response rates of 25%, 23%, and 27%, respectively. The corresponding results for each ethnic group (irrespective of state) yields a margin of error of approximately 8% in order to achieve the desired 95% confidence interval.
Respondents were separated into two groups; consumers and nonconsumers (more than 90% and less than 10%, respectively, in each of the three ethnicities), based on a surveyed criteria of having purchased ethnic (Chinese, Indian, or Korean) produce in the past year. Both groups were questioned for socio-demographic information. Only the consumer group was questioned as to their specific produce expenditures and shopping patterns and preferences. Despite the variation in survey usability by question (not every question applied to each respondent; not all questions were completed for each survey), a margin of error of less than 9% is maintained throughout the study.
1. Prioritize Potential Production Crops for Local Entry (What?)
The respondents' average weekly expenditures for total fresh fruits and vegetables, whether traditional U.S. or ethnic produce, is $45.48 (all respondents, consumers and non-ethnic produce consumers; ranging from $38.60 for Koreans to $54.06 for Chinese respondents, with $43.53 for Indians being relatively close to the average for all three groups). Specific produce expenditures for respondents that purchased ethnic produce within the past year (ethnic produce "consumers") were also documented. Expenditure data was collected for thirteen ethnic produce items for each respective ethnic group. The crops of interest were selected based upon their potential for production in the Mid-Atlantic states and larger Northeast region, with specific consideration for the growing cycle of specialty crops and their conduciveness to the climatic patterns in the area. The top five ethnic produce items purchased in each group, ranked in descending order on the basis of average weekly respondent expenditure are as follows (with the corresponding expenditures in parentheses); for Chinese, Flower Chinese Cabbage ($3.18), Edible Snow Peas ($2.68), Chinese Kale ($2.66), Bitter Gourd ($2.65), and Oriental Eggplant ($2.36); for Indians, Bitter Gourd ($3.14), Okra ($2.95), Yam ($2.95), Mustard Leaves ($2.73), and Black Eyed Beans ($2.69); and for Koreans, White Nectarine ($3.76), Fuji Apple ($3.39), Korean Cabbage ($2.58), Korean Cucumber ($2.39), and Green Onions ($2.32). The individual respondent expenditures for each item were calculated based on the corresponding quantity purchased and price paid for each, in an attempt to prioritize and target individual ethnic crops with the highest market potential in the Mid-Atlantic area.
2. Understand Shopping Patterns of Respondents (When? Where?)
i) Shopping Frequency
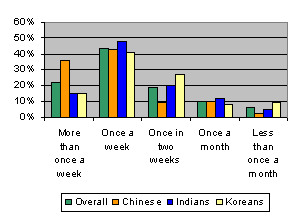
The shopping patterns of respondents included the responses of ethnic consumers who identified themselves as having purchased ethnic (Chinese, Indian, or Korean) produce in the past year (Figure 1). Just under half of these ethnic produce consumers shop once a week (ranging from 41% to 48% by ethnicity). Another roughly 40% shop either more than once a week or once every two weeks. Fewer than 20% in each group shop once a month or less. However, there is variation across the groups, as the Chinese typically shop slightly more frequently than their Indian and Korean counterparts; 36% of Chinese shop more than once a week compared to 15% of each of the Indian and Korean groups in this category.
ii) Multi-Store Shopping and Establishments Frequented
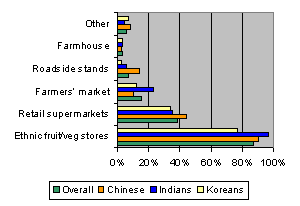
Consumer responses indicated that approximately three-quarters of those purchasing ethnic produce shop at more than one food store for their ethnic produce (Figure 2). Not surprisingly, as seemingly correlated with more frequent store visits, slightly more Chinese consumers shop multiple stores than Indians or Koreans. To ascertain which establishments consumers shop at for ethnic produce, respondents were asked to indicate all types of establishments from which they purchase ethnic produce during the peak season or "summer" months (as not all types are available at nonpeak times of year). Each respondent was provided a list of five types of establishments, as well as an "other" category. They were then asked to indicate all that apply. More than three-quarters of the consumers in each group indicated that they purchase from ethnic stores. Although all three ethnic groups display high "brand loyalty," there is notable variation across the sample groups as the ethnic store shoppers range from 77% of Korean consumers, compared to 90% of Chinese, and a staggering 97% of Indian consumers. Approximately 40% of the consumers surveyed indicate that they purchase ethnic produce at retail supermarkets (with relatively little variation across groups, ranging from 35% to 44%). Between 10% and 23% of consumers surveyed indicate that they make purchases at farmers' markets, with Indians at the high extreme and Chinese and Koreans at or close to the bottom of that range.
iii) Proximity to Market
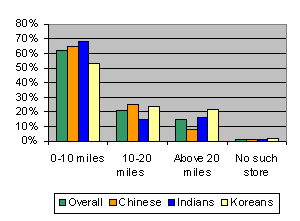
One factor that may affect consumer shopping patterns is each consumer's ability to shop, based upon store availability (or lack thereof). To assess store availability, the consumers purchasing ethnic produce were asked to indicate how close the nearest ethnic store is to them (Figure 3). The results reveal that more than half (53%-68%) of the consumers in each sample group has access to an ethnic market within 10 miles. Another 20% or so have a market within 10-20 miles, while fewer than 25% do not have an ethnic store within 20 miles. The Korean consumers sampled appear to have fewer stores within a 10-mile radius, relative to the Chinese and Indians sampled. A higher percentage of Koreans, relative to Chinese and Indian consumers, indicated that the nearest store is greater than 20 miles away.
3. Determine Willingness-to-Pay Ethnic Produce Premiums (How?)
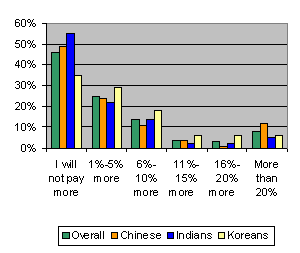
The modeling section of the study examined the consumer profiles of respondents who purchase ethnic produce to ascertain whether relationships exist between their perceptions, practices, and socio-demographics and their willingness to pay (WTP) a premium over traditional American produce for ethnic produce (Figure 4). Roughly half of the respondents from each ethnic group indicated they would be willing to pay a premium for ethnic produce. The respondents were questioned as to their willingness to pay premiums in increments of 5%, up to 20% (1-5%, 6-10%, 11-15%, 16-20%), or more. Roughly 25% indicated a willingness to pay a premium of up to 5%, and an additional 14% indicated a willingness to pay premiums of up to 10%. The results in subsequent categories were significantly lower and varied slightly by ethnicity (12% or less, with most categories within ethnic groups having 5% or less). As such, the categories that captured respondents' willing to pay premiums of more than 10% are determined to be more discriminating for the purpose of identifying and targeting ethnic consumer groups, and a criterion for WTP modeling is established accordingly.
A WTP variable is modeled against relevant consumer 'belief' and related practice variables, demographic variables (age, gender, number of adults in the household, education, income, number of years in the United States), and fixed effects for the states and ethnicities (dummy variables). The 'belief' variables reflect consumers' opinions and perceptions (for example; 'availability' is an important/very important factor in shopping for ethnic produce, and 'prices' of products from ethnic markets are better than American produce). Related practice variables include consumers' approximate spending on all produce (traditional and ethnic), whether or not they regularly read advertisement brochures, and whether they have a garden at home.
Results derived from the model indicate that consumers in households earning greater than $60K seem 9% less willing to pay a premium of more than 10% compared to consumers in lower income groups, despite the counter-intuitive nature of this response, given that produce purchases represent a relatively small portion of total expenditures for high income consumers. However, it is plausible that, due to their higher income, they have more luxury-type food alternatives available to them (such as eating out) than their lower-earning counterparts who view ethnic produce as more of a staple in their diet. Females are 13% more likely to pay a premium of more than 10% for ethnic produce than male shoppers.
In addition, ethnicity and state of residency appear to play a significant role in consumers' willingness to pay a premium. For example, Koreans and Chinese are 16% and 13%, respectively, less likely to be willing to pay a premium than Indians. Further, consumers in New York and New Jersey are 9% and 7%, respectively, more likely to be willing to pay a premium than those in Pennsylvania. As a result of these predictions, it would be most beneficial to growers and retailers to place premiums of greater than 10% on ethnic produce purchased by consumers earning less than $60,000 annual income, females, Indians, and New York/New Jersey residents.
4. Combine Consumer Profiles and Predictive Modeling to Exploit Local Ethnic Market Opportunities (Why?)
This study assessed the survey results of 447 respondents of three different Asian ethnicities (Chinese, Indian, and Korean) in the three Mid-Atlantic states to identify the local demand for ethnic produce, suggest crops for potential local production, assess ethnic consumer shopping patterns, and analyze consumer willingness to pay for ethnic produce. The survey results reveal that a vast majority (more than 90%) of respondents in each of the three ethnic groups purchased ethnic produce within the past year. Further, more than half of the consumers in each group shop once a week or more frequently for ethnic produce. Three-quarters shop at more than one food store for these purchases. More than three-quarters of those purchasing ethnic produce have access to an ethnic market (store) within 20 miles. The results of the study's "Willingness-to-Pay" model suggest that premiums for ethnic produce in excess of 10% over traditional American produce should be limited to consumers earning less than $60,000 annual income, females, Indians, and New Jersey/New York residents. These results can be used by public policy makers, retailers, and commercial growers in each state to identify and address niche market opportunities in the ethnic produce sector.
Acknowledgments
This research was supported by a grant provided to the Department of Agricultural, Food and Resource Economics (DAFRE) at Rutgers by the U.S. Department of Agriculture (USDA) - Agricultural Marketing Service (AMS) and New Jersey Department of Agriculture (NJDA), grant agreement #12-25-G-0398. The opinions expressed in the article are those of the authors and do not necessarily reflect official positions or policies of the USDA, NJDA, DAFRE, or Rutgers University.
For More Information
Current Population Survey. (2004). 2004 Annual Social and Economic Supplement. U.S. Census Bureau, United States Department of Commerce. Washington, D.C.
Current Population Survey. (2000). Median Household Income by Race and Hispanic Origin: 1967-1999. U.S. Census Bureau, United States Department of Commerce. Washington, D.C.
Mangan, F. (2002). Producing and Marketing Vegetable Crops for Ethnic Markets. UMass Vegetable Notes, 13(1), 1-6. Available online: http://www.worldcrops.org//documents/vegnotes_jan_02.pdf.
Tubene, S. (2002). Agricultural & Demographic Changes in the Mid-Atlantic Region Implications for Ethnic and Specialty Produce. University of Maryland Fact Sheet 793. Available online: http://www.agnr.umd.edu/MCE/Publications/Publication.cfm?ID=542.
U.S. Census. (2000). United States Department of Commerce. Washington, DC.
U.S. Census. (1990). United States Department of Commerce. Washington, D.C.
|
|
Other articles in this theme:
|
|


