Throughout 2022, U.S. consumers faced persistent increases in egg prices. According to the Bureau of Labor Statistics (BLS), the average retail price of eggs (grade A, not seasonally adjusted) reached a record high of $4.25/dozen in December 2022, up 138% from December 2021 ($1.79/dozen) (BLS, 2023). Comparable increases have been observed in the egg producer price index (PPI), which is a measure of the average price paid to U.S. egg producers (see Figure 1). Soaring egg prices have garnered attention from policy makers and researchers and have been the subject of recent news reports including the Wall Street Journal, New York Times, and The Economist. Further indication of increased interest is the intensity of Internet searches: Over the last year, the number of searches on egg-price-related terms increased by more than 5,000% (Google Trends, 2023).
Noted causes of the recent surge in egg prices include supply-chain disruptions due to the COVID-19 pandemic, increased egg demand during the holiday season, and overall inflation (Malone, Schaefer, and Lusk, 2021; Oh and Vukina, 2022). However, most articles have cited recent outbreaks of highly pathogenic avian influenza (HPAI) (i.e., bird flu) as the primary cause (Lusk, 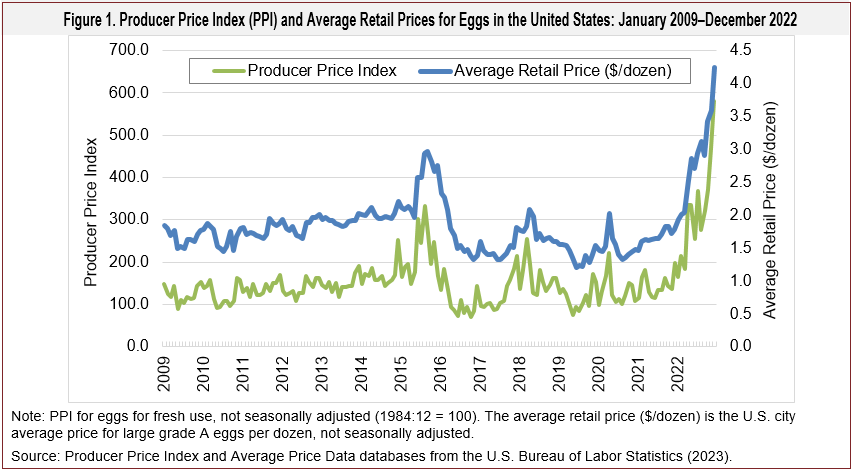 2023). Overall, the price of eggs has increased significantly more than food prices (USDA, 2023b), which raises the question: Why are eggs currently so expensive? Egg prices have been so high, in fact, that policy makers and advocacy groups have called on the Federal Trade Commission to investigate whether producers have improperly manipulated prices (e.g., Funk and the Associated Press, 2023). Although one could never rule out nefarious actions or collusion on the part of suppliers, we do not have to resort to conspiracy theories to explain the recent surge in egg prices. In this article, we show that economic factors—particularly on the production side—adequately explain the current situation, even beyond the oft-cited cause: unprecedented bird losses due to avian influenza.
Since current reports have cited bird loss due to avian influenza as the primary cause of rising egg prices, it is important to provide some background on recent outbreaks and their consequences. As part of its safeguarding mission, the USDA manages the national response to major animal disease events like HPAI outbreaks to reduce disease spread and to limit negative economic impacts on the poultry sector. Since HPAI is highly contagious and can affect humans, the USDA euthanizes both infected birds and affected flocks to prevent spread. Thus, avian influenza outbreaks have significant impacts on commercial bird populations in affected areas.
Specific to the U.S. commercial table egg layer flock, the first reported HPAI case was on February 22, 2022, in New Castle County, Delaware, affecting over a million birds. Since late February, more than 44 million commercial layers have been lost due to the disease and related depopulation protocols, accounting for about 77% of all depopulated birds for commercial use in 2022 (e.g., layers, broilers, meat birds, turkeys) (USDA, 2023a).
Figure 2 shows the monthly bird loss (actual and five-period average) and the U.S. table egg layer flock from January 2009–December 2022. The monthly bird loss data from USDA-NASS include all commercial layers (table eggs and otherwise). Thus, the bird loss numbers in Figure 2 are somewhat higher than reported losses for table egg layers only. Bird loss is a natural occurrence and simply a cost of doing business. Since January 2009, average bird loss was about 9.5 million layers per month. Prior to the last major outbreak in 2015, averaged monthly losses were about 7.8 million layers. Thereafter (2016–2021), monthly losses averaged 10.7 million layers. However, this increase in the latter period was in proportion to increases in overall flock size.
Periods of major disease outbreaks and resulting bird 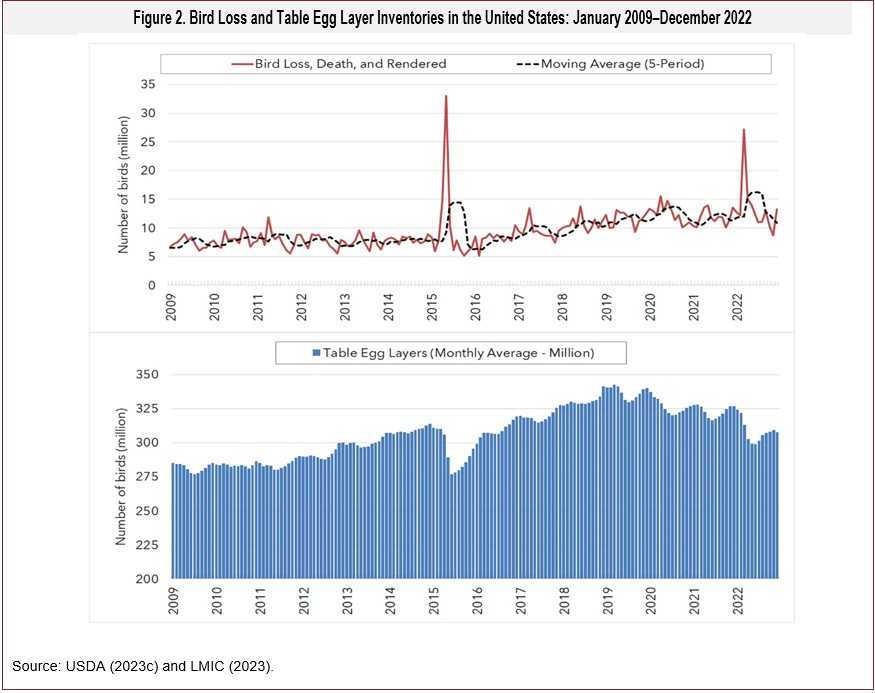 loss (e.g., 32 million birds lost in May 2015 and 27 million birds lost in March 2022) have had significant impacts on overall flock size (Figure 2). Figure 2 also shows that replacing lost birds is not a fast process and takes time. Following the 2015 HPAI outbreak, the table egg laying flock shrunk to 276 million birds by June 2015. Flock sizes then increased to 342 million birds in March 2019, which was the largest monthly average during this period. As a result of HPAI outbreaks in 2022, the table egg laying flock shrunk to 299 million birds. Disease response protocols reduced the size of the U.S. egg laying flock in 2022 by about 5% compared to the previous year.
Month-to-month fluctuations in flock size are due to various market dynamics. Historically, the U.S. egg laying flock expands in the winter and early spring due to increased demand around Christmas and Easter, then contracts when demand declines during the summer months. More recently, the downward trend in flock size was due to the COVID-19 pandemic and supply chain issues that altered grocery store demand. Although grocery demand rose during the pandemic, the egg supply chain was not initially set up to shift large volumes into the retail space. Compounding the pandemic challenges was an increase in the egg PPI, which was due to higher input costs (Malone, Schaefer, and Lusk, 2021).
Using data from January 2009–December 2022, we estimated a basic vector autoregression (VAR) model of egg prices at both the producer and retail level. While the details of the VAR model and resulting estimates are beyond the scope of this article, there are a few issuesthat we considered for the analysis, requiring a brief discussion for clarity. First, the prices paid to U.S. egg producers (as measured by the egg PPI) and average retail prices (measured in cents per dozen for the VAR procedure) were determined by the model, while the commercial bird feed cost index, natural gas price index, and relative bird loss were treated as predetermined. Depending on the U.S. region and season, natural gas is the primary energy input in egg production, although electricity is also used (Matthews and Sumner, 2015). Since natural gas and electricity prices are highly correlated, we did not include electricity prices in the model. Since bird loss is a routine monthly occurrence, we used a five-period moving average of relative bird loss for the analysis (i.e., bird loss relative to the size of the egg laying flock). This allowed for smoothing out routine month-to-month changes and negated changes in bird loss due to changes in overall flock size and allowed for significant bird losses to still have an impact, even beyond the month of occurrence.
Table 1 reports the VAR estimates. Based on the Schwartz BIC, we assumed two-period lags for the producer price index (PPI) and average retail price (ARP). The lag estimates indicate that producer prices have a positive and significant effect on average retail prices, which is to be expected. However, the effect of average retail prices on producer prices is insignificant when both lag periods are considered (note that the sum of ARP(t–1) and ARP(t–2) is not significant in the PPI equation). The effects of the predetermined (exogenous) variables on producer and retail prices are all positive, which is to be expected, and highly significant. Since these variables directly affect production, the estimates are relatively larger in the PPI equation. Note that Bird Loss has the largest estimated impact on producer prices (18.79) and average retail prices (4.28), significantly higher than the estimates 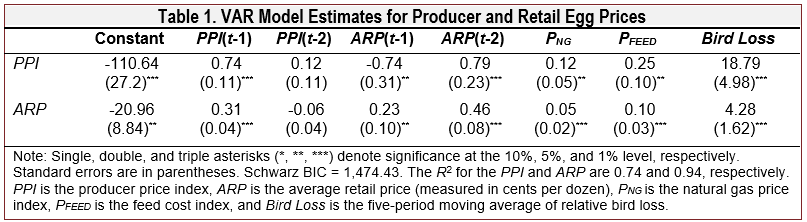 for the natural gas price index and feed cost index. Although our analysis was limited to just three exogenous variables (feed cost index, natural gas price index, and relative bird loss), these variables—along with two-period lagged dependent variables—adequately explained 74% and 94% of the variation in producer price index and average retail prices, respectively.
Table 2 reports elasticity estimates (percentage responsiveness of egg prices to a percentage change in natural gas prices, feed cost, or relative bird loss). For the long-run elasticities, we set y(t) = y(t-1) = y(t-2) (y is either PPI or ARP). Consequently, the long-run estimates account for the total effects of the predetermined variables on egg prices. For instance, the long-run elasticity for average retail prices with respect to changes in relative bird loss includes the effect through producer prices in addition to any direct effect. Like the VAR estimates, relative bird loss is the most important 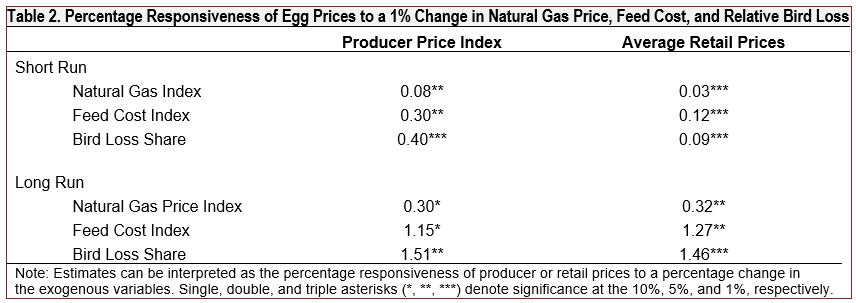 determinant of producer and retail egg prices, particularly in the long run. Note that a 1% increase in bird loss (relative to flock inventories) results in a 1.5% increase in both producer and retail egg prices. The responsiveness of producer and retail prices to feed costs is also relatively large (1.2% and 1.3%, respectively), albeit smaller than the bird loss estimates. Although statistically significant, natural gas prices had the smallest effect on egg prices (0.3% at both the producer and retail level).
To break down the impact of natural gas prices, feed costs, and bird loss on the recent surge in egg prices, we first compare all variables in 2022 to their 3-year averages (2019–2021) (See Table 3). Then we apportion the increase in retail egg prices based on the observed percentage changes in the exogenous variables. The benefit of doing an annual comparison 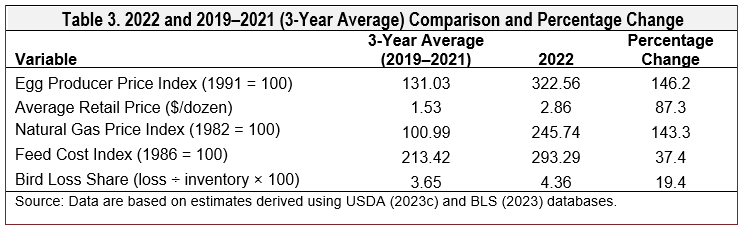 (versus a monthly comparison) is that we can ignore month-to-month changes due to seasonal factors affecting supply and demand. In comparing 2022 to the previous period (2019–2021), the egg producer price index rose from 131 to 323, which is a 146.6% increase, and retail prices increased to $2.86/dozen in 2022, up 87.3% compared to the previous period average ($1.53/dozen). Note that during the same period, the natural gas price index increased by 143.3% and feed cost by 37.4%, and relative bird loss increased by 19.4%. Taking a much longer view on commercial bird
feed and natural gas prices, we see that both 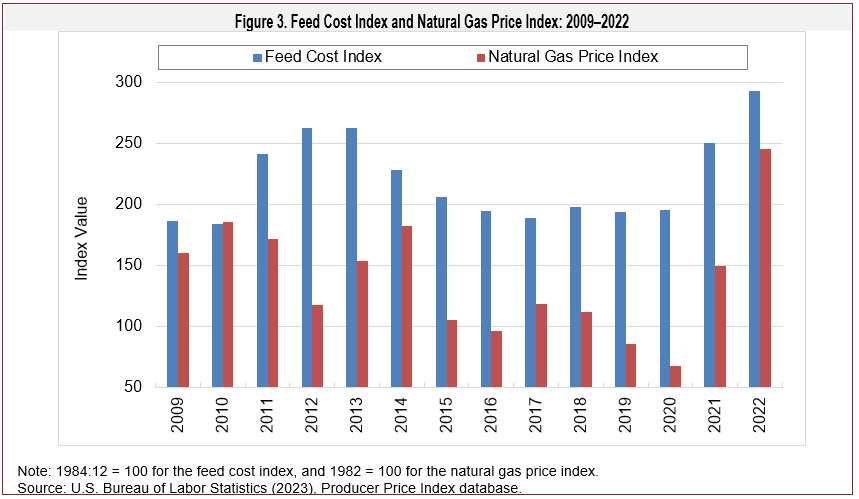 reach record levels in 2022 (see Figure 3). Interestingly, both natural gas prices and feed cost were significantly lower in 2015, when the last major HPAI outbreak occurred. This could explain why egg prices did not increase as much in 2015 despite significant bird loss that year.
We break down the change in retail egg prices for each exogenous variable (natural gas prices, feed cost, and bird loss) (see Figure 4). Using the long-run elasticity estimates for average retail prices (Table 2) and the corresponding percentage changes in the determining variables, we find that 38.0% of the total price increase is due to the increase in natural gas prices, 38.8% is due to the increase in feed cost, and 23.1% in due to relative bird loss. Applying these percentages to the increase in average retail egg prices in 2022 relative to the 3-year average (201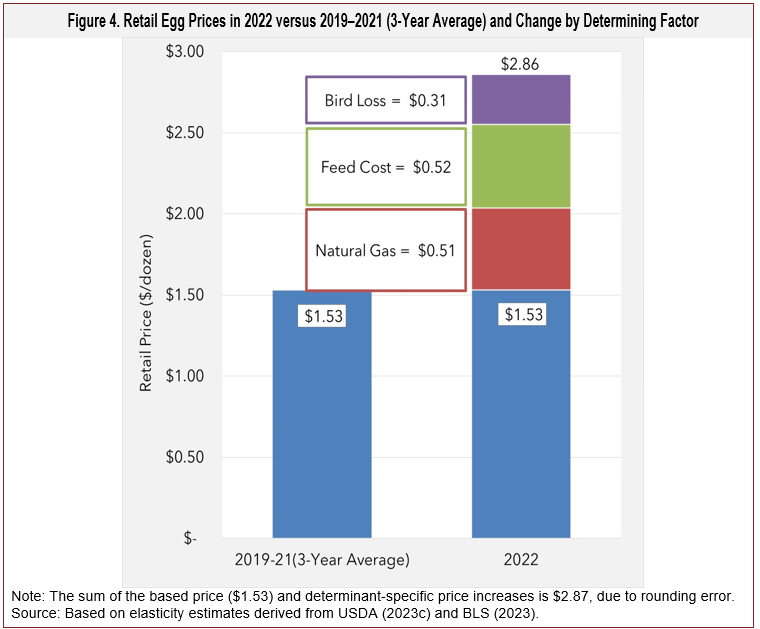 9–2021) ($1.33 = $2.86 - $1.53) we can apportion this increase by determining factor. Based on our estimates, $0.31 of the overall price increase was due to relative bird loss, $0.51 was due to natural gas prices, and $0.52 was due to the increase in feed cost (all three increases combined is slighter higher by $0.01 due to rounding error). While bird loss was the most important determinant based on the estimated impact, it was not most important in explaining the annual increase in prices. Of the three exogenous variables, the change in bird loss was smaller overall, 19.4% versus 37.4% and 143.3% for feed cost and natural gas prices, respectively.
The goal of this article was to assess the causes of high egg prices. Our analysis indicated that claims of price gouging may not be warranted given the influence of the price of natural gas, feed cost, and bird loss on both producer and retail egg prices. Although, the elasticity for natural gas prices was only 0.30, natural gas prices increased by 143.3% in 2022 compared to the previousperiod 3-year average (2019–2021), resulting in a relatively larger estimated impact on egg prices. In 2022, input prices were high overall, putting upward pressure on egg prices. Recent reports and news articles often cite avian influenza and bird loss as the primary cause of high prices. These reports are not necessarily wrong. However,our analysis reveals a very important issue that has not been thoroughly discussed. That is, current decreases in flock size due to avian influenza may be compounding the effects of higher input prices.
AgWeb, 2022. “CRP Contract Termination to Offset Global Food Crisis Gains USDA's Approval.” Available online: For More Information
Bureau of Labor Statistics (BLS). 2023. Inflation and Prices Databases. Available online: https://www.bls.gov/data/.
Google Trends. 2023. https://trends.google.com/trends/?geo=US.
Funk, J., and the Associated Press. 2023, January 25. Americans Are Furious at the Price of Eggs Skyrocketing by 137% and Urging the FTC to Investigate Potential Price Gouging. Fortune. Available online: https://fortune.com/2023/01/25/what-is-price-of-eggs-inflation-price-gouging-ftc-avian-flu/
Livestock Marketing Information Center (LMIC). 2023. https://lmic.info/
Lusk, J. 2023, January 27. “Egg Prices and Avian Influenza – A Deep Dive.” Jayson Lusk [blog]. Available online: http://jaysonlusk.com/blog/2023/1/27/egg-prices-and-avian-influenza-a-deep-dive
Malone, T., K.A. Schaefer, and J.L. Lusk. 2021. “Unscrambling US Egg Supply Chains amid COVID-19.” Food Policy 101: 102046.
Matthews, W.A., and D.A. Sumner. 2015. “Effects of Housing System on the Costs of Commercial Egg Production.” Poultry Science 94(3): 552–557.
Oh, S.E., and T. Vukina. 2022. “The Price of Cage-Free Eggs: Social Cost of Proposition 12 in California. American Journal of Agricultural Economics 104(4): 1293–1326.
U.S. Department of Agriculture. 2023a. 2022-2023 Confirmations of Highly Pathogenic Avian Influenza in Commercial and Backyard Flocks. Washington, DC: USDA Animal and Plant Health Inspection Service. Available online: https://www.aphis.usda.gov/aphis/ourfocus/animalhealth/animal-disease-information/avian/avian-influenza/hpai-2022/2022-hpai-commercial-backyard-flocks
U.S. Department of Agriculture. 2023b. Livestock, Dairy, and Poultry Outlook. Washington, DC: USDA Economic Research Service. Available online: https://www.ers.usda.gov/webdocs/outlooks/105645/ldp-m-343.pdf?v=8474.9
U.S. Department of Agriculture. 2023c. Quick Stats. Washington, DC: USDA National Agricultural Statistics Service. Available online: https://quickstats.nass.usda.gov/

