In many ways, farm-direct marketing channels are the simplest and most transparent part of the food system: products go straight from producers to consumers, and money travels back in the other direction. Often these exchanges take on a meaning that far transcends the simple financial transactions. On U-pick operations, consumers become farm laborers as they harvest their own food. In community supported agriculture (CSA), consumers and producers establish season-long contracts with the farmers having the final say on what gets included in the weekly food boxes. Farm stands and farmers’ markets provide consumers with a sense of the people and production processes behind their food.
Despite this aura of simplicity, it remains surprisingly difficult for producers, agricultural professionals, and policymakers to understand what is actually going on in the direct marketing subsector. These knowledge gaps hamper the development of new initiatives, technical assistance, and supportive public policies. In this short article, we present seven data-driven statements about direct marketing, including what is known and what else we need to know. We finish with a brief case study we recently conducted on one of the topics—direct marketing of livestock products—as an illustration of the type of information we suggest should be gathered. Throughout the paper, the terms farm-direct and direct marketing are used interchangeably. More general research reviews for this topic area are provided by Brown (2002) and Brown and Miller (2008).
Farm-direct sales represent less than 1% of all farm gate sales. Timmons and Wang (2010) report that direct market sales grew by an impressive inflation-adjusted 59% in the ten years from 1997 to 2007. Yet using a longer time frame raises questions about how this recent growth should be interpreted. At the national level, no annual farm-direct sales data are collected. The U.S. Department of Agriculture (USDA) Census of Agriculture asked about farm-direct sales in 1982, removed the question in 1987, and reintroduced it in 1992. The 1982 census reported 143,492 farms that direct marketed and total direct market sales of more than $500 million. This represented 6% of all farms and 0.4% of all agricultural sales. Ten years later, in 1992, the number of farms direct marketing had declined to 86,432, fewer than 5% of all farms; total direct market sales had declined to just over $400 million in sales, less than 0.3% of all agricultural sales. During the last 15 years, the number of farms direct marketing has grown to 136,817—still below the 1982 level—and in sales to $1.211 billion. The net result then is that the 2007 percentages are identical to those from 1982. What conditions led to that decline? Will the next ten years continue the growth of the last decade or will farm direct sales decline as they did between 1982 and 1992? All concerned are advised to consider this historical record carefully as plans and policies are constructed for the future.
Although the Census data do not separate out the value of sales that pass through the different direct marketing channels, the common perception is that farmers’ markets are the most important. Before examining the limited amount of data available, we conducted Google News and Google Scholar searches on the terms “farmers’ market,” “community supported agriculture,” “roadside stand,” and “farm stand” on Feb. 9, 2010 to provide an indication of how much attention these marketing channels receive in both popular and academic publications. As expected, farmers’ markets, compared to the other channels, received more than 10 times the mentions in Google News and more than three times in Google Scholar. Community supported agriculture came in second, and the combined totals for roadside stand and farm stand lagged far behind in last place. How do these differences in attention compare to differences in actual gross sales?
The data we were able to collect is limited, but it is our best shot at addressing the question. A study of coupon redemptions for the Oregon 2001 Senior Farmers’ Market Nutrition Program found that 66% were redeemed at farm stands and 33% at farmers’ markets (Saylor, 2003). A survey of agricultural landowners in 15 urban fringe counties around the United States revealed that sales were greater for farm stands than for farmers’ markets in 14 counties and the same in one county. Moreover, landowners in eight of these counties reported farm stand sales more than five times greater than farmers’ market sales (Esseks, et al. 2009). The USDA 2008 Organic Production Survey reported disaggregated direct market sales by specific market channel: 35% of sales from farm stands and U-pick, 28% from farmers’ markets, 15% from CSA farms, and the remaining 22% from other direct market sales (USDA, 2010). The data referenced here are not definitive but point to the strong likelihood that farm stand sales exceed farmers’ market sales. And while many farm stands also sell nonlocal products, these three studies collected data only on the farms’ own sales. We draw two key conclusions. First, the USDA should collect distribution data for specific market channels as done for the 2008 Organic Production Survey. Second, studies, interventions, and policies related to direct marketing must look at multiple distribution channels, not just farmers’ markets; farm stands certainly need more attention.
There are many ways that local foods reach consumers, and it would be useful to understand the relative contribution of farm-direct sales. The scarcity of direct market data is compounded by vague and inconsistent definitions of “local.” Packaged Facts (2007), in one of the few attempts to measure the scope of local food sales, estimated as $5 billion for 2007 but without explaining with any precision either the definition of local or the data collection/analysis process. The USDA Agricultural Census (2007) estimated farm-direct sales at $1.2 billion for 2007. Using these two estimates, we calculate that farm-direct represented about 25% of all local food sales that year. Better data on all the ways local products reach consumers would help inform the many local food initiatives around the country.
This is the reverse of the preceding observation and is included to highlight that farm-direct can extend well beyond any definition of local. The internet has longbeen considered a valuable sales tool for direct marketing. Local Harvest and many other websites can be used to identify and contact producers who will ship—around the country, and even overseas—unique products such as Kona coffee, blood oranges, or bacon from heritage pig breeds. It is rare to come across anything similar to this statement from the Polyface Farms website: “We do not ship anything anywhere. We encourage folks to find their local producers and patronize them” (http://www.polyfacefarms.com/default.aspx). Recognizing that farm-direct includes both local and nonlocal components is crucial for effective design and targeting of appropriate technical assistance and policy interventions.
Julie Guthman (2004) and others have documented that organic agriculture, far from focused on direct or local, now resembles conventional agriculture in terms of production and distribution. The USDA 2008 Organic Production Survey reports that only 7% of organic sales flowed through direct market channels. This 7% far exceeds the 0.4% of all agricultural products that were direct marketed for human consumption in 2007: a far higher percentage of organic products pass through direct markets as compared to nonorganic products. Yet the fact that 93% of organic products are not direct-marketed suggests that as production volumes of differentiated products ramp up, producers look for marketing opportunities other than direct.
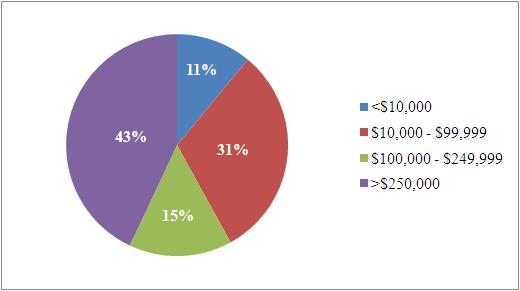
According to USDA Agricultural Census data, direct sales per farm average only $8000 per year. However, this average hides the diversity of farm sizes participating in direct markets. In some respects, small farms dominate, as 59% of the farms reporting direct market sales in the 2007 Census of Agriculture also reported gross sales—from all market channels—of less than $10,000. Of all farms doing some direct marketing, 95% had gross farm sales below $250,000. But another way of looking at the data is to consider how total farm-direct sales are divided among different farm revenue categories (Figure 1).
Very small farms with gross sales below $10,000 account for only 11% of all farm-direct sales revenue while the 5% of farms with more than $250,000 in gross sales account for 43% of all direct sales revenue. We must conclude that the direct market sector includes significant diversity by size of farm and use these data to design and target technical assistance and policies. Yet should assistance and policy focus on the larger farms that probably could most easily expand or on the smaller, more numerous farms?
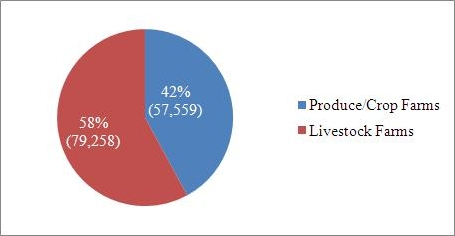
As shown in Figure 2, 58% of the farms that sold farm-direct in 2007 are classified as livestock farms. This is surprising as all of the most visible farm-direct channels (farm stands, farmers’ markets, and CSA farms) are dominated by produce. These livestock transactions appear to occur in other, less noticeable distribution channels. The average direct sales per participating livestock farm of $4,761 are less than one-third the average sales from farms classified as selling produce and other crops. Overall, livestock farms account for only 31% of all direct market sales.
These data beg the question: are these livestock farms generally hobby farms satisfied with low sales, or are they trying to become financially viable? In-depth studies on the supply side would indicate whether and how significant increases of direct marketed livestock products are feasible. Understanding consumer demand and consumer willingness to purchase these products through the range of direct market channels is also essential. Below, we report our recent effort to learn more about one specific direct marketing channel for meat and poultry.
As noted above, livestock farms are well represented among direct marketers. Livestock producers that venture into direct market channels, including farmers’ markets, buying clubs, farm stand, and “on the hoof” live sales, often aim to “avoid the middle man”— typically numerous in conventional meat and poultry production—and keep more of the consumer’s dollar. Data on farm-direct livestock product sales are scarce, though we know that only 3.2% of all U.S. farmers’ market vendors sell meat and/or poultry (USDA, 2006). Farmers’ markets can be attractive because shoppers often pay premium prices and markets provide exposure: a producer can meet potential buyers and build a customer base over time.
Our recent research on the meat and poultry buying habits of farmers’ market shoppers in Oregon revealed several attitudes that hinder meat and poultry sales at these markets: unwillingness to pay more than $1-2 per lb above conventional prices, perceived inconvenience compared with other market fare, and apprehension about the safety of meat and poultry in open air markets. Few people come prepared with coolers or cold-packs, and many do not trust frozen purchases not to spoil on the way home (Gwin and Lev, 2009).
Other than by lowering prices—difficult with high production costs and small production volumes—producers may be able to increase sales by actively encouraging consumers to (a) buy “on the hoof,” by the quarter or side, for less than by-the-cut prices, (b) plan ahead and bring a cooler or cold-packs, and (c) learn to cook less expensive but unfamiliar cuts. However, consumer education takes significant time and resources. In addition, if farmers’ market shoppers—who might be more sympathetic to buying meat and poultry at open air markets—are squeamish, this method of buying may remain fairly limited.
Fortunately, other direct marketing options for meat and poultry appear viable, though hard data are lacking. Most CSAs still focus on produce, though many offer meat and poultry as “add-ons” (Woods, et al. 2009). Popular media attention (Jackson, 2009) suggests rising interest, at least in some regions, in buying meat by the quarter or half carcass. We have observed rising interest around the country in meat and poultry buying clubs but lack data on numbers of active clubs, volumes of product sold, and sales revenues. Of direct-market options, these clubs may be able to reach the greatest number of consumers by offering bundles of mixed cuts (e.g. both steaks and burger), in two or three bundle sizes. This helps producers sell the whole animal and is easier for customers than investing in a chest freezer to buy a side of beef.
Our study illustrates both the significant challenges of direct marketing a particular type of product through a particular market channel and also the type of data that can help us provide more effective technical assistance. And, to reiterate, more data about all direct marketing options is clearly needed.
To conclude, we return to our main theme: as evidenced by our seven points, and in part by the case study, direct marketing of agricultural products is not well understood. Improved knowledge about the full range of direct market channels, products that flow through them, product- and channel-specific limitations on expansion, and the types of farms participating will be of great value in developing and delivering new direct marketing initiatives, technical assistance, and supportive public policies.
Brown, A. (2002). Farmers’ market research 1940–2000: An inventory and review. American Journal of Alternative Agriculture, 17(4), 167-76.
Brown C., and Miller, S. (2008). The impacts of local markets: A review of research on farmers’ markets and community supported agriculture (CSA). American Journal of Agricultural Economics, 90(5): 1296-1302.
Esseks, D., Oberholzer, L., Clancy, K., Lapping, M., and Zurbrugg, A. (2009). Sustaining agriculture in urbanizing counties: Insights from 15 coordinated case studies. Lincoln, Neb: University of Nebraska-Lincoln. Available online: http://www.farmlandinfo.org
/farmland_preservation_literature/index.cfm?function=article_view&
articleID=37504.
Guthman, J. (2004). Agrarian Dreams. Berkeley, Calif.: University of California Press.
Gwin, L., and Lev, L. (2009). Meat and Poultry Buying at Farmers’ Markets: A Survey of Shoppers at Four Markets in Oregon Corvallis, Ore. Oregon State University Small Farms Technical Paper #23. Available by paying requested fee online: http://smallfarms.oregonstate.edu/oregon-small-farms-technical-reports
Jackson, E. (2009, Sept. 8). Home from the range. The Oregonian, available online: http://www.oregonlive.com/foodday/index.ssf/2009/09
/this_is_the_local_meats_story.html
Packaged Facts. (2007). Fresh and local foods in the U. S. Rockville, Md.
Saylor, K. (2003). Reconnecting seniors to the local food system: Evaluation of the 2001 Oregon senior farmers’ market nutrition program. Corvallis, Ore. Department of Anthropology, Oregon State University, M.S. Thesis.
Timmons. D., and Wang, Q. (2010). Direct food sales in the United States: Evidence from state and county-level data. Journal of Sustainable Agriculture, 34(2): 229-240.
United States Department of Agriculture Agricultural Marketing Service. (2009). National Farmers’ Market Manager Survey 2006. Available online: http://www.ams.usda.gov/AMSv1.0/getfile?dDocName=STELPRDC5077203&acct=wdmgeninfo.
United States Department of Agriculture National Agricultural Statistical Service. (2010). 2008 Organic Production Survey. Available online: http://www.agcensus.usda.gov/index.asp.
United States Department of Agriculture National Agricultural Statistical Service. (Multiple years). The Census of Agriculture. Available online: http://www.agcensus.usda.gov/index.asp.
Woods, T., Ernst, M., Ernst, S., and Wright, N. (2009). 2009 survey of community supported agriculture producers. Agricultural Economics Extension Series 2009-11. Lexington, Ky. University of Kentucky Cooperative Extension Service. Available online: http://swroc.cfans.umn.edu/organic/csasurvey.pdf.