

Many commentators—including prominent economists, nutritionists, journalists, and politicians—have claimed that American farm subsidies have contributed significantly to the “obesity epidemic” by making fattening foods relatively cheap and abundant, and that reducing these subsidies will go a long way towards solving the problem. These commentators often treat the issue as self-evident, and do not present either details on the mechanism by which farm subsidies are supposed to affect obesity, or evidence about the size of the likely impact. In this article we examine the consequences of U.S. farm subsidies—including indirect subsidies provided by trade barriers as well as direct subsidies—for prices of farm commodities and thus food products and caloric consumption patterns in the United States. We show that U.S. farm subsidies have had generally modest and mixed effects on prices and quantities of farm commodities, with negligible effects on the prices paid by consumers for food and thus negligible influence on dietary patterns and obesity. This result is consistent with some previous work by economists on the issue (see Alston, Sumner, and Vosti, 2008 and the papers they cite), but contradicts the mainstream view in the media.
A simplistic model of farm subsidies and obesity, which is implicit in some writings on the subject, presumes a textbook subsidy policy that results in an increase in both production and consumption of the subsidized good by increasing the net return to producers—the market price plus the subsidy—and lowering the market price paid by consumers. However, the main elements of U.S. farm subsidy programs are significantly different from simplistic textbook subsidy policies.
Farm subsidies have resulted in lower U.S. prices of some commodities, such as food grains or feed grains, and consequently lower costs of producing breakfast cereal, bread, or livestock products. But in these cases, the price depressing—and consumption enhancing—effect of subsidies has been contained, or even reversed, by the imposition of additional policies such as acreage set-asides that restricted acreage or production. So the effects of the subsidy on quantities produced and consumed, and consumer prices, are smaller than the textbook model would suggest.
In addition, for more than a decade, about half of the total subsidy payments have provided limited incentives to increase production because the amounts paid to producers were based on past acreage and yields rather than current production. Moreover, for the commodities that are subject to U.S. import barriers, the policy increases farm and food prices domestically, and provides a disincentive to consume foods that use these commodities as ingredients. Trade barriers that apply to imported sugar, dairy, orange juice, and beef increase the prices of these agricultural commodities, and thereby increase the cost and discourage consumption of foods that use these commodities.
The combination of subsidies for some commodities and trade barriers for others makes the story complicated at times. A case in point is the market for caloric sweeteners. Corn is often the target of criticism as a contributor to obesity, especially because of its use in production of high fructose corn syrup (HFCS), which is used as a caloric sweetener in many foods and beverages. Farm subsidies are responsible for the growth in the use of corn to produce high fructose corn syrup (HFCS) as a caloric sweetener, but not in the way it is often suggested. The culprit here is not corn subsidies; rather, it is sugar policy that has restricted imports, driven up the U.S. price of sugar, and encouraged consumers and food manufacturers to replace sugar with alternative caloric sweeteners, especially HFCS. Combining the sugar policy with the corn policy, the net effect of farm subsidies has been to increase the price of caloric sweeteners generally, and to discourage total consumption while causing a shift in sweetener use between sugar and HFCS (Beghin and Jensen, 2008).
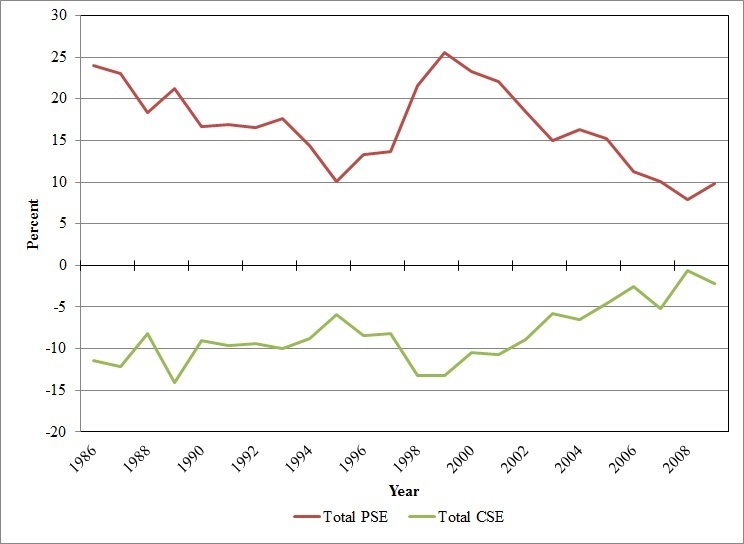
Producer Support Estimates (PSEs) are often used to represent agricultural support as a share of the total value of agricultural production, and Consumer Support Estimates (CSEs) represent the support provided to food consumers as a share of the total value of food commodity consumption. Calculated values for total PSEs and CSEs in the United States between 1986 and 2009 are shown in Figure 1. These PSEs and CSEs are not perfect measures of the effects of farm policies, but they are commonly used by agricultural economists to summarize the support applied to farm commodities. The policies represented in these measures include hundreds of specific provisions under farm bill programs and trade barriers that raise U.S. farm prices and incomes for producers of favored commodities, either through transfers from taxpayers, or at the expense of consumers, or both. Farm subsidies that encourage agricultural production may lead to lower relative prices and increased consumption, but trade barriers—like U.S. policies for sugar, dairy, orange juice, and beef—make agricultural commodities more expensive, increase the cost of certain food products, and if anything discourage consumption of foods that use these commodities. The PSEs and CSEs in Figure 1 show that while U.S. farm policy has, overall, subsidized farm commodity producers it has taxed food consumers relative to world market prices. Figure 1 also shows that subsidies for producers and taxes on food consumers related to farm policies fell between 1986 and 2009.
However, some U.S. farm subsidy policies also affect world market prices, and a more complete measure of the effect of farm policies on consumer prices has to take these effects into account. Economists have modeled and projected the likely economic consequences of U.S. farm subsidies for prices and production. Work in this area has found that eliminating existing farm programs would have very modest effects on farm prices and production of the main farm commodities. Alston, Sumner, and Vosti (2008), for instance, reported estimates indicating that the removal of U.S. farm policy in the mid 2000s would have yielded only modest reductions in grain and oilseed production and prices, ranging between 5% and 10%. Only sugar and rice would have experienced a reduction in production of more than 10%, and only sugar would have seen a price change of more than 10%. These modest impacts were based on simulations beginning with relatively large market distortions before subsidy rates fell with the recent increases in commodity market prices. The effects would be even smaller if policies were eliminated today. An important point is that removing U.S. farm policy would have mixed effects on commodity prices. Elimination of farm subsidies would result in increases in prices only for wheat and corn. For every other commodity category the net effect of eliminating subsidies would be to reduce prices, encouraging the consumption of meat and dairy products, fruits and vegetables, and sugar, with mixed implications for nutritional outcomes.
We used results from previous studies combined with information about commodity-specific CSEs to estimate the likely changes in prices of farm commodities given the removal of U.S. farm subsidies, including indirect subsidies provided by border measures. Then we used these estimates of farm commodity price impacts in a simulation model of the supply chain to calculate the implied changes in caloric consumption of ten categories of food and beverage products.
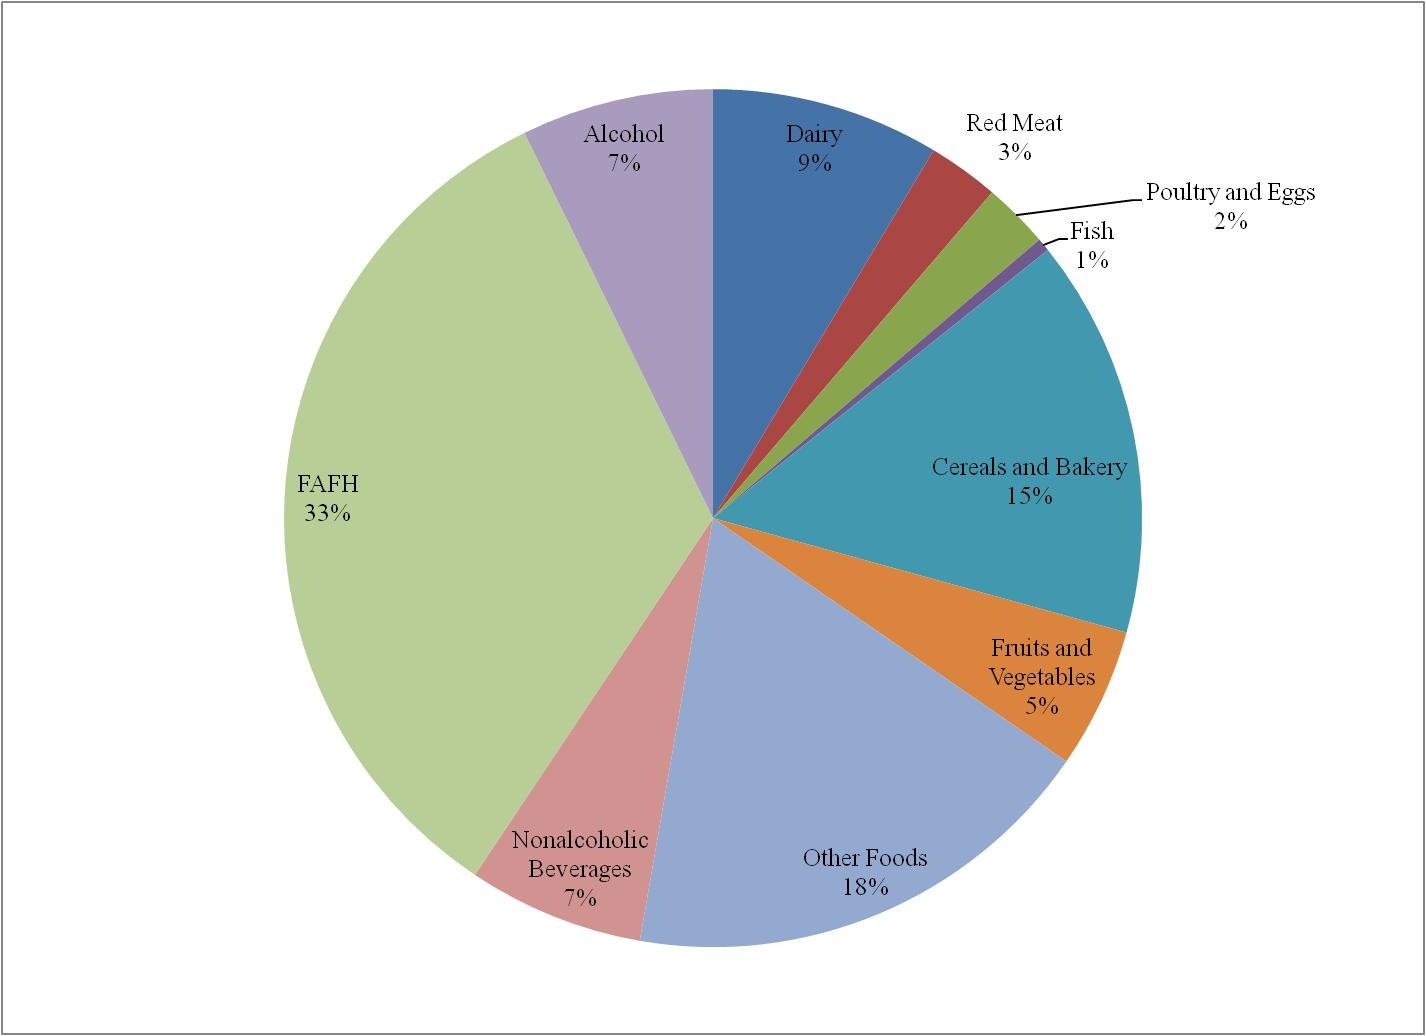
Farm commodities used as ingredients represent a small share of the total cost of retail food products, and this share has been shrinking for all farm commodities over the past three decades (USDA-ERS, 2008). On average the farm commodity cost share is approximately 20%, but it varies widely: for grains, sugar, and oilseeds, it is less than 10%; for soda, a food product that is often associated with obesity, the share is approximately 2%; for retail fruit and vegetable products—fresh and processed—it is approximately 18%; and it is closer to 35% for meat and eggs. In the U.S., food consumed away from home accounts for nearly 37% of food expenditures and 33% of average daily calories (Figure 2), but the cost of farm commodities as a share of the value of foods consumed in this category is tiny.
The small farm commodity shares of food costs mean that small commodity price impacts from removal of farm policy would lead to very small effects on consumer costs of food and beverages, especially for some of the categories most commonly associated with obesity. In addition, if such changes in the costs of food products were not fully passed on to consumers, they would see even smaller percentage changes in retail food prices.
We calculated changes in retail prices associated with the removal of farm subsidies for ten food product categories using simulated changes in commodity prices together with recent farm-retail marketing margins. The mechanisms are complex because some food items use multiple commodities and some commodities, such as feed grains, themselves are inputs into other farm products. For example, the retail cost of meat and dairy products would increase because the removal of subsidies would increase the cost of corn. The farm cost of livestock represents only about one-fifth of the retail cost of meat. Hence, assuming corn and other feedstuff represent about 30% of the farm cost of meat and dairy items, a 5% increase in the farm price of corn would imply a 1.5% increase in the farm cost and a 0.3% increase in the retail price of meat for consumers. Similar calculations apply for other retail foods, with the multipliers from farm commodity prices to retail prices varying with the farm-commodity share of the consumer food dollar.
We used an equilibrium displacement model (Okrent, 2010) to simulate the effects of farm subsidies applied to eleven agricultural commodity categories (Table 1) on caloric intake patterns of 10 categories of food products. The food products include eight exhaustive categories of food-at-home products—cereals and bakery products, red meat, poultry and eggs, fish and seafood, dairy products, fruits and vegetables, nonalcoholic beverages, other foods including fats and oils, and sugars and sweeteners: a composite food-away-from-home product; and alcoholic beverages. Four simulation experiments were performed to better understand how various policy changes would affect commodity prices, food prices, food consumption, and ultimately annual per capita caloric intake. We first simulated the effects of removing only grain subsidies, based on published measures of policy price impacts consistent with policies in the mid-2000s. The other three simulations show the effects of removing all U.S. farm subsidies, including indirect subsidies provided by trade barriers that have applied in different time periods—with price impacts based on the published measures plus CSEs for different time periods—along with the measures of grain subsidy impacts on prices used in the first simulation. One set of simulations is based on CSEs in 2006, a reasonably representative recent year just before the spike in commodity prices after which CSEs have been relatively low. The other two simulations are based on CSEs for the previous 10 years and the previous 21 years. The percentage changes in farm commodity prices for each of the four simulations are given in Table 1, along with key findings.
Our results indicate U.S. farm subsidy policies, for the most part, have not made food commodities significantly cheaper and have not had a significant effect on caloric consumption. Eliminating U.S. grain subsidies alone would lead to a small decrease in annual per capita caloric consumption—simulated to be 977 calories per adult per year, which would imply a 0.16% per year reduction in average body weight assuming 3,500 calories per pound. In contrast, removing all farm subsidies, including those provided indirectly by trade barriers, would lead to an increase in annual per capita consumption in the range of 200 to 1,900 calories—equivalent to an increase in body weight of 0.03% to 0.30%, depending on the size of the policy-induced price wedges to be removed, as represented by the CSEs. The CSEs were generally smaller in 2006 than over the decade 2000–2009 and more than over the longer period 1989–2009. Thus the smaller estimates, based on the 2006 CSEs, are probably the most relevant.
As our results show, the measured economic effects of a simulated policy reform depend on specific characteristics of the analysis:
In estimating price impacts we assumed that the impact of policy change would be transmitted entirely to consumers. In this sense our estimates are at the high end of the feasible range. Nevertheless, our simulated results show fairly small positive or negative impacts on total caloric consumption and thus potentially on obesity. This result holds even when we allow for comparatively large policy impacts on buyer prices of farm commodities, with the sign and size of the effect contingent on whether it is assumed that import barriers that raise the buyer prices of dairy, sugar, and fruits and vegetables are to be eliminated along with subsidies on grains.
A careful examination of the linkages between farm policy, food prices, and obesity in the United States demonstrates that U.S. farm commodity subsidy policies have had very small effects on obesity. This finding is driven by three key factors. First, with a few exceptions, farm subsidies have relatively small and mixed impacts on prices of farm commodities in the United States. Second, the share of the cost of commodities in the cost of retail food products is small, and continues to shrink over time. Third, food consumption patterns do not change substantially in response to small changes in food prices.
Our specific simulation results across a range of scenarios show that the impact of farm policy is small and mixed, such that the net effects are ambiguous. Eliminating all farm subsidy policies, including trade barriers, would decrease consumption of some food products, but would increase consumption of other food products, most likely leading to an increase in overall caloric consumption. In other words, contrary to common claims in the popular media, farm policies have more likely slowed the rise in obesity in the United States—but any such effects are small. Compared with other factors, the policy-induced differences in relative prices among various farm commodities have played only a tiny role in determining excess food consumption and obesity in the United States.
Farm commodities have indeed become much more abundant and cheaper over the past 50 years in the world as a whole as well as in the United States, but not because of subsidies. This abundance mainly reflects the effects of technological innovations and increases in farm productivity, which has alleviated hunger and poverty throughout the world while at the same time reducing pressure on the world’s natural resources. If cheaper and more abundant food has contributed to obesity, then we should look to innovations in production agriculture rather than farm subsidies as the fundamental cause. Even so, it would be a mistake to seek to oppose and slow agricultural innovation with a view to reducing obesity rates. Conversely, though it might be beneficial in other ways, eliminating U.S. farm subsidies would have negligible consequences for obesity rates. The challenge for policy makers is to find other—more effective and more economically rational—ways to reduce the social consequences of excess food consumption, while at the same time enhancing consumption opportunities for the poor and protecting the world’s resources for future generations.
Alston, J.M., Sumner, D.A., and Vosti, S.A. (2008). Farm subsidies and obesity in the United States: National evidence and international comparisons. Food Policy, 33(6), 470-479.
Beghin, J., and H.H. Jensen. (2008). Farm policies and added sugars in US diets. Food Policy, 33 (6), 480-488.
Centers for Disease Control and Prevention (CDC). (2010). National Health and Nutrition Examination Survey Data (NHANES), 2005-2006. Available online: http://www.cdc.gov/nchs/nhanes/nhanes_questionnaires.htm.
Okrent, A. (2010). The effects of farm commodity and retail food policies on obesity and economic welfare in the United States. Doctoral dissertation. University of California, Davis.
Organisation for Economic Co-operation and Development (OECD). (2010). Producer and consumer support estimates. OECD Database 1986-2009. Paris, France. Available online: http://www.oecd.org/document/59/
0,3343,en_2649_33797_39551355_1_1_1_37401,00.html.
United States Department of Agriculture, Economic Research Service (USDA-ERS). (2008). Agricultural Outlook: Table 8. Farm-Retail Price Spreads. Available online: http://www.ers.usda.gov/publications/agoutlook/aotables/.
| Policy Simulated | |||||
| Elimination of grain subsidies | Elimination of grains subsidies and trade barriers based on CSEs in selected years | ||||
| 2006 | 2000-2009 | 1989-2009 | |||
| Percentage Farm Commodity Price Change | |||||
| Oil-bearing crops | 0 | 0 | 0 | 0 | |
| Grain crops | 8.4 | 8.4 | 8.4 | 8.4 | |
| Vegetables and melons | 0 | -5.0 | -5.0 | -5.0 | |
| Fruits and tree nuts | 0 | -5.0 | -5.0 | -5.0 | |
| Sugar cane and beets | 0 | -31.0 | -54.2 | -55.7 | |
| Other crops | 0 | 0 | 0 | 0 | |
| Beef cattle | 2.9 | 2.9 | 2.9 | 2.9 | |
| Hogs & other meat animals | 2.9 | 2.9 | 2.9 | 2.9 | |
| Dairy cattle | 2.9 | -9.6 | -25.0 | -31.8 | |
| Poultry and eggs | 4.8 | 4.8 | 4.8 | 4.8 | |
| Fish and aquaculture | 0 | 0 | 0 | 0 | |
| Annual Impacts on Per Capita Caloric Consumption and Weight | |||||
| Consumption (kcal) | -977 | 198 | 1,374 | 1,884 | |
| Weight (kg) | -0.13 | 0.03 | 0.18 | 0.24 | |
| Weight (%) | -0.16 | 0.03 | 0.22 | 0.30 | |
Note: Average weight of an adult individual in 2005-2006 NHANES was 80.95 kg. The calculation assumes 3,500 kcals additional consumption would add one pound to weight.
Primary financial support for the work in this article was provided by National Research Initiative Grant 2006-55215-16720 from the USDA National Institute for Food and Agriculture. Additional support was provided by the USDA Economic Research Service through a cooperative research project (Agreement 58-3000-8-013) and by a mini-grant from the Giannini Foundation of Agricultural Economics.