

World–wide expansion in the production of biofuels is currently one of the hot topics on the agenda of agricultural and food research. On the one hand the development is welcomed as an additional source of income for farmers on otherwise saturated markets for agri–food products. One the other hand, however, there are growing concerns that with biofuels the level and volatility of agricultural world prices which are now linked to the development of the crude oil price will increase further. A few papers study the causes of the current increase in prices and contribution of biofuels (see e.g. Von Braun, 2008; Banse, Nowicki, 2008; OECD–FAO, 2008; Trostle, 2008).
For the European Union (EU) the driver in biofuel production is mainly political, including tax exemptions, investment subsidies and obligatory blending of biofuels with fuels derived from mineral oil. Increasing biofuel production either due to ‘pure’ market forces and/or ‘policy’ has significant impacts on agricultural markets, including the trade in agricultural raw materials. Linkages between food and energy production include the competition for land, but also for other production inputs. For instance, the effect of an increasing supply of by–products of biofuel production such as oil cake and gluten feed also affects animal production.
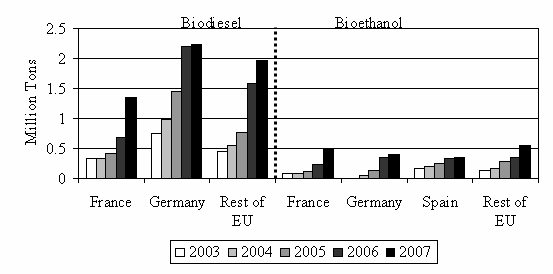
European biofuel production is based more on biodiesel production compared to ethanol production. At the current level biodiesel accounts for more than 6.0 million t while ethanol production in Europe is about 3.0 million t. Almost half of the EU biodiesel is produced in Germany where it was stimulated by tax exemptions, Figure 1. In the European Union in 2004, about 0.4% of the EU cereal and 0.8% of the EU sugar beet production was used for bioethanol, and more than 20% of oilseed production was processed into biodiesel. The annual growth rate between 2005 and 2007 was 53% and 44% for bioethanol and biodiesel, respectively, see F.O. Licht (2007).
Biofuels are just one element in the complex EU strategy to meet the future energy demand. The EU Biofuels Directive presented by the EU Commission in 2003, set out indicative targets for Member States. To help meet the 2010 target—a 5.75% market share for biofuels in the overall transport fuel supply—the EU Commission has adopted an EU Strategy for Biofuels. The ‘European Union Biofuel Strategy’ (European Commission, 2003) and the ’Renewable Energy Road Map’ (European Commission, 2008) propose an overall binding target of 20% renewable energy by 2020 and a 10% biofuels target by 2020.
These goals are not yet mandatory, but this might be changed and a discussion about higher shares in the future is ongoing. These measures were accompanied by measures giving additional leeway to member states for tax exemptions in favor of biofuel. Germany, for example, subsequently made use of the full tax exemption which has been a key determinant for the remarkable growth of its biofuel use. The German tax exemption stopped at the beginning of 2007. We did not take this elimination of the tax exemption into account in our baseline. However, the impact of that elimination was a clear decline in the use of biofuels in Germany. This example underpins the importance of policy measures to enhance biofuel consumption in the EU. Most of the EU member states are far from reaching the target of 5.75% in 2010 with a current average use of biofuels in transport of around 1.5%.
However, in many EU member states the biofuel shares for transportation purposes increased during recent years. This development can be explained by the above mentioned introduction of tax exemptions for renewable energies but also by an increase in oil prices which changes the relative prices in favor of biofuels. This endogenous growth can be expected to continue under a continuously increasing price for fossil fuels. However, the question to be considered is whether the objective can be reached in 2010.
To analyze the impact of enhanced use of biofuels as the consequence of the EU Biofuels Directive requires an analytical tool which considers not only the agricultural but also the energy markets. Within the last two years many existing models focusing on agriculture and food processing have been extended to represent the production and consumption of biofuels. All results show that a shift in demand for agricultural products as a consequence of increasing biofuel demand leads to substantially increased agricultural market prices and increased land use. However, whether this increase in production takes place within or outside the EU depends on the underlying assumptions on the degree of openness of the EU. Therefore, two different baseline scenarios have been calculated up to 2020 which describe different visions of the future. This analysis is part of the EUruralis project (Wageningen UR and Netherlands Environmental Assessment Agency, 2007). A detailed description about the background, definition and set-up of the Eururalis scenarios can be found in (Westhoek, van den Berg et al. 2006) and the quantification of the scenarios are described in (Eickhout and Prins 2008). The scenarios have been calculated with the LEITAP model which is an extended GTAP model. The ‘Global Economy’ scenario depicts a world with fewer borders and regulation compared with today. Trade barriers are removed and there is an open flow of capital, people and goods, leading to a rapid economic growth, from which many (but not all) individuals and countries benefit.
The other vision, called ‘Regional Communities’ depicts a world of regions with people having a strong focus on their local and regional community and prefer locally produced food. Economic growth is lower compared to the ‘Global Economy’ scenario. Furthermore under the ‘Regional Communities’ scenario it is assumed that agricultural subsidy increases of some 10%, linked to environmental and social targets and export subsidies, are eliminated. Import barriers remain in place to protect local markets against cheap imports while imported goods have to comply with high EU standards regarding health, environment, and animal welfare.
For both scenarios two simulations with and without mandatory blending for biofuel use have been calculated. Even without mandatory blending, the use of biofuel crops changes due to shifts in relative prices (biofuel crops vs. fossil fuel).
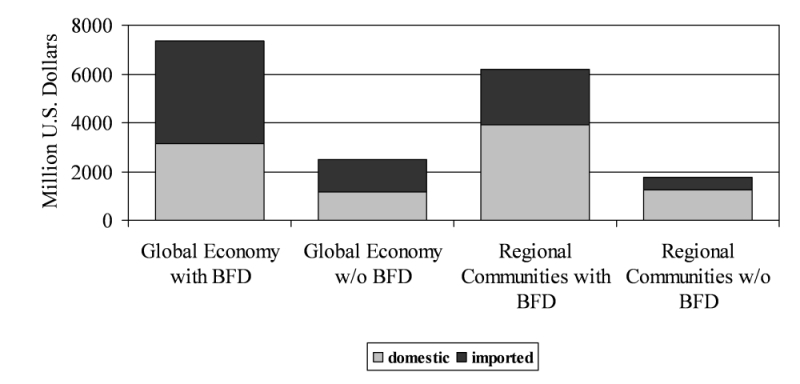
Ambitious goals have been set by the EU Biofuel Directive (BFD) for the transport sector: the minimum share of biomass or other renewable transport fuels must be 2% in 2005 and 5.75% in 2010. For 2020 the EU target has been put at 10% under the condition that the so–called second generation biofuel technology will be available then. Currently bio–energy is coming from both waste material and growing first generation biofuel crops. To meet the ambitious future targets large scale production of crops used specifically for biofuel production in Europe will be necessary. In the ‘Global Economy with BFD’ scenario the demand for such biofuel crops used in the petrol sector will be $7.3 billion U.S. dollars (USD) (in 2001 values). Around 42% of these inputs will be produced domestically and 58% of biofuel crops used in the petrol sector will come from imports.
If mandatory blending is not enforced, the use of biofuel crops is much lower in all scenarios; only $2.5 billion USD under the ‘Global Economy’ scenario and only $1.7 billion USD under the ‘Regional Communities’ scenario. The lower demand under ‘Regional Communities’ is due to a smaller increase in income compared to the ‘Global Economy’ scenario. The degree of openness under both scenarios is also reflected in this figure. Under the ‘Global Economy’ scenario without mandatory blending, the share in imported biofuel crops used for biofuel production is 53.5% while under the higher protection under the ‘Regional community’ scenario imported biofuel crops contribute only by 28.5% to total biofuel production.
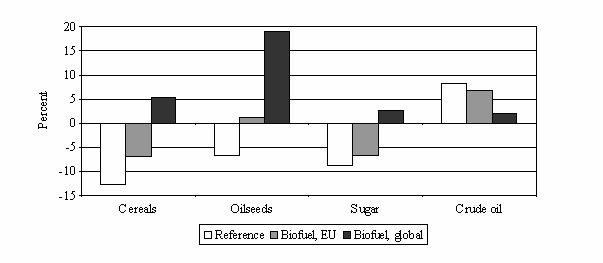
With these strong changes in import demand world prices for biofuel crops are affected by EU policies. The impact of the EU biofuel policies on world prices is illustrated in the following figure. With an enhanced biofuel consumption as a consequence of the EU biofuel directive prices of agricultural products tends to increase. Banse, van Meijl and Woltjer (2008) show that under a scenario ‘Biofuel, global’ which includes biofuel policies in the United States, Canada, South Africa, Japan, Korea and Brazil the real price of oilseeds shows an increase of 26% in contrast to the long–term trend projected in the reference scenario, see Figure 3. The mandatory targets in the scenario ‘Biofuel, global’ are set in the EU and in other countries. Based on IEA (2008), we assume a 10% blending target for the United States, Canada, Japan and South Africa. In IEA (2008), a 25% blending target for Brazil is also indicated. Compared to the United States and Brazil, where ethanol consumption dominates the biofuel sector, EU biofuel is based on bio–diesel, which is reflected by the increase in prices of the bio–based inputs in the production of biofuels. The increase in world prices for cereals is more than 18% under the ‘Biofuel, global’ scenario. The increase in crude oil price is smaller under the ‘Biofuel, global’ scenario as demand for crude oil diminishes due to the introduction of the BFD.
Without mandatory blending, real world prices for agricultural products decline and confirm their long–term trend, see Figure 3. This is caused by an inelastic demand for food in combination with a high level of productivity growth. Under an EU mandatory blending target the oilseed sector has the highest price difference, because biofuels in EU transport are dominated by biodiesel from oilseeds.
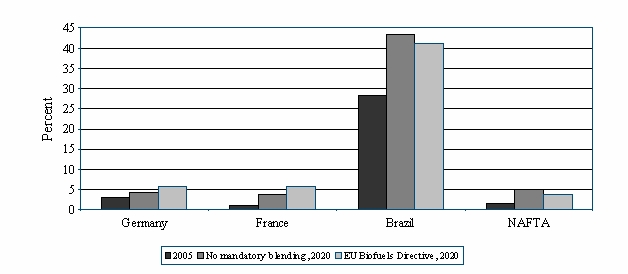
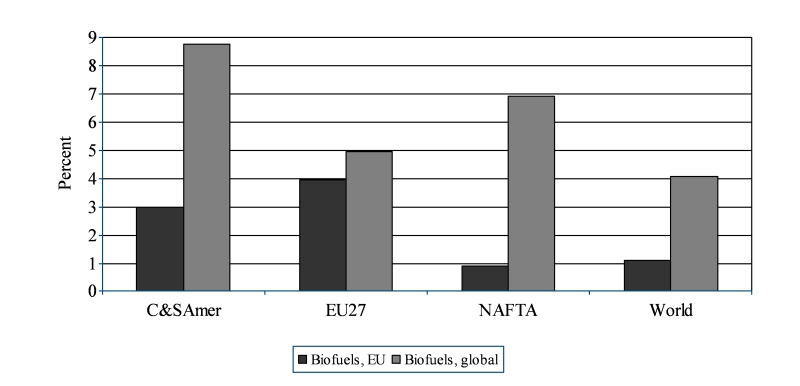
Even without enforced use of biofuel crops through mandatory blending, the share of biofuels in fuel consumption for transportation purposes increase, see Figure 4. This endogenous increase in biofuel production is due to the fact that the ratio between crude oil price and prices for biofuel crops changes in favor of biofuel crops (see Figure 3). The highest increase is in the already integrated market of Brazil where the initial 2005 share of more than 29% expands to more than 42% in 2010. In Germany and France the endogenous growth of biofuel share leads to biofuel consumption for transportation in 2010 of 4.0% in Germany and 3.4% in France. These results reveal that without mandatory blending the 5.75% biofuel share will not be reached in the EU member states.
With mandatory blending the EU member states fulfill the required targets of 5.75% at the expense of non–European countries, Figure 4. Under the BFD scenario the share of biofuel use declines in Brazil by around 6%. Under the ‘EU Biofuels Directive’ scenario the biofuel share in petrol used for transportation decreases by more than 20% in the North American Free Trade Agreement (NAFTA) countries. This decline in biofuel production in non–European countries is due to the increase in relative prices between biofuel crops and crude oil.
The enhanced demand for biofuel crops in the EU under the BFD scenarios leads to an increase in world prices for these products and hence to a decline in the profitability in fuel production compared to crude oil. However, the increase in biofuel crop demand in the EU over–compensates the decline in non–EU countries and at a global level the use of biofuel crops for fuel production increases under the BFD scenario. A good indicator for this development is the decline in crude oil price under the BFD scenario compared with reference scenario, see Figure 3.
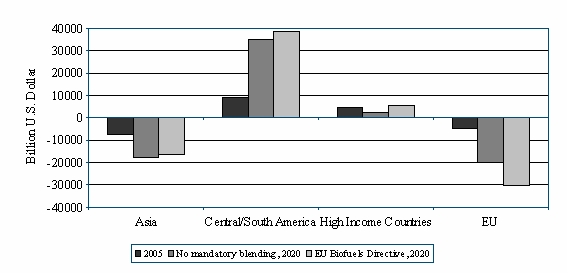
Figure 5 shows that the EU will increase its trade deficit in agricultural commodities used for the production of biofuels under the biofuel scenarios. South and Central America as well as other high income countries expand their net–exports in agricultural products for biofuel production.
Compared to world income growth, the annual growth rates of agricultural production are quite moderate in the reference scenario. In the EU and in the region of high income countries, production of biofuel crops is also negatively affected by the liberalization which is also implemented in both scenarios. At the aggregated level, total agricultural production increases in both the reference and policy scenario. In all regions, mandatory blending also leads to an increase in total agricultural output. EU biofuel policies have a strong impact on agricultural production inside the EU but also on agricultural output in South and Central America. Without mandatory blending, EU oilseed production increases by 7.6% compared to 26% under a mandatory blending scenario.
These production developments lead to a similar pattern of land use developments (Figure 6). Land use increases in all regions when comparing the impact of the EU Biofuels Directive and biofuel policies outside Europe. This expansion of agricultural land use on a global scale and especially in Southern America might lead to a decline in biodiversity in these countries as land use is an important driver for biodiversity.
The mandatory blending requirement for the petrol sector implies an increase in petrol price because biofuels are more expensive than crude oil. To meet the 5.75% obligations in 2010, the petrol price will rise by 2%, and a 6% petrol price increase accompanies the 10% BFD target in 2020. The subsidies on biofuel crops in the petroleum sector, which are required to meet the targets by making feedstock competitive with crude oil, are high and range from 30% in Sweden to almost 60% in the UK in 2020. These additional subsidies indicate the difficulties that most EU member states will have in trying to meet the BFD targets.
The analysis shows that enhanced demand for biofuel crops has a strong impact on agriculture at the global and European level. Biofuel policies contribute to the current rise in world food prices, especially for those products which are in direct competition in final consumption for food and fuel, e.g. corn, sugar and oilseeds. With increased biofuel consumption, the long term trend of declining real world prices of agricultural products slows down or might even be reversed for the feedstocks used for biofuels. This positive effect on world agricultural prices has consequences especially for poor urban populations in low–income countries with food and energy deficits. Those consumers will suffer most in any sudden or rapid price shift for basic commodities, of which foremost is food.
In principle, higher agricultural prices provide additional income opportunities for farmers. As shown in this article, the incentive to increase production in the EU will tend to increase land prices and farm income in the EU and other regions. The EU will not be able to produce the feed stocks needed to produce the biofuels according to the BFD domestically and will run into a higher agricultural trade deficit. Biofuel crop production expands in other highly industrialized countries and especially in South and Central America (Brazil). Whether farmers in developing countries will benefit from higher prices of crops used for biofuel production remains questionable and depends on the degree of integration of regions in global food markets.
Apart from income effects, the environmental effects of higher biofuel production are also not clear, (see e.g. Searchinger et al. 2008). These biofuel crops need scarce resources such as land, water and agricultural inputs like fertilizers. This will impact the environment—CO2 balance, soil erosion, and biodiversity. The GHG balance of biofuels varies dramatically depending on such factors as feedstock choice (lowest for corn and wheat and highest for switchgrass and poplar), associated land use changes, feedstock production system, and the type of processing energy used.
The results presented here depend heavily on the level of crude oil price. The higher the crude oil price the more competitive biofuel crops become versus petroleum production. Therefore, biofuels create a more direct link between food and fuel prices. High feedstock prices make biofuels less profitable, as does a low oil price. Even at the current level of crude oil prices of $120 USD per barrel, almost no biofuels are economically viable without support policies. A low oil price implies that biofuels will be produced only under mandates or that they are heavily subsidized.
Without mandatory blending to stimulate the use of biofuel crops in the petroleum sector the targets of the EU Biofuel directive will not the reached. Mandatory blending leads to higher petrol prices as feedstocks are not profitable to use in fuel production given the current technologies. The increased demand for feedstock raises their price relative to the oil price and adds to the challenge of making biofuels competitive. Therefore, if biofuels have to be competitive in the long run, investments in R&D are needed to obtain higher yields or better conversion technologies. Decisions on R&D investments should take into account the second generation biofuels as these promise to be more cost–effective and more effective in reducing greenhouse gas emissions. However, the current high food prices in combination with the disputed environmental benefits fuel the debate inside the EU whether the Biofuels Directive is desired at all or whether the target of the Biofuels Directive should be made dependent on the degree of technical progress (first and second generation), environmental benefits and impact on world prices.
Banse, M., H. van Meijl, A. Tabeau and G. Woltjer (2008a). Will EU Biofuel Policies affect Global Agricultural Markets? European Review of Agricultural Economics, 35, 117–141.
Banse, M., H. van Meijl and G. Woltjer (2008b). The Impact of First Generation Biofuels on Global Agricultural Production, Trade and Land Use. Paper presented at the 12th EAAE Conference. 26–29 August 2008, Gent, Belgium.
Banse, M., P. Nowicki, and H. van Meijl (2008c). Why are current world food prices so high? LEI report 2008–40. The Hague.
Eickhout, B. and A.G. Prins (2008). Eururalis 2.0. Technical background and indicator documentation. Bilthoven. The Netherlands, Wageningen University and Research and Netherlands Environmental Assessment Agency (MNP).
European Commission (2003). Directive 2003/30/EC on the Promotion of the Use of Biofuels or Other Renewable Fuels for Transport. OJ L 123, 17.5.2003. European Commission: Brussels.
European Commission (2008). 20 20 by 2020. Europe's climate change opportunity Communication from the Commission to the European Parliament, the Council, the European Economic and Social Committee and the Committee of the Regions. COM(2008) 30 final. 23.01.2008. European Commission: Brussels.
F.O. Licht (2007). Licht Interactive Data.
OECD–FAO (2008). Agricultural Outlook 2008–2017, Paris, Rome.
Trostle, R. (2008). Global Agricultural Supply and Demand: Factors Contributing to the Recent Increase in Food Commodity Prices. ERS/USDA. WRS–0801 May 2008. Washington D.C.
Searchinger, R. Heimlich, R.A. Houghton, F. Dong, A. Elobeid, J. Fabiosa, S. Tokgoz, D. Hayes, T. Yu, (2008). Use of U.S. Croplands for Biofuels Increased Greenhouse Gases Through Land–use change, Science Express (Feb. 7, 2008).
Von Braun, J. et al. (2008). High Food Prices: The What, Who, and How of Proposed Policy Actions. IFPRI Policy Brief, May 2008. Washington D.C.
Wageningen UR and Netherlands Environmental Assessment Agency (2007). Eururalis 2.0. A Scenario Study on Europe’s Rural Areas to Support Policy Discussion. Eururalis: http://www.eururalis.eu.
Westhoek, H. J., M. van den Berg and J.A. Bakkes (2006). Scenario development to explore the future of Europe's rural areas. Agriculture, Ecosystems & Environment 114(1), 7–20.
|
2003
|
2004
|
2005
|
|
|
|
Member State Biofuel share
|
National Indicative Target
|
|
|
Austria
|
0.06
|
0.06
|
2.50
|
|
Belgium
|
0.00
|
0.00
|
2.00
|
|
Cyprus
|
0.00
|
0.00
|
1.00
|
|
Czech Republic
|
1.09
|
1.00
|
3.701
|
|
Denmark
|
0.00
|
0.00
|
0.10
|
|
Estonia
|
0.00
|
0.00
|
2.00
|
|
Finland
|
0.11
|
0.11
|
0.10
|
|
France
|
0.67
|
0.67
|
2.00
|
|
Germany
|
1.21
|
1.72
|
2.00
|
|
Greece
|
0.00
|
0.00
|
0.70
|
|
Hungary
|
0.00
|
0.00
|
0.60
|
|
Ireland
|
0.00
|
0.00
|
0.06
|
|
Italy
|
0.50
|
0.50
|
1.00
|
|
Latvia
|
0.22
|
0.07
|
2.00
|
|
Lithuania
|
0.00
|
0.02
|
2.00
|
|
Luxembourg
|
0.00
|
0.02
|
0.00
|
|
Malta
|
0.02
|
0.10
|
0.30
|
|
The Netherlands
|
0.03
|
0.01
|
2.00 2
|
|
Poland
|
0.49
|
0.30
|
0.50
|
|
Portugal
|
0.00
|
0.00
|
2.00
|
|
Slovakia
|
0.14
|
0.15
|
2.00
|
|
Slovenia
|
0.00
|
0.06
|
0.65
|
|
Spain
|
0.35
|
0.38
|
2.00
|
|
Sweden
|
1.32
|
2.28
|
3.00
|
|
UK
|
0.03
|
0.04
|
0.19
|
|
EU25
|
0.50
|
0.70
|
1.40
|
1 2006; 2 Estimate.
Source: European Commission (2007). Biofuels Progress Report
The authors gratefully acknowledge support from the Netherlands Ministry of Agriculture, Nature and Food Quality. This work builds upon the methodology developed in the EUruralis project.