

The economic fallout of the financial crisis has widely and deeply impacted most economic sectors. The initial declines in housing prices and subprime delinquencies spilled into the financial markets. Because banks and other financial intermediaries are critical conduits for economic investment and growth, the crisis quickly migrated to individuals, small businesses and large firms. The economic feedback loops resulting from the economic slowdown and job losses are certainly impacting the confidence of consumers and the stability of the financial services sector. Moreover, due to the interconnectedness among the major global financial institutions, the crisis spread worldwide. This financial turmoil and economic disruption in the financial markets is clearly unprecedented. Agriculture and institutions lending to agriculture have not been immune to the impacts of the financial crisis. This article provides a summary of some of the financial indicators useful in measuring the extent of the credit crisis and an overview of the current and potential impacts on agriculture.
The macroeconomic news continues to top the headlines and reveal the dimensions of the turmoil in credit markets. The delinquency rate for mortgage loans on one-to-four-unit residential properties rose to a seasonally adjusted rate of 7.88% of all loans outstanding as of the end of the fourth quarter of 2008, up 2.06% from one year ago (Mortgage Bankers Association, 2009). Financial system write downs and credit losses have exceeded $1 trillion, and the International Monetary Fund (IMF) has raised its estimate of the potential deterioration in U.S. originated credit assets to $2.2 trillion (IMF 2009). Over the past 12 months, the number of unemployed has increased by about 5.0 million and the unemployment rate has risen 3.3 percentage points to 8.1%. In an attempt to fill the gap in credit availability, the Federal Reserve has undertaken a variety of lending programs, resulting in a doubling of its balance sheet between Aug. 8, 2007 ($902 billion) and March 5, 2009 ($1.943 billion) (Federal Reserve Bank, 2009).
There is some evidence that credit markets have eased moderately since November 2008. A wide range of indicators are often used to measure the liquidity risk and the willingness to lend among financial institutions. Three indicators that provide information are (1) LIBOR-OIS spread, (2) AAA-BAA corporate bonds spreads, and (3) credit default swap (CDS) spreads for U.S. grade financial institutions.
The LIBOR-OIS spread is used as a barometer of stress and illiquidity in the money markets. It is the difference between the three-month (or one-month) London Interbank Offered Rate (LIBOR) and the overnight indexed swap (OIS) rate. In stressful times, LIBOR reflects credit and liquidity risk and thus, the spread is used as a summary indicator of credit market conditions. Historically, the LIBOR-OIS spread was about 10 basis points. It increased to 365 basis points after the Lehman failure on Oct. 10, 2008. By mid-February 2009 the rate had dropped to approximately 100 basis points, high by historic standards, but substantially lower than its peak. LIBOR rates increased slightly in mid-March 2009, reflecting the fact that considerable uncertainty in the market remains.
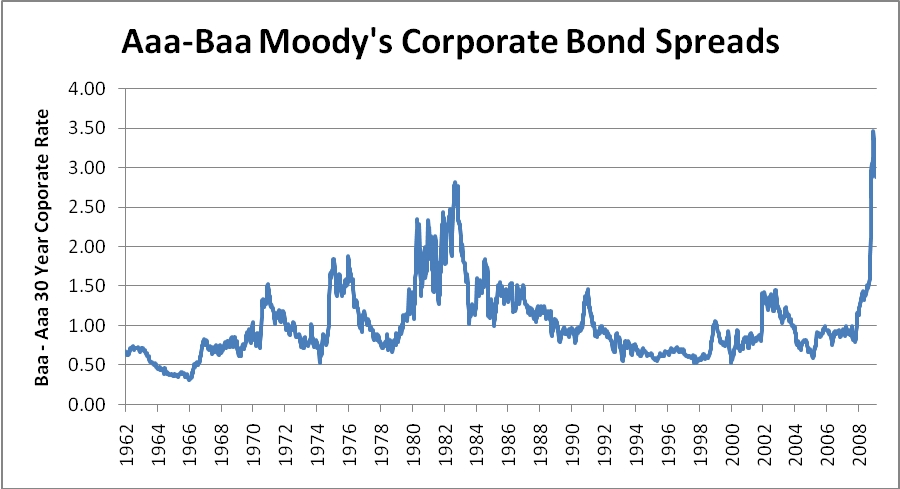
The AAA-BAA corporate spread is a useful indicator for the price of credit risk. As spreads increase, the cost of borrowing and credit risk also increase. As shown in Figure 1, the spreads peaked in late 2008 at near 3.5% and have dropped slightly to 2.9% during the first week of February 2009 (Federal Reserve Bank of St. Louis 2009).
General economic and systemic risks to financial institutions remain high. Credit default swap (CDS) spreads, a measure of the price of risk, for high grade U.S. financial stocks have declined to 300 basis points from 500 basis points in October 2008. However, the CDS spreads were below 100 basis points prior to the crisis. In summary, though some easing of the credit conditions is evident, there is substantial credit and liquidity risk in the markets.
In general, the financial condition of farm borrowers was strong entering 2008. Estimated profitability of U.S. farms in 2008 was a record $89.3 billion. However, net farm income is projected to be 20% lower in 2009. The major stress sectors in agriculture are the protein markets, especially pork and poultry. These producers entered 2008 in more stressful liquidity and leverage positions. Continued low profit margins have increased the credit risks for these sectors. A significant example is the bankruptcy filing of Pilgrim’s Pride, the nation’s largest chicken producer.
Agriculture is generally characterized as using a low amount of debt relative to assets. The U.S. Department of Agriculture forecasts total farm debt of approximately $217.1 billion for 2009 (USDA 2009). Total assets in the farm sector exceeded $2.38 trillion, resulting in a farm aggregate debt to asset ratio of only 9.1%. The debt-to-asset ratio in the mid-1980s exceeded 20%. Another financial stress indicator for the United States is the proportion of net farm income used for debt service. The ratio was approximately 30% in the mid-1980s, but was only 10% in 2007. In general, the agricultural sector was in strong financial condition going into 2009. Hence, agricultural credit was generally available during the first quarter of 2009.
From an agricultural credit availability standpoint, Asian and European countries appear to be in a similar situation to the United States. Credit availability for farmers in these countries has been aided through stimulus, government financing programs and subsidies. However, credit availability in Brazil and Argentina is likely to be a constraint for agricultural producers.
The primary U.S. lenders in agriculture are commercial banks, the Farm Credit System, insurance companies, Farm Service Agencies and captive finance companies. The Farm Credit System holds approximately 42% of the real estate debt and 31% of the nonreal estate farm debt. (USDA, 2007) Commercial banks have the highest market share of nonreal estate farm debt (53%) while lending 38% of the farm real estate loans. Commercial banks and FCS hold 83% of the total agricultural debt. The following sections concentrate on these major lenders and identify the areas of concern regarding the availability of credit and potential risks faced by these institutions in the current environment. The impacts are separated into those that were observed immediately after the initial financial crisis and the impacts being felt from the secondary impacts resulting from the economic downturn.
Relative to other financial intermediaries, agricultural lenders generally remain healthy. Many of the agricultural-related institutions did not participate in higher-risk housing lending procedures nor were they significantly invested in the structured securities that have lost substantial market value. The initial impact of the crisis did impact larger agribusinesses through lack of working capital financing or trade credit and the large increase in the cost of debt capital. The initial phase of the financial crisis did not have a pronounced effect on the credit availability to much of commercial agriculture, but did impact the securities portfolios of many lenders providing credit to agriculture.
Substantial write-downs in investments related to Fannie Mae, Freddie Mac and Lehman Brothers have occurred across commercial banks, the Farm Credit System, Farmer Mac, and insurance companies. Farmer Mac, the government sponsored enterprise (GSE) which serves as the secondary market for agricultural loans, maintained a substantial investment portfolio and did suffer substantial capital losses due to investments. As a result of their exposure to these positions, they issued $65 million in preferred stock to increase their effective capital ratio. The reduction in capital has also decreased the extent that Farmer Mac can provide long term standby commitments, an instrument that has been used by Farm Credit System associations to manage risk and capital. An additional area of potential investment valuation vulnerability for commercial banks is the security valuation and the viability of the Federal Home Loan Banks.
Another impact of the initial phase of the crisis was the limited ability of the Farm Credit Funding Corporation to issue longer term bonds. The Farm Credit System uses capital markets to acquire funds by issuing consolidated system-wide bonds and notes. The market generally views Farm Credit debt as being relatively safe and generally requires modest spreads over Treasuries for placement of the debt. The general lack of bond investor confidence coupled with the unintended consequences resulting from the prevalence of new credit facilities and guarantees provided by the U.S. government have resulted in a lower appetite for longer term bonds issued by the Farm Credit System. Management of the Farm Credit System and the Federal Farm Credit Funding Corporation have worked with the FDIC, Federal Reserve, and the Treasury to develop strategies to assure liquidity backstops in the event of a more severe market disruption(Strom 2009).
Commercial banks lending to agriculture are generally dominated by small, community oriented banks that use local deposits as their primary source of funds. In general, the first wave of the crisis did not impact most community banks. However, the largest 15 banks lending to agriculture hold approximately 20% of the farm debt provided by commercial banks (FDIC 2009). These banks were exposed to the initial financial stresses occurring in the credit markets; hence, their agricultural activities were not likely insulated from the effects of the financial market disruptions. Publicly traded banks and bank holding companies also experienced significant changes in market capitalization. Only 19% of the banks providing credit to agriculture are publicly traded or owned by a publicly traded bank holding company. However, almost 35% of the volume of agricultural loans is held by a publicly traded institution. The barbell shape nature of the lending institutions lending to agriculture is an issue that should be reemphasized. General characterizations of the agricultural lenders are often small-community-oriented banks. However, large banks and publically traded banks have a large portion of the portfolio, especially larger more complex farm operations. Since these banks had to incur some of the costs of the first wave, their lending practices were very likely impacted. Moreover, publicly traded institutions face the continued stress of declines in market capitalization and earnings announcements of the banking sector.
The asset-backed-security market was also crippled by the initial crisis. Asset backed securities are used by many farm machinery companies as a cost-effective method to fund loans to borrowers. Since this alternative was not available, some companies had to use higher cost methods to finance these loans. The government program that may revive this market is the Term Asset-Backed Securities Loan Facility (TALF), a facility that will support the issuance of asset-backed securities (ABS) collateralized by student loans, auto loans, credit card loans, and loans guaranteed by the Small Business Administration (SBA).
The secondary impacts of the financial crisis on financial institutions have occurred through changes in loan demand, reduced net interest margins, loan downgrades and defaults. Lower farm profit margins and downward pressure on farmland valuations also present stress to institutions providing debt capital to agriculture. The softening of farmland markets is being influenced by (1) reduced demand from lower housing development, (2) the wealth and cash flow impacts of a drop in equity prices for many potential farmland buyers, (3) the increase in risk in agriculture resulting in an increase in capitalization rates, and (4) the lower demand for recreational property.
The number of troubled banks reported by the FDIC has increased from 76 at the end of year 2007 to 252 at the end of 2008 (FDIC 2009). The impacts on commercial banks lending to agriculture are illustrated in Table 1. In general, the capital positions of the smaller institutions lending to agriculture remain strong. Only 33 banks of the 5,997 banks lending to agriculture were classified as undercapitalized by the FDIC. Although this is a low number, there were only 13 on June 30, 2008. The relatively low level of ROA for banks illustrates the stresses exhibited by most banks, especially larger banks. The 5-year average for each of the size groups is approximately 1%. Higher proportions of problem loans at larger banks are also observed. Another area of vulnerability noted by the FDIC is that a number of agricultural banks have exposure to construction and development loans. These higher risk loans have been especially stressed by the current economic climate.
The capital positions of many banks was aided by the U.S. government’s troubled asset relief program (TARP). The initial investment of $125 billion was to be used as equity investments in large banks while another $125 billion was available for regional and community banks. As of Feb. 9, 2009 almost 400 firms have participated, including more than 530 commercial and savings banks in the United States. The financial commitments of TARP have exceeded $280 billion. As expected, participating banks exhibited lower profitability in 2008. The average rate of return on assets for participating banks in 2008 was 0.009% while the average for nonparticipating banks was 0.42%. Approximately 6% of the 5,997 banks that provided credit to agriculture in 2008 participated in the TARP program. However, participating banks provided 24% of volume of agricultural loans made by all commercial banks.
This is truly an unprecedented time in our agricultural and general economies. Policymakers are in uncharted waters as governments are using many monetary and fiscal tools and approaches to relieve the credit stresses and liquidity problems and ultimately restore confidence in the financial markets.
In general, the financial health of lenders to agriculture remains strong. The agricultural lending industry is characterized by strong customer-borrower relationships. The institutions are well regulated in a manner to protect the safety and soundness of the institutions and the safety of the insurance deposit base. At the same time, the economic downturn and declining interest rates have reduced profit margins for agricultural lenders in 2008 and forecasts for margins in 2009. Nonperforming and past-due loans have increased. The strong management and capital positions of agricultural lenders provides a buffer for these economic downturns, but the failure and consolidation of lending institutions, including some in agriculture, are likely to occur. At the very least, the agricultural sector will be forced to compete with other sectors for increasingly scarce capital in the foreseeable future. In doing so, the farm sector will be forced to adapt to sources of instability outside of its control.
Ellinger, P.N. and B.J. Sherrick (2008). Financial Markets in Agriculture. Agricultural and Consumer Economics, University of Illinois, Urbana,-Champaign, IL, staff paper, November 2008.
Federal Reserve Bank. (2009). Statistical release H.4.1: Factors Affecting Reserve Balances of Depository Institutions and Condition Statement of Federal Reserve Banks. Washington D.C.
Federal Reserve Bank of St. Louis. (2009). Economic Data–FRED®. March 2009, St. Louis, Missouri.
Federal Deposit Insurance Corporation (2008). Quarterly Banking Profile. December 2008. Washington D.C.
Federal Deposit Insurance Corporation (2009). Call and Income Reports for Commercial Banks, December 2008. Washington D.C.
International Monetary Fund. (2009). Global Financial Stability Report Market Update. Monetary and Capital Markets Department. January 2009. Washington D.C.
Mortgage Bankers Association. (2009). National Delinquency Survey, 4th Quarter 2008. Washington D.C.
Strom, L.A. Remarks at Farm Credit Council Annual Meeting, San Diego, CA, January 27, 2009.
U.S. Department of Agriculture (2009). Farm Income and Costs: Assets, Debt, and Wealth. Economic Research Service. February 2009. Washington D.C.
U.S. Department of Agriculture (2007). Farm Balance Sheet. Economic Research Service. September 2008 . Washington D.C.
| Asset Size ($ Million) | Loan to Deposits | Equity to Assets | Rate of Return on Assets | Nonaccrual Loans to Total Loans |
| Less than 100 | 75% | 12.1% | 0.52% | 1.32% |
| 100–500 | 85% | 10.1% | 0.57% | 1.80% |
| 500–1,000 | 93% | 9.5% | 0.54% | 2.05% |
| 1,000–10,000 | 102% | 9.9% | 0.09% | 2.51% |
| Greater than 10,000 | 134% | 10.0% | 0.00% | 2.03% |
Source: FDIC, Preliminary Call and Income Reports.
Nonaccrual loans are loans where interest income to the bank has been suspended because of loan and collateral problems. 12/31/2008