|
When a species invades an agricultural system, policymakers and producers need ways to compare the cost and benefits of control alternatives. In this paper, we examine the greenhouse whitefly invasion of California strawberries and a set of control alternatives, along with the effects of the information included in the analytical framework.
The greenhouse whitefly invasion into California strawberries has three economic and biological characteristics that make it a particularly interesting case. First, restrictions associated with pesticides registered for use against the greenhouse whitefly (hereafter called the whitefly) create a complex management problem. Only one chemical was registered for use against whiteflies on strawberries during the harvest period, pyriproxyfen (Esteem). Furthermore, regulations limiting the number of Esteem applications to strawberries complicate management. Namely, the Environmental Protection Agency has imposed a limit that only two applications of Esteem may occur per year.
Second, the whitefly's life cycle can be modeled plausibly based on data from a single season. The resultant model can be used to study management alternatives and to guide data collection efforts for other invasive species by revealing key parameters associated with population development and interactions with economic activities. Third, the whitefly is a significant economic problem in two geographically separate California regions. The climate and other differences across these regions create different host cycles and whitefly population dynamics, which then lead to differences in decisions concerning whitefly management.
The biological, economic, and regulatory features of the invasion cause grower incentives for whitefly control to vary by region and by week. Therefore, in order to create economically and environmentally efficient whitefly management policies, an understanding is needed of a grower's profit-maximizing response to pest damages. Empirical "bioeconomic" models, which unify information on biological relationships, economic relationships, and interactions between them, are useful in developing such policies (McKee, 2006; McKee, Goodhue, Chalfant, & Carter, 2006; Eiswerth & Johnson, 2002; Knowler & Barbier, 2000).
Also, when doing invasive species modeling it is often the case that limited information is available. In this study, we examine the value of adding information first using only data arising soon after the establishment of the whitefly population and then adding other information about the whitefly's life cycle from the scientific literature.
Models of Whitefly Population Development in California Strawberries
The whitefly invasion started in the mid-1990s in Ventura County and was later observed in the Watsonville/Salinas strawberry-growing region (Monterey and Santa Cruz Counties). Though whiteflies were common in coastal California prior to that time, strawberries had not been recorded as a host.
Strawberries are grown along the California coast almost year-round. A plant is typically in the ground for approximately nine months, usually starting in the fall. Weekly yields are relatively small in the early spring, increase very rapidly in mid- to late-spring, and then taper off during the summer. The population growth rate of the greenhouse whitefly on strawberries changes throughout the season since temperature regulates maturity rate. Whitefly reproduction and population development are slowest during the coolest parts of the growing season and more rapid during the hotter, spring and summer months.
Alternative Approaches to Modeling
We use statistical techniques to predict the future whitefly population. Initially, we only use data from the invasion during the 2002-2003 growing season. This requires limited relatively immediate data and permits rapid model and policy development. However, it may omit important biological factors, such as variations in the population growth rate over time, if no such data are available. Later, we augment the approach with information from whitefly studies in similar environments utilizing results on various life stages. This may also be an attractive option since the costs for data collection have already been incurred, and only an analysis of emerging information is needed. However, the main question is whether data obtained from outside sources are relevant.
Thus, two models are used. The first estimates a daily adult population series using egg count data from the invasion. The second uses invasion egg, nymph (juvenile whitefly), and adult whitefly data, along with observations from other whitefly studies (Hulspas-Jordaan & van Lenteren, 1989) to inform the model about how variations in environmental conditions affect whitefly population development. The additional population data were acquired at little additional cost.
Results
In order to assess control alternatives we compare estimated net revenues, after spraying costs and population predictions, under various strategies using the two models.
Model Replication of Population
We first evaluate the model results to see which model replicates the observed data better. If the two models both adequately reflect the whitefly population dynamics, then the estimated population series should be comparable. If they are not, this indicates that information is lost when the augmenting experimental information is not used. If a significant difference is observed, then the additional information allows more accurate and effective evaluation of prospective whitefly management policies.
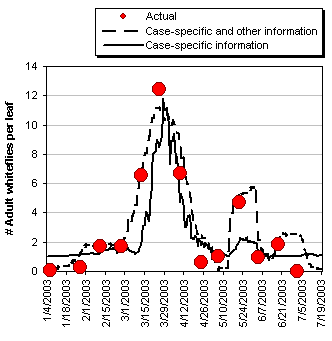
The solid line in Figure 1 represents the estimated adult whitefly population series from the first model; the dashed line represents the second. The 13 large dots represent the observed sample. As the figure shows, both models reasonably predict the timing of peaks and troughs in the whitefly population.
One way to more precisely compare the results of these two models is to measure the area under each curve. This area measures the size of the population and the length of time it persists, stated in units we call "whitefly-days." There were 505 cumulative whitefly-days observed in the sample. The first model (case-specific data only) predicts 430 whitefly-days (15% error), while the second predicts 564 cumulative whitefly-days (10% error). Based on this criterion, the second model generates a superior prediction.
Information and Costs of Esteem Limits
Fundamentally, what matters is not the existence of a difference in predictive power, but whether or not there is a substantive economic consequence when evaluating a policy option. To address this question, we examine net revenue and population changes caused by Esteem application restrictions. The optimal application program in each model is the one with the largest net revenues.
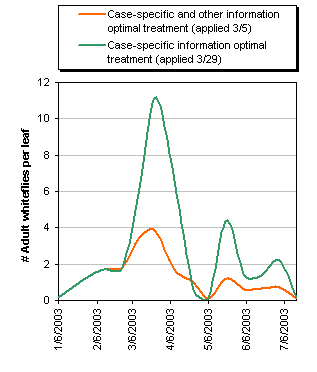
We first examine the difference in the model results regarding the development of the whitefly population for the case of a single Esteem treatment, illustrated in Figure 2. When using the first model, the optimal date for a single Esteem application is March 29, just after the largest observed adult whitefly population peak. In contrast, the additional information used in the second model changes the optimal pesticide application date to March 5th, just before the adult whitefly population begins to build. Prior to March 5, the populations are identical. The population generated by the March 5 application generates smaller population peaks than the March 29 application, and higher net revenues. Collectively, the more accurate model results in a difference of approximately 3% of net revenue per untreated acre.
To provide further perspective, we examine the cost of the Esteem regulation limiting growers to two or fewer applications per season. Using the second model, under two applications we get about $7,800 per acre, as opposed to about $9,500 per acre for three, a regulation cost of about $1,700 per acre. In contrast, under the simpler model the net revenues from the restricted case are about $4,700 per acre, compared to about $7,000 per acre for the relaxed case, which is a difference of about $2,300 per acre.
The added information suggests the cost of the regulations is smaller under more informed pest management, amounting to 18% versus 33% of net revenue. The benefit is partially due to the difference in the optimal spraying time, and partially due to the more accurate representation of post-treatment population development. Based on about 1,000 infested acres in 2003, the value of relaxing the application limit would have been $1.7 million, in net revenue, per year. However, additional applications would have increased the likelihood of resistance, and if complete resistance arose we estimate losses relative to the two-application case would be about $7.8 million per year. While this is obviously a very simplistic view of the implications of resistance, it illustrates how large the benefits from preventing or delaying the development of resistance can be in this specific case.
The weaknesses of the first model suggest that for decisionmaking support it would be valuable to merge experimental data on pest life cycle stages with other known information. Of course, if unlimited data were available, the performance of the first model would be augmented including other relevant variables. However, our model comparison was motivated by the often limited data available for policymakers examining invasive species policy options, as existed in the case study we examined.
What Types of Models should Policymakers and Growers use for Decisionmaking?
When a species invades an agricultural system, policymakers and growers require integrated bioeconomic models in order to evaluate control options. When constructing these models, there is an inevitable tradeoff between implementing a control approach early in the invasion and waiting to collect data specific to the invasion in order to make a more informed decision. We have examined addressing this tradeoff by combining scientific information from other sources regarding the whitefly with available data from its invasion of California strawberries. Using readily available data and physiological models to estimate the economic harm the greenhouse whitefly causes—decreased strawberry yields—generates a more accurate whitefly population prediction than one that only uses case-specific data.
We found that the difference in the population models substantially affected the estimates of the per-acre cost of the Esteem application limit for growers. Using only data from the invasion, the cost was $2,300 per acre, or $2.3 million in the infested area. Using the augmented model, the cost was $1,700 per acre, or $1.7 million in the infested area.
Our analysis of this specific case illustrates that information on the life cycle of the pest, when available, can improve decision making. Namely, the model with more information is better able to describe the feedback between grower management decisions and the invader/host plant environment. Policymakers need to determine whether or not they need to intervene in the system. In our case, regulators were concerned about the possibility of the whitefly developing resistance to the only effective control treatment prior to the development of alternative treatments. Using the augmented model resulted in a 26% lower estimated per-acre cost of complying with the requirement of two or fewer Esteem applications in order to obtain the benefit of a decreased likelihood of resistance development. Of course, the off-setting caveat is that the modeler must make careful decisions regarding which outside information is sufficiently relevant.
For More Information
Eiswerth, M., & Johnson, W. (2002). Managing nonindigenous invasive species: Insights from dynamic analysis. Environmental and Resource Economics, 23, 319-342.
Knowler D., &. Barbier, E. (2000). The economics of an invading species: A theoretical model and case study application. In C. Perrings, M. Williamson, & S. Dalmazonne, (eds.), The economics of an invading species. Cheltham, UK: Edward Elgar Publishing, Ltd.
Hulspas-Jordaan, P., & van Lenteren, J. (1989). Modeling population growth of the greenhouse whitefly. Wageningen Agricultural University Papers, 89-92.
McKee, G. (2006). Pesticide resistance, population dynamics, and invasive species management. Doctoral dissertation. University of California, Davis.
McKee, G., Goodhue, R., Chalfant, J., & Carter, C. (2006). Modeling the effect of spatial externalities on invasive species management. Presented at the 2006 AAEA Annual Meetings, Long Beach, CA.
Osborne, L. (1982). Temperature-dependent development of greenhouse whitefly and its parasite. Encarsia formosa. Environmental Entomology, 11, 483-85.
Perrings, C., M. Williamson, and S. Dalmazonne. (2000). Introduction. In C. Perrings, S. Dalmazonne, and M. Williamson, The economics of an invading species, pp.1-16. Cheltham, UK: Edward Elgar Publishing, Ltd.
Sumner, D. (2003). Economics of policy for exotic pests and diseases: principles and issues. In D. Sumner (ed.), exotic pests and diseases: Biology and economics for biosecurity. Ames, IA: Iowa State University Press.
|
|
Other articles in this theme:
|
|


