As noted in the overview to this set of papers, water quality continues to be a growing concern. Nutrients applied as commercial fertilizer and manure enter surface and ground water, leading to several forms of water quality impairment. These impairments manifest themselves in a number of ways. Excess phosphorus is responsible for algae blooms, losses in water clarity, and even the presence of toxic cyanobacteria in fresh water. Excess nitrogen is believed to be the limiting factor in low-oxygen dead zones in several dozen locations around the globe. In some locales, nitrate concentrations reach levels that are toxic to both humans and aquatic animals. In the United States, local nitrate concentrations are largely uncontrolled. The only widely applied standard affects water used for human consumption. This is regulated by the Environmental Protection Agency via National Primary Drinking Water Regulations (EPA NPDWR). Similar requirements and guidelines exist in Canada and Europe.
Watershed Background
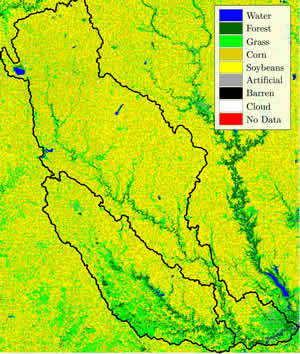
The area used for simulation is the Raccoon watershed, located in the state of Iowa in the United States. The Raccoon River is the main stream for the watershed and drains a large area containing an abundance of fertile soil. The total area of the watershed is approximately 2.3 million acres, 1.7 million of which are devoted to rotations of corn and soybean production. Nitrogen and phosphorus fertilizer are applied at high levels on the corn crop and constitute the primary nonpoint nutrient pollutant source in the watershed. Figure 1 shows a land-use map of the watershed. The outlet of the watershed is near the capital city of Des Moines, which along with other municipalities in the area, uses the Raccoon River as a source of drinking water. The Des Moines Water Works is the supplier of drinking water and currently operates the world's largest denitrification facility.
In-stream nitrate levels frequently exceed the maximum allowed concentration of 10 milligrams per liter. In these instances, source water is run through the denitrification facility before being treated for use as drinking water. The facility uses an ion exchange process which produces waste water with a high saline content in addition to the nitrate removed. This waste water is currently discharged downstream at no cost to the facility. Downstream municipal water supplies are not adversely impacted by this discharge, as they are able to meet their water needs from deeper ground water aquifers. For purposes of NPDWR compliance this is not an issue, and the discharge is permitted by the EPA under the National Pollutant Discharge Elimination System.
The nitrate removal facility was constructed in 1990 at a cost of approximately $3 million. The scrubbers and media were the primary components of this large sunk cost, and would also be the bulk of the cost associated with an expansion of the facility unless another removal technology were employed. Current processing volume does not appear to require expansion in the near term, and there has been no observed deterioration of the scrubber components. Operating costs of the facility are approximately $300 per million gallons of water, with a capacity of 10 million gallons of water per day. In an average year, the facility runs approximately 50 days.
Modeling Approach
While drinking water standards are given high importance due to their direct effects on human health, high nitrate levels cause other problems. However, control of ambient water pollution in this watershed is still being developed, and there are no existing regulations outside of drinking water standards. Ameliorating problems such as hypoxia and nitrate toxicity for aquatic animals would require both a lower threshold for nitrates and complete removal of the nitrate from the watershed. Meeting the latter requirement with the technology currently used for drinking water purposes is inappropriate as it reintroduces the nitrate to the environment. The analysis here proceeds in the framework of existing regulations and the technology currently in place, but it is important to note that there are other impacts that merit consideration: namely, the effects of nitrate levels outside of drinking water considerations. Upland fertilizer reductions prevent nitrates from entering waterways in the first place, and have positive effects beyond contributing to drinking water standard compliance.
The goal of the modeling framework is to capture changes in water quality generated by implementation of policy, as well as the associated economic effects. This requires the coupling of an economic model with a physical model. Nutrient application levels predicted by the economic model are used to supply land-use inputs to the physical model. The output from the physical model in turn provides the water quality measure of interest: nitrate concentration over time. A hydrologic model is used to link the effects of upland fertilizer reductions to direct nitrate removal at the outlet. The watershed-based Soil and Water Assessment Tool (SWAT) simulates the effects of watershed management on water quality and water flow on a daily time step. It is primarily used for modeling nonpoint source contributions to nutrient and sediment loads within a watershed. The SWAT implementation employed uses data from the National Resources Inventory (NRI) to populate the watershed with spatially detailed information. A point in the NRI effectively represents a farm. Site-specific nutrient application data are generated by the economic model. The economic model predicts nitrogen fertilizer application rates based on prices of corn and fertilizer and a site-specific soil characteristic. It also predicts yield, and thus returns to fertilizer application. Changes in nitrogen fertilizer prices, for example, via a tax on fertilizer or a cap on application, will cause a loss in returns for the farmer. This provides a measure of the cost imposed by the policy. Data used to construct the model comes from a farm operator survey, the Agricultural Resource Management Survey, historical prices, and from a detailed soil grid.
Policy Simulations
Three scenarios are run through the modeling system described above. One is a baseline in which the economic model leaves prices and nitrogen fertilizer applications unchanged, and the water quality model predicts the associated nitrate concentrations at the watershed outlet. The other two scenarios represent reductions in fertilizer applications simulated by the imposition of a nonpoint source trading scheme. This scheme works as follows: each farm is allocated fertilizer application permits for the total acreage it farms; for example, a 100-acre farm might receive 12,000 pounds worth of permits if the permit level is 120 pounds per acre. A farm has three choices in using its permits. One is to apply exactly the permitted amount. Another is to apply less than permitted, and sell the surplus permits to the third group, those who purchase permits in order to apply at greater levels than initially permitted. Farmers make their choice of total application according to the model, taking into account the prices they face, their soil type, and the market price of a permit, which is determined by the distribution of farmer types. The total watershed application is reduced as long as the total permit allocation is smaller than the total amount originally applied. For purposes of simulations, this is done at two levels of permit allocations. From a baseline average application rate of 135 pounds per acre, one scenario restricts the per-acre permit allocation to approximately 120 pounds per acre and results in a simulated 6% reduction in annual load of nitrate at the watershed outlet. The other restricts the allocation to approximately 108 pounds per acre and results in an approximate 12% reduction in annual nitrate load. These reductions are the result of the total mass of nitrogen being applied in the watershed being reduced.
Imposing the permit restrictions benefits those farmers who can sell excess permits, but increases the costs of those who must purchase additional permits. Since the total amount of nitrogen application is being reduced, the net result is a loss for farmers in the watershed as a whole. Loss or gain from the policy scenarios can be measured for individual farms and then aggregated to the watershed level to gauge the cost of the policy. Under the small reductions, the total farm watershed loss is approximately $161,000, and under the larger reductions, losses are approximately $700,000.
To compare the water quality changes resulting from the implementation of these policies to operation of the nitrate removal facility, the water-quality model is run on a daily time step and the nitrate concentration for each day recorded. The trigger concentration for the nitrate removal facility to run is 9mg/L (the legal limit is 10mg/L). Under the baseline scenario, that level was exceeded 56 days of the year. The small and large reduction scenarios reduced the number of run-days to 51 and 48. Figure 2 shows a summary of nitrate loads by monthly average. Saving days of operation for the nitrate removal facility implies cost savings and illustrates the shortening in the number of run-days required to maintain a safe level of nitrate. The energy, labor, and raw material costs of one run-day are approximately $3,000. The lifetime of the media used in the removal process is currently uncertain, making it difficult to calculate the true cost of operation. The original media is still in use and shows no sign of deterioration after 14 years of use. As nitrate loads and water demand grow, there may be a need for expansion in the future, involving significant capital costs and raising the cost of a day of operation. Such expansion may also involve a change in nitrate removal technology.
Trading nitrogen permits between point and nonpoint sources can lower costs of reductions (Randall & Taylor, 2000). This is usually considered in the context of a nonpoint source generating excess permits by purchasing upland reductions. In that type of trading arrangement, a trading ratio is established to equilibrate a pound of upland reduction to a pound of point source discharge. Conceptually, this approach could work in reverse as well: nonpoint sources could generate permits for themselves by paying for the removal system. While these trading opportunities are attractive possibilities, a quick look at the difference in costs in this case suggests that it would be much more efficient to simply run the nitrate removal facility a few extra days rather than implement any restrictions on farmer application. Five run-days at $3,000 per day is $15,000, far less than the $160,000 in losses that would be incurred by farmers. Eight run-days of the nitrate removal facility are likewise much less expensive than the $700,000 in losses associated with the stricter cap-and-trade policy.
While the upland fertilizer reductions examined here are more costly than direct nitrate removal, this analysis does not take into account other possibilities. There are also concerns beyond drinking water standards, such as hypoxia and low-level nitrate toxicity (Camargo et al., 2005), that have important impacts on ambient water quality. Perhaps because drinking water issues pose the most immediate threat to human health, it is the only form of existing pollution regulation that impacts this watershed. As new standards with broader impacts in mind are developed, such as Total Maximum Daily Loads, this analysis can be revisited, possibly with different conclusions. The upland reductions have an effect on the ambient and downstream nitrate loads that the removal process does not and would be more effective at meeting expanded standards. Even if under more comprehensive standards upland reductions become more cost effective, there would be transaction costs involved in any trading scheme that would also need to be considered.
There are also combinations of reduction strategies that could result in superior reductions with similar costs, even in the existing framework. Coupling reductions with buffer strips, grassed waterways, changes in tillage, and application timing all can contribute to reductions in nutrient loads to a watershed. In addition, a more complete comparison would require information on possible deterioration of the nitrate removal media and the associated replacement costs, though these are at present uncertain.
For More Information
Atwood, J., McCarl, B., Chen, C., Edelman, B., Nayda, B., & Srinivasan, R. (2000). Assessing Regional Impacts of Change: Linking Economic and Environmental Models. Agricultural Systems, 63, 147-59.
Camargo, J., Alonso, A., & Salamanca, A. (2004). Nitrate toxicity to aquatic animals: A review with new data for freshwater invertebrates. Chemosphere, 58, 1255-67.
Jones, C. (2005). Nitrate and bacteria in the Raccoon River: Historical perspective and 2004 Summary, Des Moines Water Works. Available online: http://www.dmww.com/Laboratory/.
Nusser, S., & Goebel, J. The National Resources Inventory: a long-term multi-resource monitoring programme. Environmental and Ecological Statistics, 4(3), 181-204.
Randall, A., & Taylor, M. (2000). Incentive-based solutions to agricultural environmental problems: Recent developments in theory and practice. Journal of Agricultural and Applied Economics, 32, 221-34.
United States Environmental Protection Agency, National Primary Drinking Water Regulations (EPA NPDWR). Current Drinking Water Rules. Available online: http://www.epa.gov/safewater/regs.html.
United States Geological Survey, National Water-Quality Assessment (USGS NAWQA). Nutrients in streams and rivers across the Nation-1992-2001 National Water-Quality Assessment Program. Available online: http://water.usgs.gov/nawqa/.
|
|
Other articles in this theme:
- Agriculture and Water Quality in the Cornbelt: Overview of Issues and Approaches
Matthew J. Helmers, Thomas M. Isenhart, Catherine L. Kling, Thomas B. Moorman, William W. Simpkins, and Mark Tomer
- A Tale of Three Watersheds: Nonpoint Source Pollution and Conservation Practices across Iowa
Keith E. Schilling, Mark D. Tomer, Philip W. Gassman, Cathy L. Kling, Thomas M. Isenhart, Thomas B. Moorman, William W. Simpkins, and Calvin F. Wolter
- Privatizing Ecosystem Services: Water Quality Effects from a Carbon Market
Silvia Secchi, Manoj Jha, Lyubov Kurkalova, Hongli Feng, Philip Gassman, and Catherine Kling
|
|