Information asymmetries are a (near) universally accepted contributing factor of market failures. Research in agricultural and applied economics about information asymmetry is plentiful, ranging from the role of traceability systems in food markets (Hobbs, 2004) to vertical integration in food industries (Hennessy, 1996). A historical cornerstone of U.S. agriculture is the attempt to lessen or alleviate the impacts of information asymmetries by creating “public good” information sources. The U.S. Department of Agriculture (USDA) provides leadership on food, agriculture, natural resources, rural development, nutrition, and related issues based on public policy, the best available science, and effective management (USDA, 2019a). The USDA self-proclaims,
We have a vision to provide economic opportunity through innovation, helping rural America to thrive; to promote agriculture production that better nourishes Americans while also helping feed others throughout the world; and to preserve our Nation’s natural resources through conservation, restored forests, improved watersheds, and healthy private working lands.
The USDA and its affiliated agencies provide data and reporting that is universally accessible and employed by firms, farms, and agencies to make decisions. The National Institute of Food and Agriculture (NIFA) is federal agency within the USDA that is part of USDA’s Research, Education, and Economics (REE) mission area (USDA, 2019d). The mission of the USDA’s Economic Research Service (ERS) is “to anticipate trends and emerging issues in agriculture, food, the environment, and rural America and to conduct high-quality, objective economic research to inform and enhance public and private decision making” (USDA, 2019b). The USDA’s National Agricultural Statistics Service (NASS) conducts surveys every year to inform reports on virtually every aspect of U.S. agriculture (USDA, 2019c). Production, price, market, labor, finance, and agri-supply chain data (including on-farm labor and wages) are some examples of data and reporting by NASS, which “report[s] the facts on American agriculture, facts needed by people working in and depending upon U.S. agriculture” and “provide[s] objective and unbiased statistics on a preannounced schedule that is fair and impartial to all market participants,” among other endeavors (USDA, 2019c).
The sheer volume of media following a much-anticipated USDA report release is evidence of the importance of this information in the marketplace. Correspondents and market analysts need not agree with the information provided; entire publications exist to debate the USDA’s reports and/or predictions. Nonetheless, even those who offer counterarguments and commentary would not be able to do so without a public information source to comment on or disagree with. In most cases, only the largest or best-funded companies would be able to acquire data and analytics; the USDA puts this information into the public domain. The precise estimates provided in news releases/reports aside, the fundamental value of public information from the USDA and associated agencies is a cornerstone of U.S. agriculture and food markets.
U.S. Secretary of Agriculture Sonny Perdue announced on August 9, 2018, that further reorganization of the USDA was to take place (USDA, 2018). The ERS, which was under the REE mission area, was to realign with the Office of the Chief Economist (OCE) under the Office of the Secretary, and most employees of the ERS and NIFA were to be relocated outside the Washington, DC, region. Movement of employees and the agency was expected to be completed by the end of December 2019. The relocation fueled a national argument, with 294 of 315 NIFA staff and 253 of 329 ERS staff told to uproot and move or leave (Bach, 2019).
Agricultural and applied economics has focused on big data analytics as a topic of interest in recent years. Public perceptions and market-related data generated online offer volumes of data for analysis to derive actionable insights. The sociological and technical shifts to user-created Web content (aka Web 2.0) facilitates the generation of social media data, which reflect the work, thoughts, and opinions of a large swath of society. Vast quantities of social media data have been created and companies have used that information to inform marketing campaigns, measure product performance, and/or track sentiment toward a brand, company, or service provider (Carr et al., 2015). With this shift, big data incorporating online media data fits well in the realm of behavioral economics within agricultural and food industries. Today even government agencies and public officials are prominent users of social media, notably Twitter, to convey valuable or even persuasive messaging to the general public.
Social media data allow policy-relevant data collection efficiently and in real time. This analysis employs social media listening to further the understanding of perceptions and sentiment around the USDA in the tumultuous recent past.
| Search terms employed were "United States Department of Agriculture, U.S. Department of Agriculture, US Department of Agriculture, US Dept of Agriculture, USDA, USDA report, USDA reports, #USDA, USDA_ERS, USDA_NASS, USDA_NIFA, #NIFA, NASS, #ERS". |
| Time period studied was September 1, 2017, through September 30, 2019. |
| Data collection took place on October 30-31, 2019. |
| Granularity of data collected was weekly for data of primary focus, including posts, mentions, and net sentiment. |
| Language of posts studied was exclusively those in English. |
| Geographies included were the United States and U.S. Minor Outlying Islands. |
Big data is increasingly diverse, with data originating from varying sources, which confounds questions about the type/form of data with quantity of data but also fundamentally changes what data actually is composed of. “[L]anguage is so important to the Big Data revolution, it deserves its own section. In fact, it is being used so much now that there is an entire field devoted to it: ‘text as data’” (Stephens-Davidowitz, 2017, p. 76). Researchers have been furthering the approach of studying the general sentiment of markets, topics, or searches rather than studying a specific segment. Sentiment analysis attempts to detect and quantify the overall sentiment that is available online, including social media, to attempt to understand how the collective media leans on a topic. Past studies have employed sentiment to study attitudes toward brands and in the context of product development (Carr et al., 2015). Recent works have even moved toward employing sentiment to predict stock prices (Nguyen, Shirai, and Velcin, 2015). The uses of social sentiment are wide and varied yet underappreciated for use within agricultural industries and policy discussions. While value can be derived from online media data, the potential for biases surrounding what individuals post/share being overly positive (to paint oneself in a good light) and posts not reflecting true perceptions still exist, as they do in survey and other self-reported data.
The Netbase social media listening, analytics, and intelligence platform (Netbase, 2019a) was employed to study online posts related to the USDA. To develop a dataset encompassing social media posts referencing the USDA and associated reports/outputs, researchers constructed inclusionary and exclusionary search terms. This was intended to be an exploratory study providing a glimpse into public perceptions of the USDA during a period in which significant public focus was directed at the agency. Search terms intended to be general and broad were employed for this analysis, although future work may wish to focus on specific reports or commodities.
The cultural context of social media posts, in particular those on Twitter where the number of characters in a single post is limited, makes interpretation precarious. Given the intent of this study to focus on U.S. public perceptions of a government agency, data collected and analyzed was limited to the geography of the United States. Account holders on social media platforms may remove or reinstate posts, which leads to fluid data and necessitates succinct data collation with careful recording of when data were downloaded.
A sentiment score was assigned using Netbase’s patented Natural Language Processing engine, which analyzes sentiment for every subject in a sentence (Netbase, 2019b). Net sentiment is a construct of the comparison of positive versus negative posts. The net sentiment presented throughout this analysis is the result of the total percentage of positive posts less the percentage of negative posts, thus resulting in a net sentiment that is necessarily bounded between -100% and +100%. A third category, neutral, although accounted for, is not used in the calculation of net sentiment. Net sentiment, or general positivity/negativity for each of the searches—in addition to the total numbers of posts, mentions, and potential impressions—were all analyzed to provide insight into the scale and tone of conversations around this topic.
To facilitate understanding surrounding what aspects of the USDA were of specific interest in social media chatter over the period studied, three specific subsearches were conducted. Working within the original search, as a sort of subsearch or “drilling down” exercise, additional filters of (i) relocation, relocate, and move, (ii) report, and (iii) World Agricultural Supply and Demand Estimates (WASDE) were explored. The subsearch surrounding relocation necessitated the use of two exclusionary terms upon review of the data collected, a process commonly referred to as “tuning.” Admittedly, there exists a certain amount of noise in web-scraped data, including the baseline chatter on move or relocation that is evident before the announcement in August 2018. The most significant contribution was an article about food stamps and school lunch policies that employed the word “move” to refer to policy changes in late 2018, which resulted in a noticeable spike within that subsearch that was unrelated to the actual relocation (of agencies). Thus, exclusionary terms of “school” and “stamp” were employed to more precisely inform the search algorithm for the relocation subsearch only. The potential for remaining noise captured in the search, such as about rumors of a move, or relocating to work at USDA, occur organically but at a relatively small scale in the dataset. For transparency, all searches are presented for the entire period studied to allow the reader to discern the baseline of chatter and interpret relative shocks or movements following announcements or other events.
| Base Search | Filtered for "Relocation" "Relocate" and "Move" | Filtered for "Report" | |
| Mentions (n) | 2,751,818 | 108,202 | 320,315 |
| All posts (n) | 1,973,899 | 82,812 | 221,739 |
| Potential impressions (n) | 90,405,686,048 | 3,809,880,915 | 14,308,223,930 |
| Mean net sentiment | |||
| September 2017- September 2019 (%) | 24 | -7 | -3 |
| Posts by day of week (n) | 263,970 | 2,280 | 15,100 |
| Monday (%) | 15 | 18 | 15 |
| Tuesday (%) | 19 | 47 | 20 |
| Wednesday (%) | 16 | 8 | 14 |
| Thursday (%) | 20 | 9 | 20 |
| Friday (%) | 15 | 11 | 13 |
| Saturday (%) | 8 | 3 | 4 |
| Sunday (%) | 7 | 3 | 14 |
| Top 10 domains (n) | 1,358,599a | 108,202b | 320,315c |
Notes: Top 10 domains are:
a twitter.com, reddit.com, morningagclips.com, agweb.com, instagram.com,
barchart.com, agfax.com, feedstuffs.com, usagnet.com, brownfieldagnews.com
b twitter.com, reddit.com, agweb.com, feedstuffs.com, politico.com,
agri-pulse.com,farmprogress.com, agfax.com, morningagclips.com, dtnpf.com
c twitter.com, barchart.com, agweb.com, agfax.com, feedstuffs.com,
farmprogress.com, agriculture.com, morningagclips.com, brownfieldagnews.com,
community.agriculture.com
Employing the methodology described, a total of 2,751,818 mentions, with 1,973,899 posts, resulting in 90,405,686,048 potential impressions were identified for the September 2017 through September 2019 timeframe. Potential impressions are most familiar in the context of Twitter, where the number of possible times it was viewed is a commonly reported metric. Of the 2,751,818 total mentions of the USDA, 304,462 had discernable sentiment, of which 116,568 (38%) mentions were negative and 191,938 (62%) were positive. Thus, the net sentiment, calculated as the percentage of positive posts less the percentage of negative posts for the search conducted, was 24%. The subsearch conducted about relocation yielded a total of 108,202 mentions, while the subsearch on reports yielded 320,315 mentions. Table 1 summarizes the results for the general/base search as well as the two main subsearches conducted. Total number of posts and mentions are commonly regarded as measures of quantity, in terms of how often the topic was talked about or mentioned. Beyond summary statistics for the searches as a whole, breakdowns of when (days of week) and where (domains) media originated are presented. Twitter was the top domain for the general search and for the two subsearches. Some variation among domains is evident in the subsearches, with politico.com appearing for the relocation subsearch but not for the other searches shown.

Figure 1 displays weekly mentions for the general/base search and subsearches. The relocation subsearch yielded 4% of the total mentions about USDA (weekly minimum of 1% to maximum of 34% the week of July 14, 2019). For comparison, the reports subsearch had 12% of the total mentions of the base search (weekly minimum of 5% to maximum of 32%). The week of August 4, 2019, 26% of total mentions about the USDA were in the subsearch devoted to relocation, showing the real-time uptick in public focus about relocation. Reports are released constantly over the whole period, whereas relocation was only a topic beginning in Summer 2018. The volume of chatter devoted to relocation post-announcement is not only measurable/visible but also practically meaningful, even relative to reports, which are major public-facing products of the agency.
| Positive (n=87,244) | Negative (n=65,375) | ||
| Help | 14% | Hide unfavorable safety data | 12% |
| Grant | 8% | Experiment on kitten | 12% |
| Organic | 8% | Death to animal | 11% |
| Create adoption program | 7% | Result in death | 11% |
| Announce support | 6% | Suspend data collection | 10% |
Beyond the metrics quantifying total chatter, the net sentiment in terms of comparison of positivity versus negativity is important to understanding public perception. Looking at the general/base USDA search, positive terms driving sentiment were unsurprising, including terms like “help” (accounting for 14% of positive/like terms) and “announce support” (6%). Negative terms surrounded animal welfare, mentioning experimenting on animals and animal death among the top terms. The fifth top negative term, accounting for 10% of dislikes mentioned was “suspend data collection” which highlights the importance of the USDA as a public data source. It is particularly notable that “suspend data collection” appeared as a top sentiment driver in the base search, as no additional search filters beyond the base search terms reported were employed to direct attention to this aspect of the USDA; this concern arose naturally.
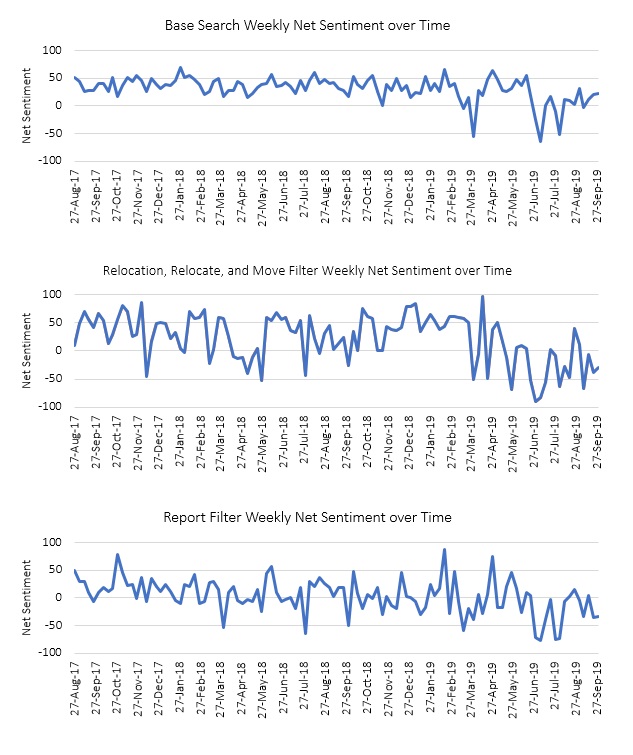
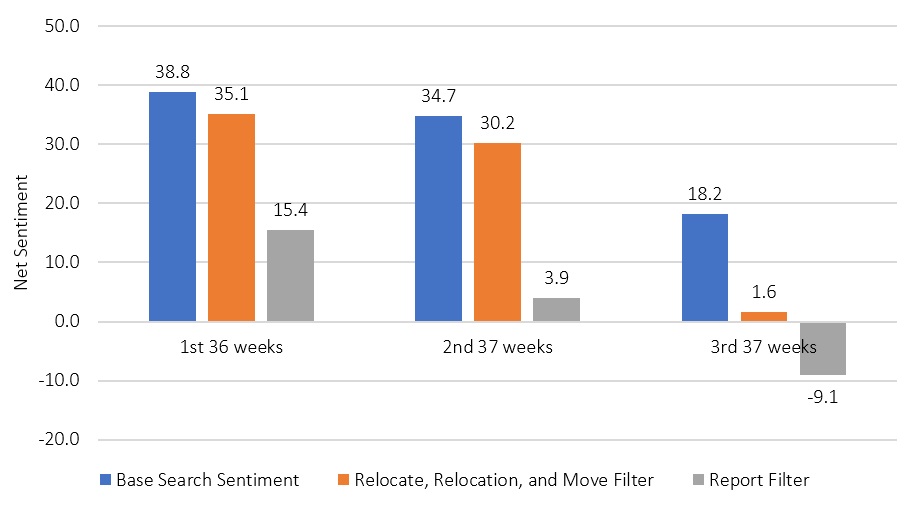
Figure 2 displays the net sentiment for the base search and both subsearches, employing weekly data. Variability of net sentiment increased in 2019 relative to the earlier period shown. To simplify interpretation of trends in net sentiment over time, the September 2017 through September 2019 period was broken into thirds; Figure 3 shows the mean net sentiment for each. Net sentiment trended downward over time in the subsearch dedicated to relocation, which was expected due to talk about loss of talent associated with the move and impacts on human resources. The reports subsearch also decreased over the period studied, which could be attributable to the difficult farm economy being faced in 2019; in many cases, the reports themselves bring important (yet perhaps not desired) news. Further, negativity about the move or other aspects of USDA could easily be showing up in media mentioning reports. Further interpretation about the sentiment surrounding USDA reports would require additional study and tuning of searches for individual reports.
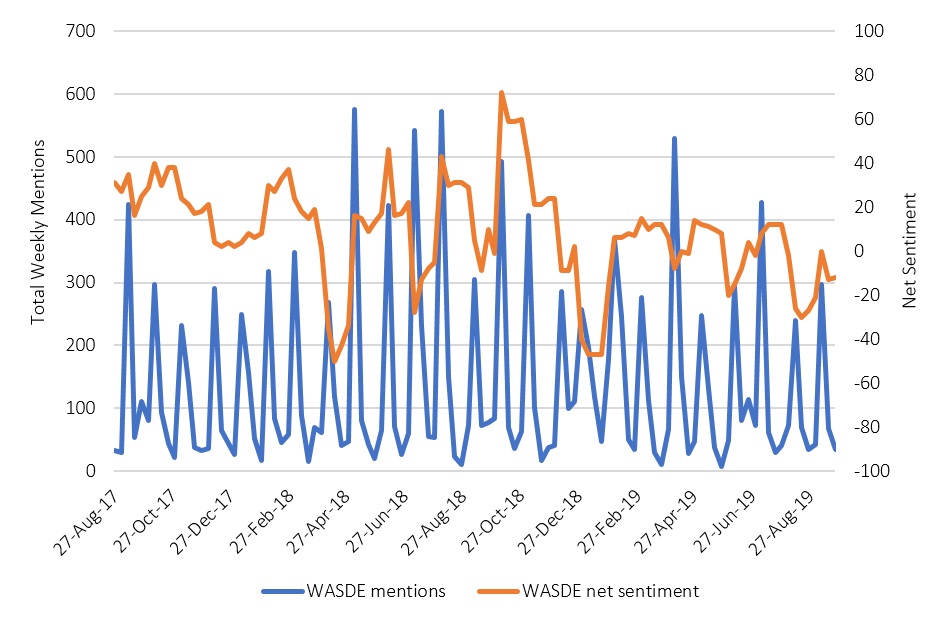
While the analysis presented serves as a high-level study on sentiment surrounding USDA, it is entirely possible to conduct tailored, marketing-style analyses to understand demand for and/or perceptions of specific products of the USDA (e.g., the WASDE report, which appears often in the top reports). In the reports subsearch, 74% of the spike in mentions (Figure 1) on August 12 was due to posts about the August 12, 2019, WASDE report. The mentions dedicated to the WASDE along with specific net sentiment are quantified in Figure 4 to provide an example of the product-specific assessment possibilities for further research. While no known baseline of chatter about individual reports exists with which to compare this WASDE-specific analysis, the relative movement within the search in terms of mentions and net sentiment are widely regarded as a starting point for online media analytics.
Net sentiment about USDA agency relocation trended downward, which was expected due to talk about impacts on human resources and the agency’s stakeholders. This analysis offers evidence of concern about the policies/changes in the public realm. Social media analytics for agricultural research and public goods is underutilized. As food and agricultural policy continues to evolve with social/public influence shaping those conversations, using social sentiment and social media listening to improve understanding of perceptions and preferences for policy-relevant agricultural topics should be explored. Critical agricultural research conducted in the public domain to “level the playing field” (particularly surrounding data availability) to some minimum acceptable level has allowed U.S. agriculturalists to engage in the worldwide marketplace in ways that would not have been possible otherwise. The approach demonstrated illustrates one (of many) potentially underappreciated ways of analyzing data; tools for studying text as data can, and perhaps should, be employed when making decisions about the public goods on which we all rely.
Bach, N. 2019, July 17. “USDA Faces Exodus of Scientists as Employees Are Forced to Move to Kansas City.” Fortune.com. Available online: https://fortune.com/2019/07/17/usda-employees-kansas-city-relocation/ [Accessed October 30, 2019].
Carr, J., L. Decreton, W. Qin, B. Rojas, T. Rossochacki, and Y. Yang. 2015. “Social Media in Product Development.” Food Quality and Preference 40: 354–364.
Hennessy, D. 1996. “Information Asymmetry as a Reason for Food Industry Vertical Integration.” American Journal of Agricultural Economics 78: 1034–1043.
Hobbs, J. 2014. “Information Asymmetry and the Role of Traceability Systems.” Agribusiness: An International Journal 20(4): 397–415.
Nassirtoussi, A.K., S. Aghabozorgi, T.Y. Wah, and D.C. Ngo. 2015. “Text Mining of News-Headlines for FOREX Market Prediction: A Multi-Layer Dimension Reduction Algorithm with Semantics and Sentiment.” Expert Systems with Applications 42: 306–324.
Netbase. 2019a. About NetBase. Retrieved from. https://www.netbase.com/about-netbase/. Accessed 10/30/2019.
Netbase. 2019b. Natural Language Processing. Retrieved from. https://www.netbase.com/natural-language-processing-nlp/. Accessed 10/30/2019.
Nguyen, T.H., K. Shirai, and J. Velcin. 2015. “Sentiment Analysis on Social Media for Stock Movement Prediction.” Expert Systems with Applications 42(24): 9603–9611.
Stephens-Davidowitz, S. 2018. Everybody Lies: Big Data, New Data, and What the Internet Can Tell Us about Who We Really Are. New York, NY: William Morrow & Co.
U.S. Department of Agriculture. 2018. “USDA to Realign ERS with Chief Economist, Relocate ERS & NIFA Outside DC.” Washington, DC: U.S. Department of Agriculture, Press Release 0162.18.
U.S. Department of Agriculture. 2019a. About USDA. Washington, DC: U.S. Department of Agriculture. Available online: https://www.usda.gov/our-agency/about-usda [Accessed 10/30/2019].
U.S. Department of Agriculture. 2019b. About ERS. Washington, DC: U.S. Department of Agriculture, Economic Research Service. Available online: https://www.ers.usda.gov/about-ers/ [Accessed 10/30/2019].
U.S. Department of Agriculture. 2019c. About NASS. Washington, DC: U.S. Department of Agriculture, National Agricultural Statistics Service. Available online: https://www.nass.usda.gov/About_NASS/index.php [Accessed 10/30/2019].
U.S. Department of Agriculture. 2019d. About NIFA. Washington, DC: U.S. Department of Agriculture, National Institute of Food and Agriculture. Available online: https://nifa.usda.gov/about-nifa [Accessed 10/30/2019].

