To vitalize rural America and improve rural life, the Morrill Act of 1862 and 1890 established land-grant universities and colleges (LGU) to educate citizens in agriculture, home economics, and other practical professions. In 1908, President Theodore Roosevelt appointed a Commission on Country Life to “make rural civilization as effective and satisfying as other civilization” (Bailey, 1920). Based on the Commission’s recommendation of a nationalized extension service, and built upon the pre-established LGU system, in 1914, the Smith-Lever Act created a unique U.S. agricultural Cooperative Extension System (extension). The extension system established a partnership among a federal partner (the U.S. Department of Agriculture (USDA)), state partners (LGU and state governments), and local partners (city or county governments). Today, the USDA’s National Institute of Food and Agriculture (NIFA), which was created through the Food, Conservation, and Energy Act of 2008 to replace its predecessor—Cooperative State Research, Education, and Extension Service (CSREES), provides annual grants—including formula funds based on population-related formulas and funds for specific programs—to LGU. States are requested to match this formula portion of federal funding. In addition to this major grant, NIFA also provides competitive funding to award projects that target USDA’s priority mission areas.
Since it was first established 100 years ago, extension has played critical roles in various time periods, including World War I, the Great Depression, and World War II. It helps to secure national food and fiber needs through education, marketing, and organization. It also has helped USDA implement its main objectives in developing the rural economy, training tomorrow’s leaders, disseminating knowledge, and pursuing sustainable agriculture and the environment since WWII. Although the contribution of extension to the farm economy seems to be straightforward, the economic benefit of extension is not easy to quantify. In addition, there has been an ongoing tension in extension regarding its focus on agriculture versus its role for broader rural development (Bishop, 1969).
According to USDA’s agricultural productivity estimates in 2011, total U.S. agricultural production was more than 2.5 times its 1948 level with inputs growing by a mere 4% between 1948 and 2011 (USDA Economic Research Service (ERS), 2013). Therefore, productivity growth accounted for nearly all of agricultural output growth in the period 1948 to 2011. While research and development (R & D) investment is the major driver of productivity growth (Alston et al., 2000; Evenson, 2001; Huffman and Evenson, 2006; Fuglie and Heisey, 2007; and Wang et al., 2013), the new technology or practice cannot have its intended impact if farmers do not adopt those skills or techniques. It is widely agreed that extension has played an important role in disseminating new technology and bridging the gap between innovation in the lab and practice on the farm (Huffman, 1976; Feller, 1987; Birkhaeuser, Evenson, and Feder, 1991; and Ahearn, Yee, and Bottom, 2003).
The U.S. extension system has changed over time in terms of its budget, funding composition, and extension staffs’ program focus.
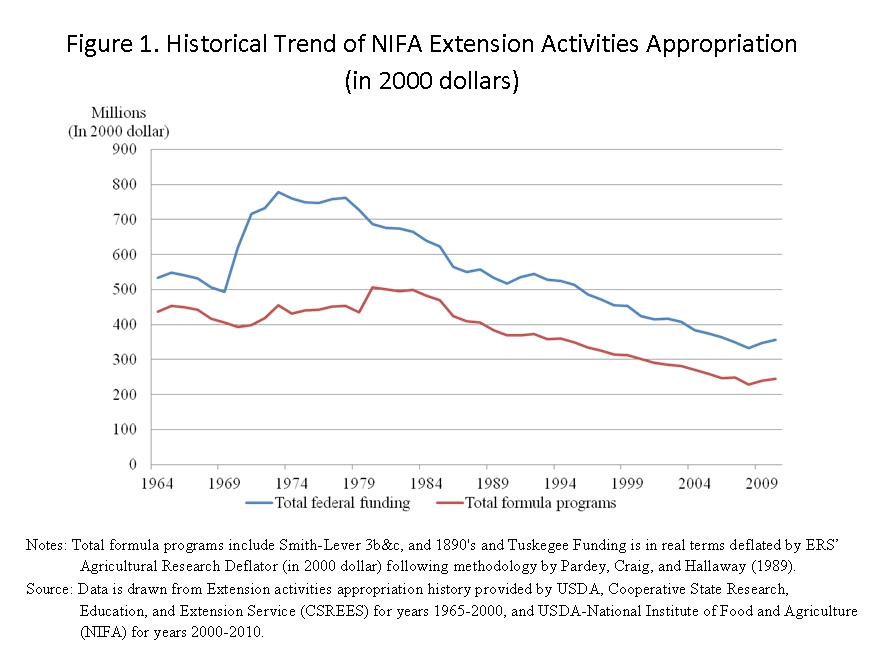
Over the years, nominal (in current dollars) federal extension appropriation has continued to grow, while real total federal extension funding (in inflation-adjusted dollars using ERS’s research price index as the deflator (ERS, 2013)) as well as the real formula funding have declined since 1980 (Figure 1). The share of formula programs as a proportion of federal funding has also been reduced. In 1964, the formula programs accounted for more than 80% of total Federal Extension appropriation; this share shrunk to below 70% by 2010.
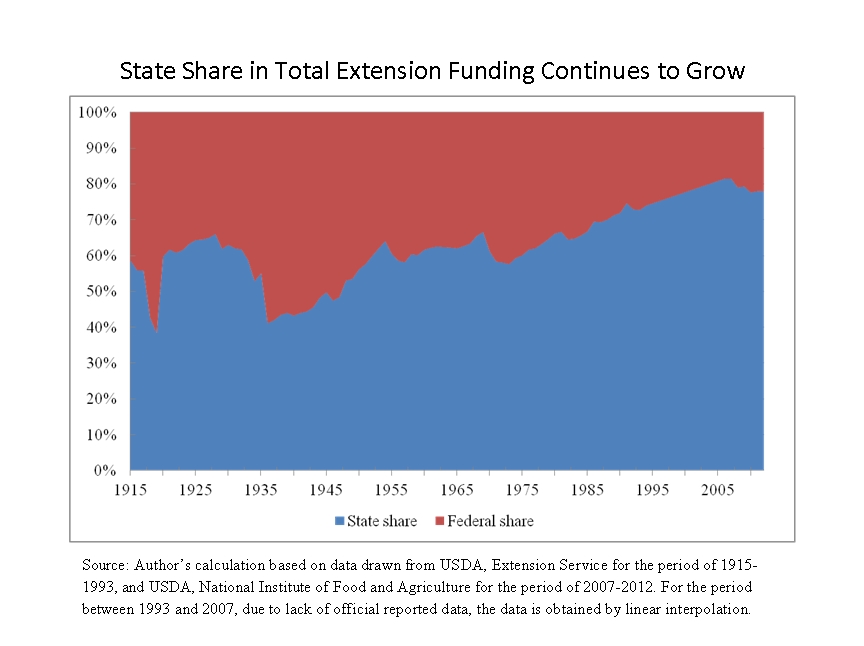
Under the Cooperative Extension System, in addition to federal funding, state and local governments also provide funding to LGU to support extension activities. The state’s role in funding extension has continued to grow since 1936 after a decline between 1928 and 1935 (Figure 2). In 1928, total funding by the states accounted for 66% of the total extension budget. By 1936, this share declined to 41%. Since 1936, the share of total funding from the states continued to grow except for declines in a few short periods, including an energy shock period of 1969-1973. In recent years, overall state funding has grown to account for about 80% of the total extension budget. While the state’s role in funding extension has become increasingly important, the total extension spending as well as total number of extension full-time-equivalent (FTEs) staff people are quite diverse across regions.
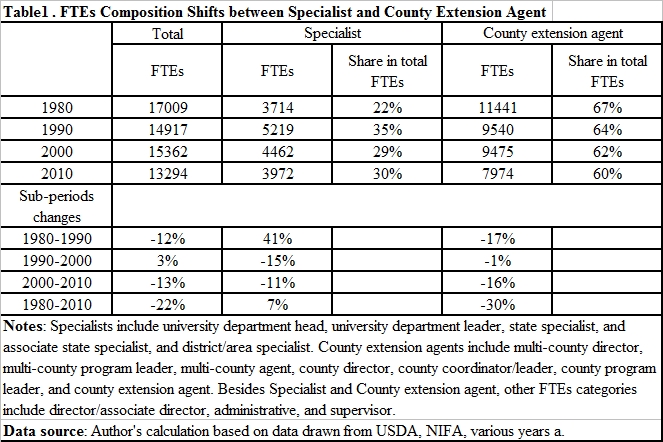
According to USDA’s “Salary Analysis of Cooperative Extension Service Positions” report, the number of extension FTEs declined between 1980 and 2010 (Figure 3). However, the changes are unevenly distributed between specialists and county extension agents. They are also different among the 10 USDA production regions. Feller (1987) addressed concerns over the uneven decline in the numbers of specialist and county agents as the former shrank much faster than the latter between 1975 and 1984. He cited Congress’ Office of Technology Assessment (OTA) that the decline of specialists was particularly alarming “since the specialist staff has the largest level of training and is the best equipped to educate both county agents and farmers on evolving agricultural technologies," and indicated that “Extension has opted to protect county agents rather than extension specialists.” Yet this trend seemed to be reversed between 1980 and 2010. In 1980, the number of FTEs for specialists and county agents were 3,714 and 11,441, respectively, accounting for 22% and 67% of total FTEs. In 2010, the number of specialist FTEs increased to 3,972 while that of the county agents declined to 7,974, accounting for 30% and 60% of total FTEs, respectively (Table 1). Most of the increase in the number of specialist FTEs occurred during the 1980-1990 period. This trend may have been a response to an adjustment made to address concerns from Congress as well as the public. However, the total specialist FTEs still declined along with county agents in the two decades thereafter, adjusting to overall budgetary constraints. The split appointments among extension, research, and teaching, and nine-month appointments made has also been considered as one of the factors causing the declining trend in specialists.
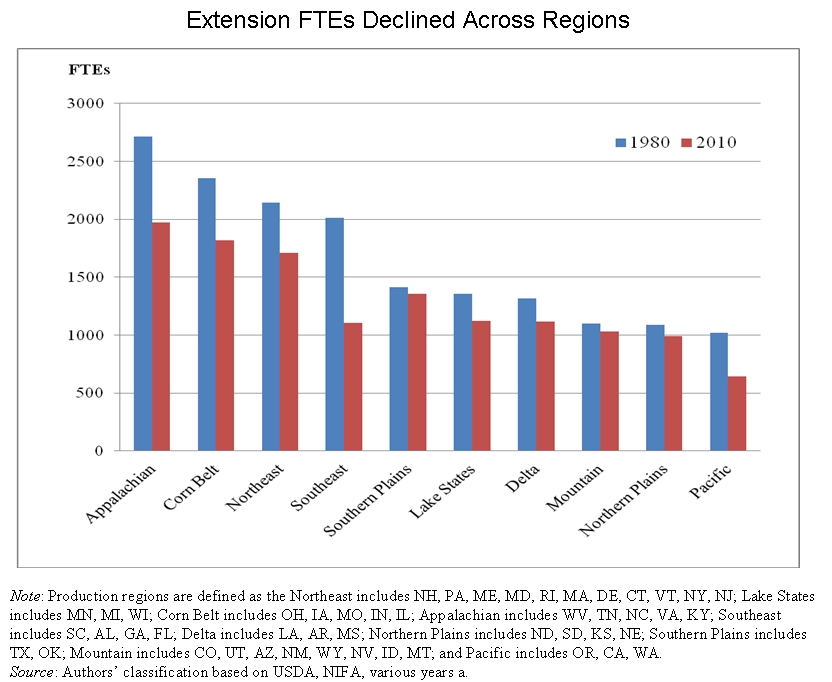
While the Appalachian, Corn Belt, and Northeast regions have more extension FTEs than all other regions and remained in the top three in both 1980 and 2010 (Figure 3), their total FTEs still declined considerably along with that of all other regions. The Southeast region, including South Carolina (SC), Alabama (AL), Georgia (GA), and Florida (FL), experienced a much more significant 45% decline in its total FTEs. Its FTEs’ ranking has, therefore, dropped from fourth place in 1980 to seventh place in 2010, surpassed by the Southern Plains, Lake States, and Delta regions. The Pacific region, including Oregon (OR), California (CA), and Washington (WA), had the least FTEs among the 10 regions in both 1980 and 2010.
USDA-NIFA identifies national priorities for the extension programs, while funding allocations are still up to each individual university. In addition to formula programs, NIFA also provides competitive grants to LGU to attract proposals that best address NIFA’s priority topics. Formula funding, on the other hand, is more flexible and to be used in addressing regional or state’s priority subjects and emerging issues. With various budget conditions and priority preferences, extension program portfolios differ from one region to another.
Since extension program areas have changed over time, there is no single classification method that can be used over long periods. For the period between 1977 and 1992, Ahearn, Yee, and Bottom (2003) showed that the program area “Agriculture and Natural Resources” ranked first among four major program areas and accounted for about 45% of total FTEs. On the other hand, many FTEs have shifted from 4-H and youth, and community programs to home economics program over time. In 1992, 26% of total FTEs were dedicated to home economics programs, which had a 22% share in 1977. After the Agricultural Research, Extension, and Education Reform Act of 1998 (AREERA) required that states submit plans of work (POW) in order to receive federal funding, the program areas have shifted along with changes to NIFA’s reporting system. Therefore, data for the previously reported major program areas no longer exist. Nevertheless, NIFA’s POW reporting system could help to provide information on extension program portfolios across regions in more recent years.
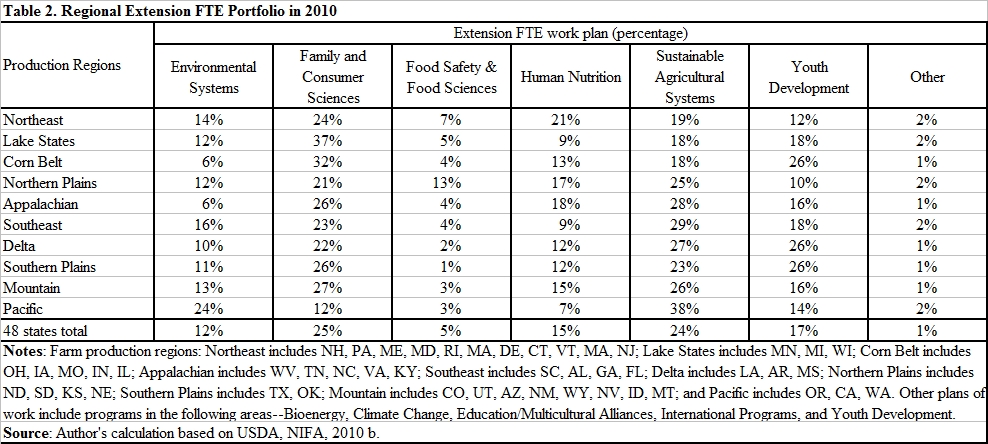
According to reported POWs, in 2010, for the 48 contiguous states, most FTEs were dedicated to sustainable agricultural systems and the family and consumer sciences areas, which accounted for about a quarter each of total FTEs. Youth development was the third largest component reported in POWs, accounting for 17% of total extension activities in 2010. Nonetheless, each state has its own goals and extension priorities. Among the 10 regions, the Lake States and Corn Belt dedicated about one-third of their total FTEs to the family and consumer sciences area, with less than one-fifth of their total FTEs dedicated to the sustainable agricultural systems. On the other hand, the Pacific region dedicated nearly 40% of its total FTEs to the sustainable agricultural systems area and only 12% to the family and consumer sciences area (Table 2). For the Corn Belt, Delta, and Southern Plains regions, more than a quarter of their extension FTEs were dedicated to the youth development program while that share in other regions only ranged from 10% to 18%.
U.S. agriculture has experienced structural changes in the past few decades. Studies show that U.S. farmers have relied more heavily on contracting with food processors to allow risks to be spread over a wider set of stakeholders (the value of production under contract increased roughly 10 percentage points between 1991 and 2007 (O’Donoghue et al., 2011). There was also a shift of production to larger farm operations. The long-term shifts in farm size have been accompanied by greater specialization—beginning with a separation of livestock farming from crop farming (MacDonald, Korb, and Hoppe, 2013). Along with these changes, private firms have played an increasing role in providing production-related information to farmers, such as pest management and other chemical usage (Padgitt et al., 2000). Still, the public extension system is unique in providing a multi-functional portfolio of programs as a public good.
Although it is widely agreed that extension has played an important role in disseminating new technology, given a smaller budget relative to R&D it is difficult to quantify extension’s economic benefit or separate it from that of R&D and other local resources. Its economic impact is also restricted by its local extension capacity.
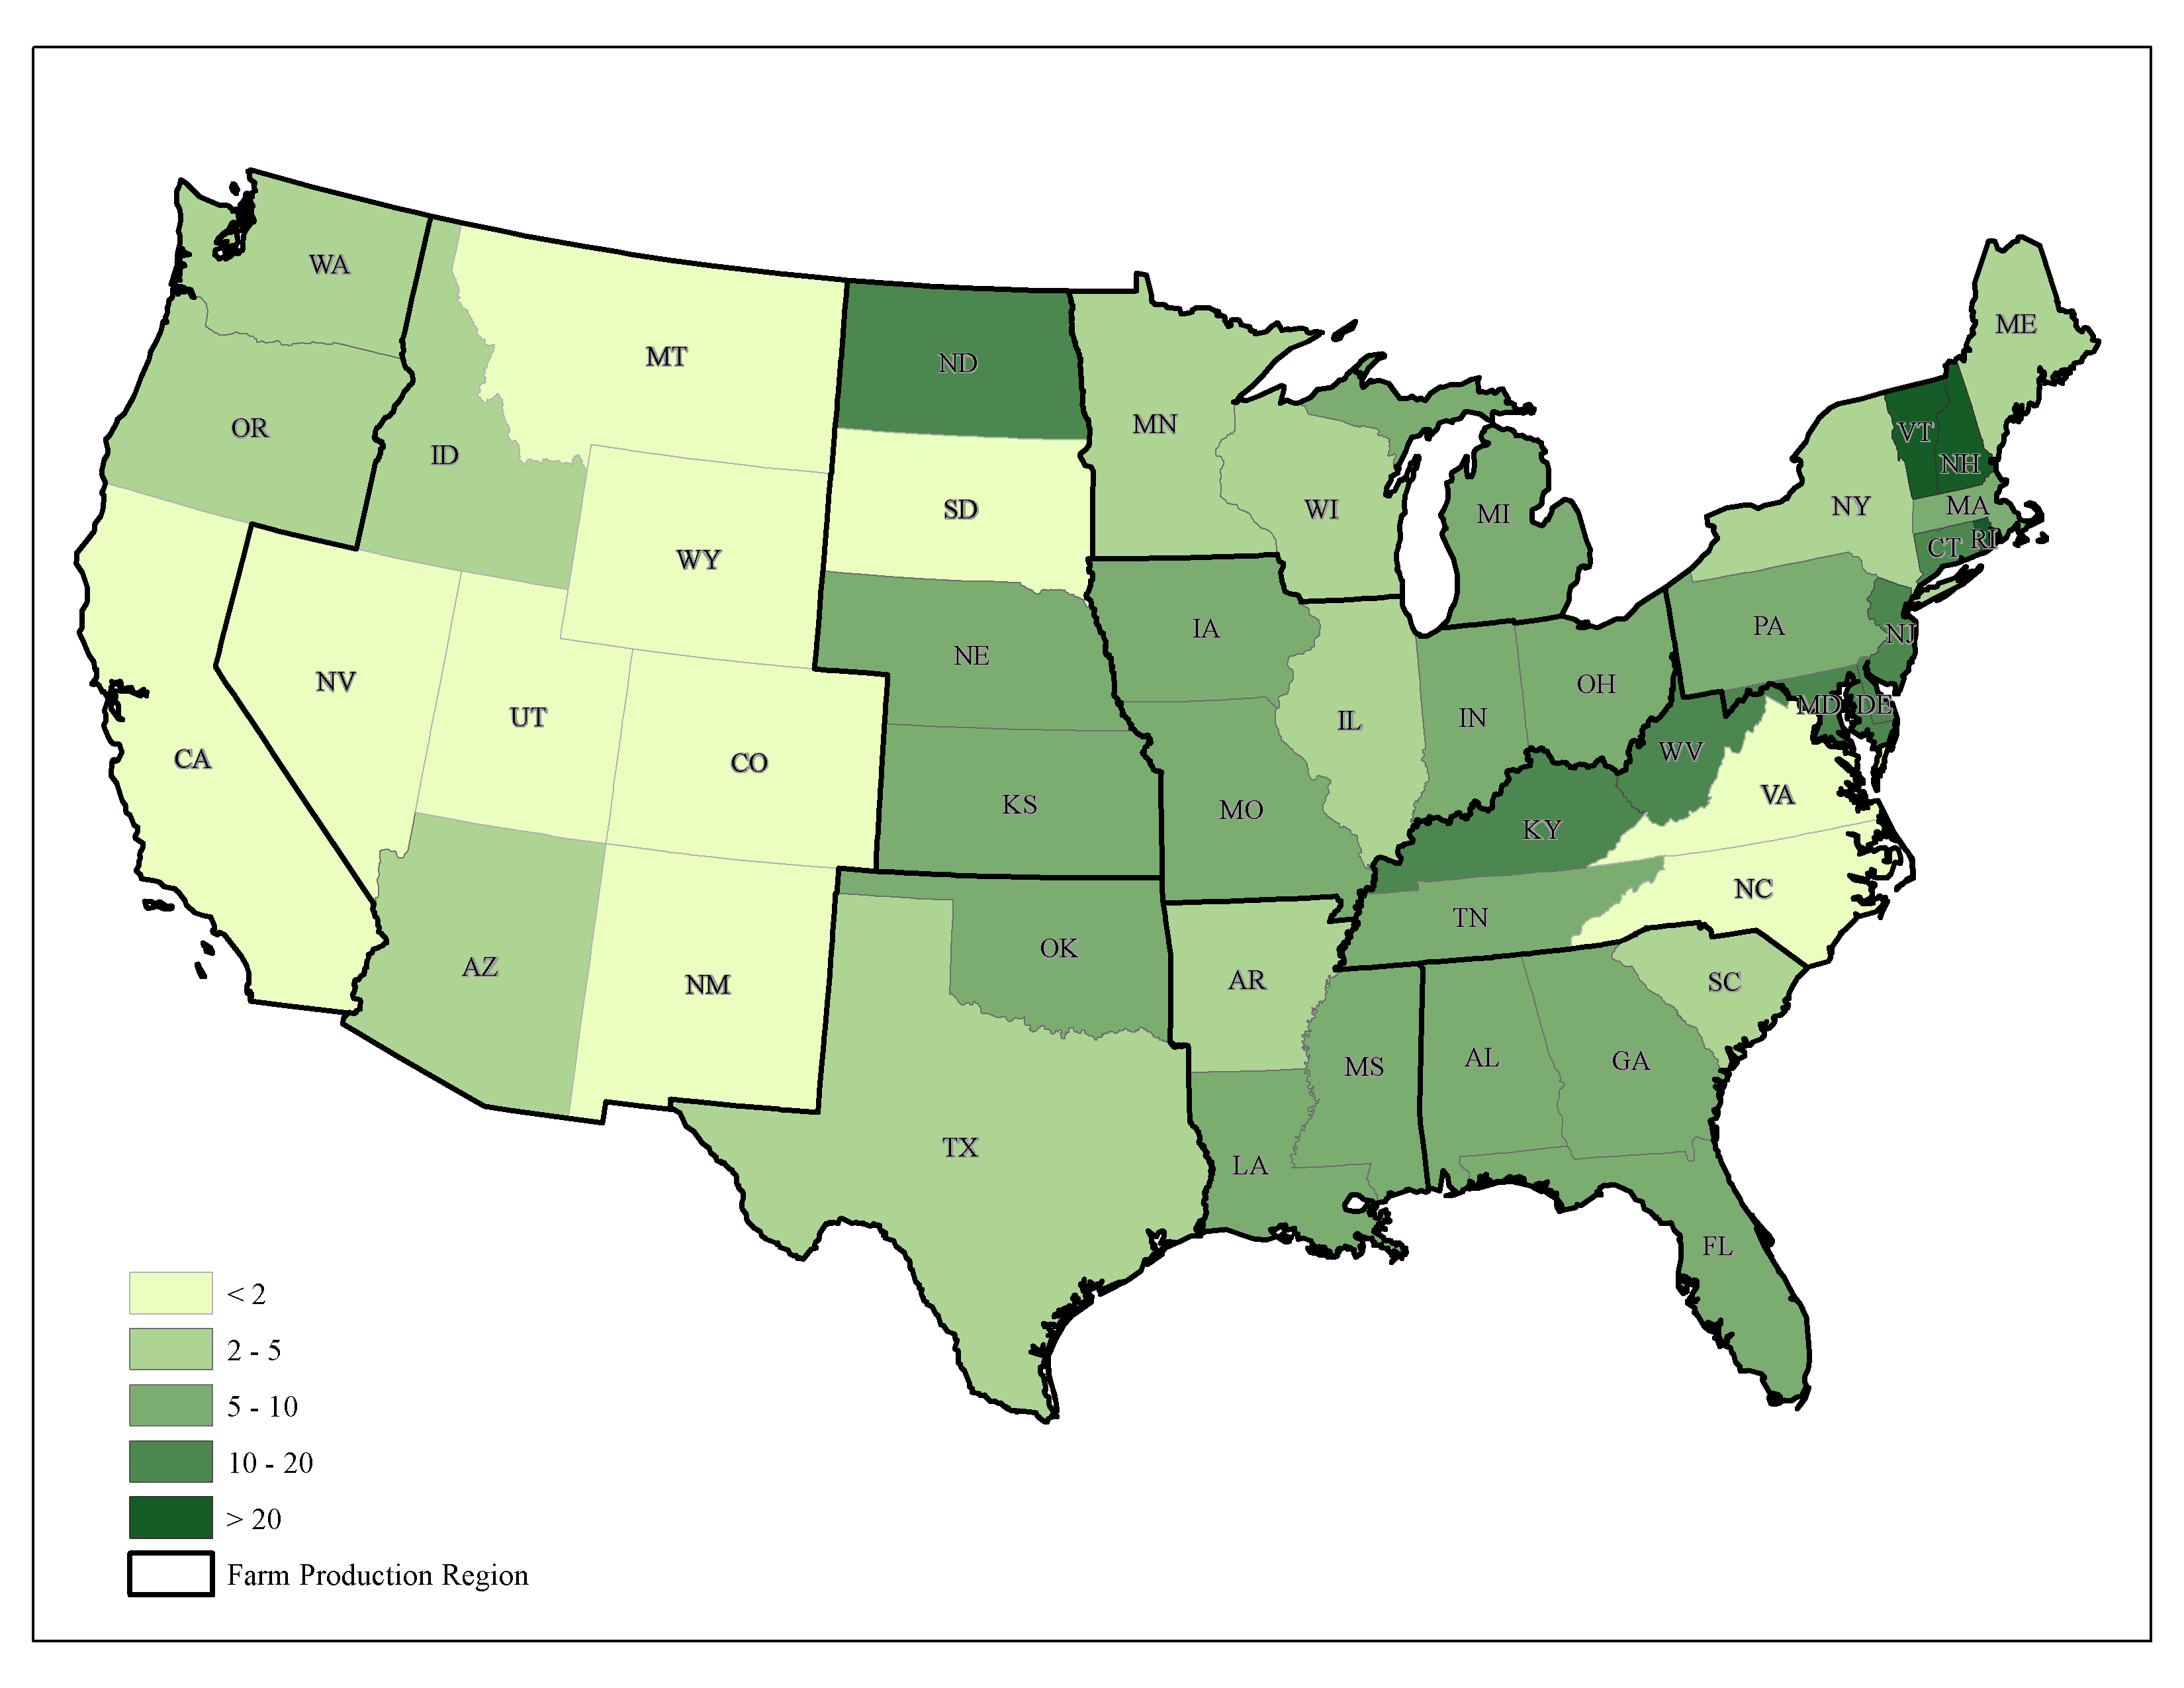
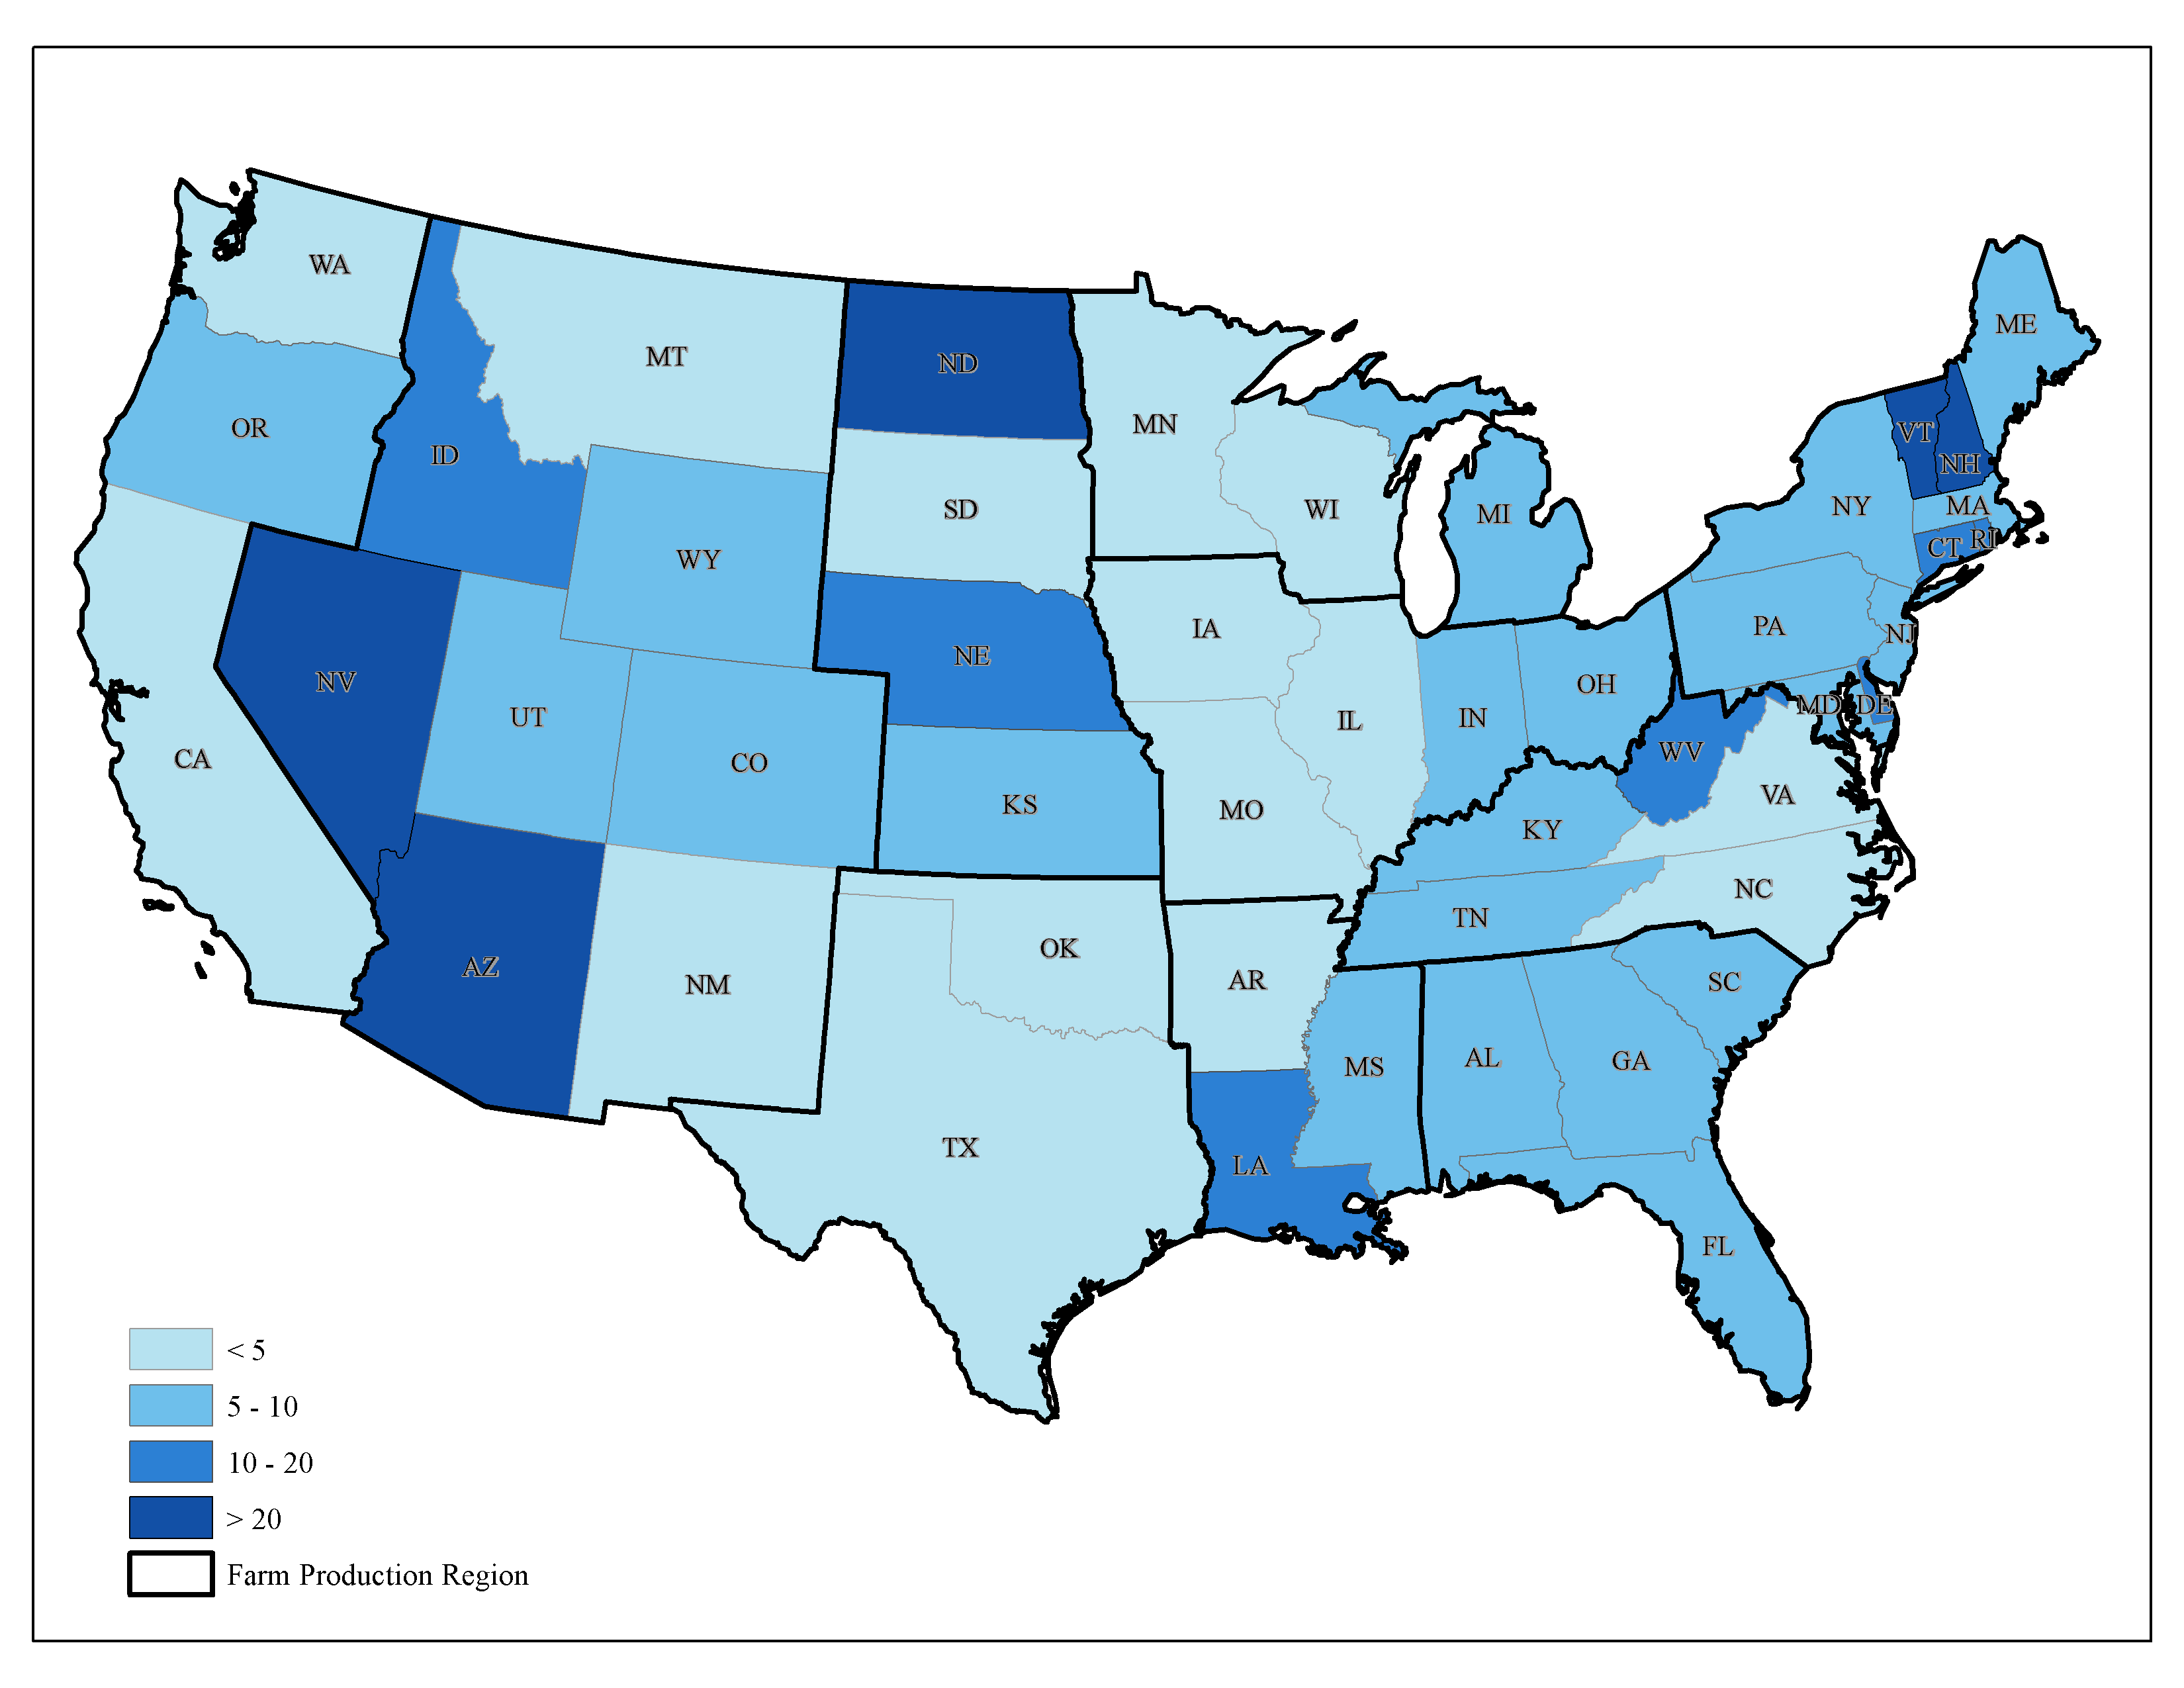
Historically, extension has been authorized and expected to play a leading role in assisting the diffusion of information in farm practice and home economics to improve agricultural productivity; promote better human nutrition and health; strengthen children, youth, and families; revitalize rural American communities; and much more. Yet, the economic performance of extension is difficult to evaluate given the unique nature of extension as a public good, an educational system, and an information communicator. Its performance is also subject to extension density. For a certain amount of FTEs, extension with higher FTE density could be more productive in reaching out to people. FTE density could be measured by FTEs per number of farms, FTEs per thousand square land miles, or even FTEs per million dollar sales. It depends on the purpose of the measurement. In 2010, based on the criteria of FTEs per thousand square land miles (Figure 4, Panel A), states in the Mountain and Pacific regions had much lower Extension density than states in other regions given the territory’s wide range. South Dakota (SD), Virginia (VA), and North Carolina (NC) are the only three states with the lowest extension density outside of most states in the Mountain and Pacific regions. Yet, based on the criteria of FTEs per thousand farms (Figure 4, Panel B), Nevada (NV), Arizona (AZ), and Idaho (ID) from the Mountain region are among the highest extension density states. Other high extension density states include North Dakota (ND) and Nebraska (NE) from the Northern Plains; Louisiana (LA) from the Delta region; West Virgina (WV) from the Appalachian region; and Vermont (VT), New Hampshire (NH), Connecticut (CT), and Rhode Island (RI) from the Northeast region.
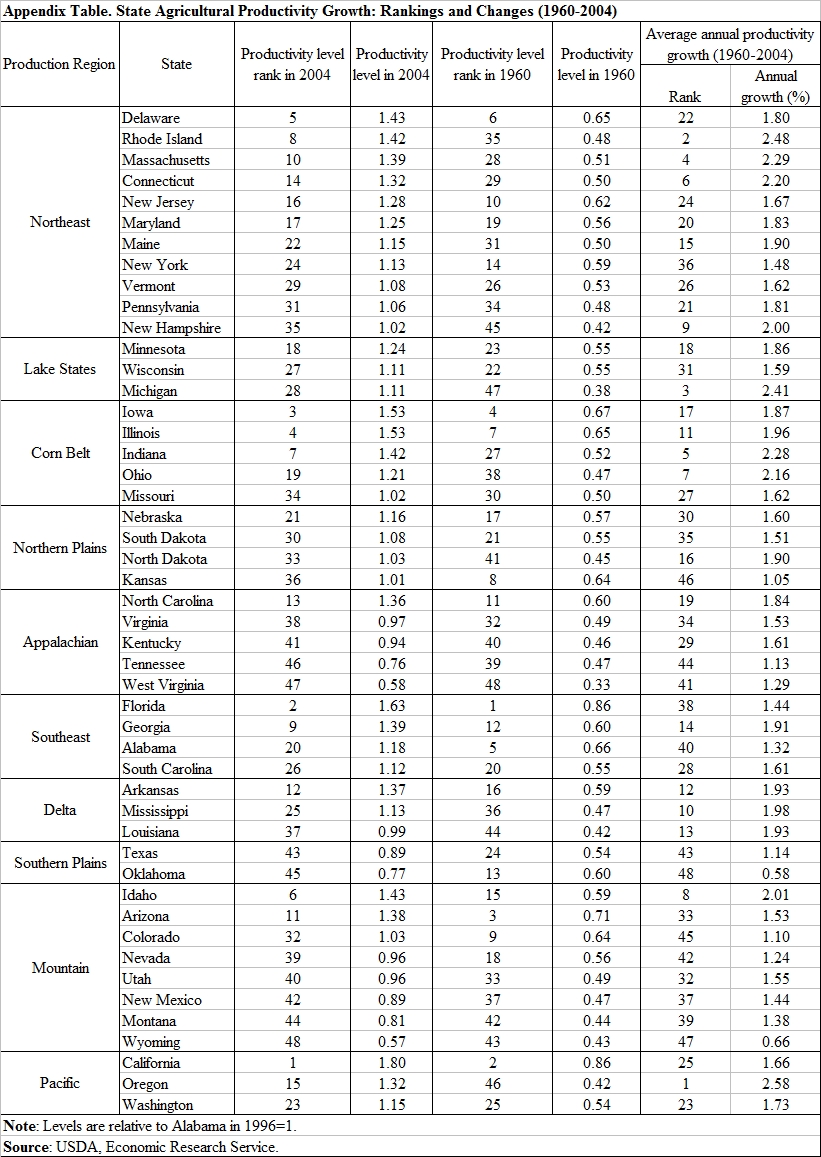
Besides extension density, there are other local resources, such as R&D or infrastructure, which could influence extension capacity and hence its economic performance. With a combined effect from extension and those local resources, each state and region could perform differently in their agricultural productivity growth, and rural community development. Indeed, as shown in the Appendix table for the 48 contiguous states for 1960 and 2004, there were only three states—California (CA), Florida (FL), and Iowa (IA)—that were ranked in the top four by productivity level in both 1960 and 2004. On the other hand, with extraordinary productivity growth, some states have significantly improved in their ranking between 1960 and 2004. For example, during the 44-year period, Michigan (MI), Oregon (OR), Rhode Island (RI), Massachusetts (MA), and Indiana (IN) were among the top five states with the highest productivity growth rates. In 1960, each had a ranking of 47, 46, 35, 28, and 27, respectively, and performed at rankings of 28, 15, 8, 10, and 7 by 2004. While productivity growth is mainly driven by innovation from R&D, it can also be affected by infrastructure and extension (Paul et al., 2007; and Wang et al., 2012). Therefore, when measuring the economic performance of extension we need to be cautious about distinguishing its contribution from other factors.
While the contribution of extension to disseminating technology, shortening the period of technology adoption, bridging the gap between findings in the lab and practices on the farm, and enhancing the return of research funding are widely agreed upon, only in recent decades have researchers tried to quantify the economic impact of U.S. agricultural extension by identifying its independent influences and untangling its combined impacts with other sources. NIFA has designed an extension performance evaluation system based on desired outcomes and program areas. The indicators include the number of people reached, number of preferred tasks implemented, number of policy changes, number of environmental changes, and so on (USDA-NIFA, various years). Those outcomes and evaluation results could help to direct LGU and other local partners in implementing USDA’s goals and performing extension activity more efficiently.
From a different aspect, researchers have tried to measure the economic benefit for U.S. agricultural extension using either a combined research and extension capital stock (the accumulation of investment in R&D and extension based on different assumptions on their lagged impacts in each time period) (Alston et al., 2010 and 2011), or by creating separate variables for R&D stock and extension stock to analyze individual economic impacts from each (Huffman and Evenson, 1993; and Yee et al., 2002). There are also studies evaluating extension’s contributions from the aspect of its interaction with local research capital stock (Wang et al., 2012) or its impacts on production efficiency (Schimmelpfennig, O’Donnell, and Norton, 2006). According to the literature, the economic impacts of extension can be summarized into two main points:
Under the Cooperative Extension System, extension has helped improve agricultural productivity growth, strengthen the rural economy, educate youth, promote better human health, sustain the environment, and much more since 1914. Yet, the priorities of extension's mission have varied through time and among states and regions. While extension is built on a unique partnership among federal, states and local governments, and LGUs, over the past decades, extension funding has relied more heavily on sources within the states. Extension funding in constant dollars has declined and led to the number of extension FTEs declining significantly over time and across regions. Given the downsized extension, its program portfolio has changed to address the evolving priorities of extension missions and in adjusting to tightening budget constraints.
U.S. agriculture continues to experience structural and organizational changes. Over time, farmers have relied more heavily on contracting to manage their risk and agricultural production has shifted to larger and more specialized farm operations, while the number of small farms has grown. Although private firms have played an increasing role in providing production-related information to farmers along with those structural changes, the public extension system still has its irreplaceable role of providing a multi-functional array of programs as a public good.
The economic benefit and return on investments of extensions are not easy to measure nor to be distinguished from those of public research funding and other local resources. Yet extension’s overall contribution to agricultural productivity growth has been well recognized. Nevertheless, there are challenges awaiting extension in its second century, including the changing roles between state specialists and county agents, budget constraints, and emerging issues—such as climate changes’ impact on production, and greenhouse gas emissions, as well as its focus on agriculture versus a broader role addressing rural development, youth, and human health and nutrition.
Ahearn, M., Yee, J. and Bottom, J. (2003). Regional trends in extension system resources. Washington, D.C.: U.S. Department of Agriculture, Economic Research Service. Agricultural Information Bulletin No. 781.
Alston, J., Chan-Kang, C., Marra, M., Pardey, P. and Wyatt, T. (2000). A meta-analysis of rates of return to agricultural r&d: ex pede herculem? Research Report No. 113, International Food Policy Research Institute, Washington, D.C.
Alston, J.M., Anderson, M.A., James, J.S., and Pardey, P.G. (2011). The economic returns to U.S. public agricultural research. American Journal of Agricultural Economics 93:1257-1277.
Alston, J.M., Anderson, M.A., James, J.S., and Pardey, P.G. (2010). Persistence pays: U.S. agricultural productivity growth and the benefit from public r&d spending. New York, N.Y.: Springer.
Bailey, LH. (1920). The country-life movement in the United States. The Macmillan Company, New York.
Ball, E., San-Juan-Mesonada, C., and Ulloa, C.A. (2013). State productivity growth in agriculture: catching-up and the business cycle. Journal of Productivity Analysis. July.
Bishop, C. E. (1969). Urbanization of rural America alters extension responsibilities. Journal of Cooperative Extension. Fall.
Birkhaeuser, D., Evenson, R.E., and Feder, G. (1991). The economic impact of agricultural extension: a review. Economic Development and Cultural Change, 39, 607-650.
Evenson, R. (2001). Economic impacts of agricultural research and extension. In Gardner. B. and Rausser, C. (eds) Handbook of Agricultural Economics, Volume 1, Part A, Elsevier Science, New York, 573-628.
Feller, I. (1987). Technology transfer, public policy, and the cooperative extension service-OMB imbroglio. Journal of Policy Analysis and Management, Vol. 6, No. 3 (Spring), pp. 307-327
Fuglie, K., and Heisey, P. (2007). Economic returns to public agricultural research. Washington, D.C.: U.S. Department of Agriculture, Economic Research Service, Economic Brief No. 10.
Huffman, W. E. (1976). The productive value of human time in U.S. agriculture. American Journal of Agricultural Economics 58, no. 4: 672-83.
Huffman, W.E., and Evenson, R.E. (2006). Science for agriculture: a long-term perspective (second edition). Blackwell Publishing.
MacDonald, J., Korb, P., and Hoppe, R. (2013). Farm Size and the organization of U.S. crop farming. Washington, D.C.: U.S. Department of Agriculture, Economic Research Service ERR-152August.
O’Donoghue, E. J., Hoppe, R.A., Banker, D.E., Ebel, R., Fuglie, K., Korb, P.,Livingston, M., Nickerson, C., and Sandretto, C. (2011). The changing organization of U.S farming. Washington, D.C.: U.S. Department of Agriculture, Economic Research Service, Economic Information Bulletin No. 88, December.
Padgitt, M.,Newton, D., Penn, R., and Sandretto, C. (2000). Production practices for major crops in U.S. agriculture, 1990-97. Washington, D.C.: U.S. Department of Agriculture, Economic Research Service,Statistical Bulletin. No. 969.
Pardey, P.G., Craig, B., and Hallaway, L. (1989). U.S. agricultural research deflators: 1890-1985. Research Policy 18: 289-296.
Paul, C., Ball, V. E., Felthoven, R. and Nehring, R. (2001). Public infrastructure impacts on U.S. agricultural production: panel analysis of costs and netput composition. Public Finance and Management 1, 2, 183-213.
Schimmelpfennig, D.E., O’Donnell, C.J., and Norton, G.W. (2006). Efficiency effects of agricultural economics research in the United States. Agricultural Economics 34: (273-280.
U.S. Department of Agriculture, Economic Research Service. Agricultural productivity in the United States. Available online at http://ers.usda.gov/Data/AgProductivity/
U.S. Department of Agriculture, National Institute of Food and Agriculture. Salary analyses of state extension service positions. Various years (a.)
U.S. Department of Agriculture, National institute of food and agriculture. AREERA State Plans of Work. Various years (b.)
Wang, S.L., Ball, E., Fulginiti, L., and Plastina, A. (2012). Accounting for the impacts of public research, r&d spill-ins, extension, and roads in U.S. agricultural productivity growth, in agricultural productivity: an international perspective, Fuglie, K.O., Wang, S.L., and Ball, V.E. (eds.), CABI.
Wang, S. L., Heisey, P., Huffman, W., and Fuglie, K. (2013). Public r&d, private r&d, and U.S. agricultural productivity growth: dynamic and long-run relationships. American Journal of Agricultural Economics 95(5): 1287–1293.
Yee, J., Huffman, W.E., Ahearn, M., and Newton, D. (2002). Sources of agricultural productivity growth at the state level, 1960-1993. In Ball, V.E., and G.W. Norton, Agricultural productivity: measurement and source of growth, Norwell, Mass.: Kluwer Academic Publishers, 187-209.