Dietary guidelines issued by the United States Department of Agriculture (USDA) form the basis for nutrition policy in Federal food, education, and information programs (Dietary Guidelines for Americans, 2010). This article presents alternative policy options regarding the implementation of the Dietary Guidelines for Americans (DGA) and the consequences of those policies. It defines the current status of DGA policy, identifies key stakeholders, presents the economic considerations which influence what people eat, and analyzes a set of policy options and their potential consequences for each stakeholder group. This approach follows the public policy education methodology (PPE) for policy options and consequences suggested by Knutson, Sanders, and Armbruster (2012).
The first scientific-based dietary guidelines were released in 1980 by the USDA and the U.S. Department of Health and Human Services (HHS). Since then, by law (Public Law 101-445, Title III, 7 U.S.C. 5301 et seq.), the DGA are reviewed, updated if necessary, and published every five years. The goal of the dietary guidelines is to promote wellness and decrease the risk of dietary- and obesity-related diseases such as diabetes, some cancers, and heart disease.
The latest DGA were released in December 2010. In general, the recommendations are similar to the guidelines released in 2005, which promote the consumption of fruits, vegetables, fish and seafood products; and emphasize the need to exercise in order to prevent or reduce the risk of chronic diseases. Some key changes incorporated in the DGA 2010 are the inclusion of sub-categories for vegetables, grains, and proteins. Perhaps the most important difference from earlier versions of the guidelines is that, instead of recommending specific quantities for every food category, the 2010 DGA employs a simpler concept by recommending increased consumption of some foods and reduced consumption of others (Duffy, Yamazaki, and Zizza, 2012). This concept is highlighted in the new “my plate” initiative by the USDA Center for Nutrition Policy.
| Food Group | Units1 | DGA Recommendation |
|---|---|---|
| Fruits | cups/wk | 14.0 |
| Vegetables | cups/wk | 17.5 |
| Dark Green | cups/wk | 1.5 |
| Beans and Peas (legumes) | cups/wk | 1.5 |
| Red and Orange | cups/wk | 5.5 |
| Starchy Vegetables | cups/wk | 5.0 |
| Other | cups/wk | 4.0 |
| Grains | oz-eq/wk | 42.0 |
| Whole Grains | oz-eq/wk | 21.0 |
| Enriched Grains | oz-eq/wk | 21.0 |
| Protein | oz-eq/wk | 38.5 |
| Seafood | oz/wk | 8.0 |
| Meat, Poultry and Eggs | oz/wk | 26.0 |
| Nuts, Seeds, Soy Products | oz/wk | 4.0 |
| Dairy | cups/wk | 21.0 |
| Oils | grams/wk | 189.0 |
| Max SoFAS² | cal/day | 258.0 |
The guidelines encourage Americans to balance calories across food groups, increase the consumption of fruits and vegetables, make at least half of their grains whole, switch to fat-free or low-fat milk (1%), and reduce sodium and sugary drink consumption. The complete set of recommendations for a 2,000-calorie diet is presented in Table 1.
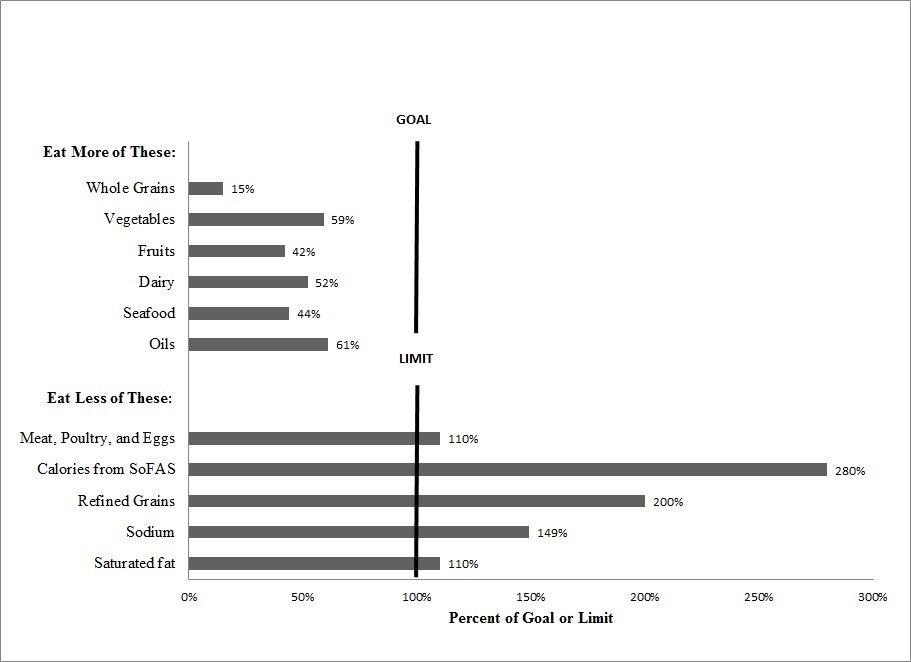
Even though the 2010 DGA state they do not advocate any specific commodity groups, making recommendations about increasing some specific foods and decreasing consumption of other undesirable foods may have unintended consequences, especially to the agricultural sector. Palma and Jetter (2012) looked at consumption trends from 2000-2009 to examine changes, if any, as a result of the dietary guideline recommendations of 2000 and 2005. They used the USDA Economic Research Service (ERS) food consumption data and concluded that there have been only very minor changes in food consumption in response to dietary guidelines. They suggested that food policies regarding dietary guidelines need to consider the consequences of promoting the consumption of healthy foods and discouraging the consumption of unhealthy foods. Figure 1 shows a comparison of the DGA recommendations, represented as the vertical line for goals or limits of different food groups, and the actual consumption levels for the typical American diet.
With increasing health care costs estimated at $2.5 trillion in 2009 (Truffer et al., 2010) and those associated with obesity estimated at $147 billion (Finkelstein, 2009), the DGA focus on the prevention of obesity and other chronic diseases. While the literature linking dietary intake, exercise, and health with an emphasis on prevention of chronic diseases is abundant, when it comes to the potential policy options and consequences the literature is scarce (Palma and Jetter, 2012). A recent Choices theme set of four articles highlights the potential impacts and implications for the agricultural sector of dietary guideline policy (Knutson, 2012). Duffy, Yamazaki, and Zizza (2012) examined the potential of the DGA in reducing what they called the “obesogenic environment” of consumers, meaning an environment that promotes over-consumption of high-energy foods and discourages physical activity. They point out that even though food expenditures as a percentage of income have been decreasing over time, highly caloric food prices have been decreasing more rapidly, making it cheaper and, therefore, creating incentives for Americans to increase their consumption. On the other hand, the relative price of other food categories beneficial to human health—such as fruits and vegetables—has increased (Christian and Rashad, 2009). With current obesity rates in the United States of over 40% for adults and 17% for children, they conclude that in order to reduce the obesity problem, more aggressive measures may be necessary beyond the periodic updating of healthy eating guidelines (Duffy, Yamazaki, and Zizza, 2012). Food assistance programs focusing on low-income households and other nutritionally susceptible groups have had increasing participation in the last decade, with total costs exceeding $92.8 billion annually. Among these is the Supplemental Nutrition Assistance Program (SNAP), formerly known as the Food Stamp Program. This program provides its 45 million participants with a monthly stipend that can be used to purchase a variety of foods from authorized retailers including supermarkets, convenience stores, and many farmers’ markets. The total cost of this program in 2011 exceeded $75 billion (USDA, 2012a).
Several other food assistance programs, such as the Supplemental Food Assistance Program for Women, Infants and Children (WIC), provide vouchers for only certain types of foods. Total monthly participation in the WIC program in 2011 was 9 million people, with a total cost of $7 billion (USDA, 2012b). Starting in 2006, a policy change to WIC was made to include fresh fruits and vegetables, brown rice, whole grains, tofu, soy milk, low-fat/non-fat milk, and baby food.
The school lunch program provides free or discounted meals to children in low-income households. Total participation in 2011 was 31.7 million children, with total costs of $10.8 billion (USDA, 2012c). School breakfast and lunch are the main meals for many participating children.
Another important consideration is consumption of food away from home, especially related to working mothers as discussed by Duffy, Yamazaki, and Zizza (2012). Guthrie, Lin, and Frazao (2002) found that food away from home tends to be more energy dense. Cai et al. (2008) argue that there is only a small effect on obesity, while Dunn (2010) argues that effect is concentrated on minority groups, especially females.
Policy options and consequences include:
The status quo option represents the recommendations contained in the 2010 DGA and its related implementation strategies. The DGA makes recommendations not only about individual intake levels for each food group, but, for the first time, makes suggestions that seem to be directed at policy makers. The most significant change in the last set of DGA is a breakdown into sub-categories, especially in the protein group, and specific classifications of recommended nutrient-dense “healthy foods”, and discouragement of calorie-dense “unhealthy foods”.
When examining changes in consumption in response to the release of previous DGA in 2005 and 2000, Palma and Jetter (2012)—using the ERS per capita data—showed no significant changes in per capita consumption by Americans over the last decade. The average daily caloric intake continues to be higher than the recommendation—at 2,594 calories per capita in 2009. Without a significant reduction in caloric intake, it is unlikely there will be any reduction in obesity rates.
This option either bans completely or reduces advertising of unhealthy foods for which the DGA discourages consumption, including high-caloric sugary drinks and fast food, especially to nutritionally susceptible groups including children, as proposed by Duffy, Yamazaki, and Zizza (2012). They point out that this option may have some problems due to protections on free speech. One option for pursuing this strategy is to reduce TV advertising exposure during children-watching hours.
In terms of consequences, according to Chou, Rashad, and Grossman (2008), a ban on fast food advertising would reduce the number of overweight children ages 3-11 by 18%; and for adolescents 12-18, by 14%. They also estimated that by reducing the tax deductibility for these advertisements, a small reduction in the number of overweight children in the range of 5-7% would be expected. In addition, an advertising campaign may also be started to promote the consumption of healthy foods (Berning, 2011).
A tax on unhealthy foods—soft drinks, solid fats, and added sugars—would potentially raise prices and create a substitution effect, decreasing the demand for these commodities. The cost of food as a percentage of income has decreased over time; however, the relatively less expensive prices of energy dense foods have probably increased their consumption and may be a factor in obesity (Duffy, Yamazaki, and Zizza, 2012).
As a consequence of a tax, it is reasonable to expect a reduction in both caloric intake and consumption of the goods being taxed. However, trade-offs from the taxed foods to other desirable commodities may create some substitution effects and increase caloric intake, offsetting, at least in part, the net effect on calorie intake (Fletcher, 2011). There is also the potential response effect from commodity groups being affected, by increasing their advertising and offsetting some of those reductions (Berning, 2011). This option also generates tax revenue which can be used to fund some nutrition-related programs.
This option would include adding nutrition and health courses to the curriculum in schools. Other efforts may include an extension of media education on nutrition and promotion of exercise to assist prevention and reduce treatment costs of chronic diseases related to obesity (Duffy, Yamazaki, and Zizza, 2012). In terms of consequences, Shiratori and Kinsey (2011) studied the media impacts of nutrition information on food choices. They showed a positive and significant effect of popular media on consumer food choices and suggested that popular media may be an effective communication approach to promote consumer’s health. Dharmasena, Capps, and Clauson (2011) also found positive effects of the 2000 DGA in reducing caloric and nutrient intake of nonalcoholic beverages.
The food assistance program (FAP) incentives option would restrict the type of foods that can be purchased using program funds, similar to the policies adopted by the WIC program. This would limit program participants to use their funds or vouchers to buy healthy foods only.
A change in the 2005 DGA policy added farmers’ markets as outlets that may accept WIC coupons, thus expanding access to healthy food choices.The consequences of this strategy are suggested by a pilot study that used WIC coupons at farmers’ market for six months, and showed an increase in consumption of fruits and vegetables which continued even after the program had ended (Herman et al., 2008). Thilmany and Low (2012) suggest that local food marketing may provide a means to influence food choices, especially in at-risk populations.
Previous studies have estimated the potential effects of financial incentives on healthy eating for SNAP participants. Jetter (2011) estimated that a price discount of 25% for SNAP participants would increase the consumption of fruits and vegetables by 6.9%. Dong and Lin (2009) estimated that a price discount of 10% could increase fruit and vegetable consumption by 2.1% to 5.2%, and program costs could increase by $310 million for fruits and $270 million for vegetables.
Another alternative, suggested by Just and Wansink (2009), is to use behavioral economics to promote consumption of healthy foods and discourage consumption of unhealthy foods. They suggest simple measures, like rearranging the location where school lunch items are displayed to make it easy and convenient for children to buy nutritional items and difficult to get to and purchase less nutritional items. With current FAP costs exceeding $93 billion, restricting the type of commodities may have an impact without increasing the cost of such programs. The alternative would be to increase expenses to expand these types of programs. With more funds for these programs, it would be reasonable to expect reductions in food insecurity, poor health, and obesity (Gundersen, Kreider, and Pepper, 2011).
If a combination of the above policies were implemented, and Americans were to change their diets and adopt the recommendations from the 2010 DGA, changes in consumption habits might be expected in terms of the quality and quantity of food. While promoting healthy foods and exercise may have some positive effects in terms of a reduction in obesity, the effects of discouraging consumption of unhealthy products may also have other unintended consequences, especially in the agricultural sector. The magnitude of the impacts to U.S. agriculture, for every food group, will depend on any changes in demand, the amount of food produced domestically, and the share of consumption derived from imports.
For those commodities favorably affected, Ribera, Yue, and Holcomb (2012) found that a large portion of any increased volume consumed would be imported. Therefore, it is likely that the additional food required to satisfy the increased demand for healthy food will come from both domestic and imported sources. The relative increase in the amount of domestic production and imports depends on the current (cost) competitive level of each food sector. Jetter, Chalfant, and Sumner (2006) demonstrated that to supply the additional fruits and vegetables needed to meet the 2005 DGA recommendations, less fruits and vegetables would be exported and more would be imported. For the other commodities, where the recommendations would lead to an increase in the amounts consumed, supply would also come primarily through changes in trade, though acreage allocated to domestic production would also be expected to increase.
This policy option consists of no government role in making nutrition and dietary recommendations. Under this policy scenario the government would stop releasing DGA recommendations.
In analyzing the consequence of this option, Duffy, Yamazaki, and Zizza (2012) point out that Americans live in an environment that promotes the consumption of calorie-dense unhealthy foods and low physical activity. Given that food costs—as a percentage of income—have been decreasing, but energy-dense unhealthy food costs have been decreasing more rapidly in comparison to healthy food, it would be reasonable to expect an increase in consumption of unhealthy food. The result would be an increase in obesity rates, chronic diseases, and medical costs.
Berning, J. (2011). Evaluating Excise Taxes: The Need to Consider Brand Advertising. Policy Issues, 14(E).
Cai, Y., Alviola IV, P.A., Nayga Jr., R.M., and Wu, X. (2008). The effect of food-away-from-home and food-at-home expenditures on obesity rates: A state-level analysis. Journal of Agricultural and Applied Economics, 40(2), 507-521.
Chou, S.Y, Rashad, I., and Grossman, M. (2008). Fast-food restaurant advertising on television and its influence on childhood obesity. Journal of Law and Economics, 51(4), 599-618.
Christian, T., and Rashad, I. (2009).Trends in U.S. food prices, 1950–2007. Economics and Human Biology, 7(1),113–120.
Dharmasena, S., Capps, O. and Clauson, A. (2011). Ascertaining the Impact of the 2000 USDA Dietary Guidelines for Americans on the Intake of Calories, Caffeine, Calcium, and Vitamin C from At-Home Consumption of Nonalcoholic Beverages. Journal of Agricultural and Applied Economics, 43(1),13-27.
Dietary Guidelines for Americans. (2010). U.S. Department of Agriculture. U.S. Department of Health and Human Services. Available online: http://www.dietaryguidelines.gov.
Dietary Guidelines for Americans. (2005). U.S. Department of Agriculture. U.S. Department of Health and Human Services. Available online: http://www.dietaryguidelines.gov.
Dong, D. and Lin, B-H. (2009). Fruit and Vegetable Consumption by Low-Income Americans: Would a Price Reduction Make a Difference? Economic Research Report, Economic Research Service, U.S. Department of Agriculture. 23 pages.
Duffy, P., Yamazaki, F., and Zizza, A. (2012). Can Dietary Guidelines for Americans 2010 Help Trim America’s Waistline? Choices, 27(1).
Dunn, R. (2010). The effect of fast-food availability on obesity: An analysis by gender, race, and residential location. American Journal of Agricultural Economics, 92(4), 1149-1164.
Economic Research Service (ERS), U.S. Department of Agriculture (USDA). (2012). Food Availability (Per Capita) Data System. http://www.ers.usda.gov/Data/FoodConsumption.
Fletcher, J. (2011). Soda Taxes and Substitution Effects: Will Obesity be Affected? Policy Issues,14C.
Gundersen, C., Kreider, B., and Pepper, J. (2011). The impact of the National School Lunch Program on Child Health: A Nonparametric Bounds Analysis. Journal of Econometrics, 166, 79-91.
Guthrie, J.F., Lin, B-H., and Frazao, E. (2002). Role of food prepared away from home in the American diet, 1977-78 versus 1994–96: Changes and consequences. Journal of Nutrition Education and Behavior, 34(3), 140–150.
Herman, D.R., Harrison, G.G., Afifi, A.A. and Jenks, E. (2008). Effect of a targeted subsidy on intake of fruits and vegetables among low-income women in the special supplemental nutrition program for women, infants and children. American Journal of Public Health. 98(1), 98-105.
Jetter, K.M. (2011). Using Price Incentives to Increase the Consumption of Fruits and Vegetables among a Low-Income Population. Chapter 9 in Nutrients, Dietary Supplements, and Nutriceuticals: Cost Analysis Versus Clinical Benefits. In: Ronald Ross Watson, Joe K. Gerald and Victor R. Preedy, Eds. Humana Press. New York.
Jetter, K.M., Chalfant, J.A., and Sumner, D.A. (2006). Linkages between Greater Fruit and Vegetable Consumption and Agriculture. Selected paper presented at the American Agricultural Economics Association. Long Beach, Calif.
Just, D.R. and Wansink, B. (2009). Smarter Lunchrooms: Using Behavioral Economics to Improve Meal Selection. Choices, 24(3).
Knutson, R.D. (2012). Potential Impacts of 2010 Dietary Guidelines for Americans. Choices, 27(1).
Knutson, R.D., Sanders, L.D., and Armbruster, W.J. (2012). Public Policy Education Methodology. Background paper prepared for the Agricultural and Applied Economics Association Preconference Workshop. Seattle, Wash
Palma, M.A., and Jetter, K.M. (2012). Will the 2010 Dietary Guidelines for Americans Be Any More Effective for Consumers? Choices 27(1).
Ribera L.A., Yue, C., and Holcomb, R. (2012). Geographic Impacts on US Agriculture of the 2010 Dietary Nutrition Guidelines. Choices 27(1).
Shiratori, S., and Kinsey, J. (2011). Media Impact of Nutrition Information on Food Choice. Selected paper presented at the Agricultural and Applied Economics Associations Annual Meeting. Pittsburgh, Penn. July 2011.
Thilmany, D., and Low, S.A. (2012). Will Local Foods Influence American Diets? Choices, 27(1).
Truffer, C.J., Keehan, S., Smith, S., Cylus, J., Sisko, A., Poisal, J.A., Lizonitz, J., and Clemens, M.K. (2010). Health Spending Projections Through 2019: The Recession's Impact Continues. Health Affairs, 29(3), 1-9.
U.S. Department of Agriculture, Food and Nutrition Service. (2012a). Supplemental Nutrition Assistance Program Participation and Costs. Available online: http://www.fns.usda.gov/pd/SNAPsummary.htm.
U.S. Department of Agriculture, Food and Nutrition Service. (2012b). WIC Program Participation and Costs. Available online: http://www.fns.usda.gov/pd/wisummary.htm.
U.S. Department of Agriculture, Food and Nutrition Service. (2012c). National School Lunch Program. Frequently Asked Questions. Available online: http://www.fns.usda.gov/cnd/lunch.

