The Agricultural Act of 2014 (Pub. L. 113-79), usually referred to as the 2014 Farm Bill, is the legislative backbone of federal farm income support programs and agricultural disaster assistance programs. These programs, combined with federal crop insurance, are typically referred to as the farm “safety net” (Shields, Monke, and Schnepf, 2010; Shields, 2015; Schnitkey and Zulauf, 2016; Schnepf, 2017). As debate over the next version of the Farm Bill has begun, policy discussions have centered on improving the effectiveness of this “safety net.” Previous Farm Bills have seen a concerted effort to utilize decoupled agricultural support to ensure that U.S. farm programs meet World Trade Organization (WTO) standards. Congress must determine how to balance decoupled agricultural programs, which are less responsive to the agricultural economy but more accepted in the WTO, against “safety net” agricultural programs, which are more responsive but also seen as more trade-distorting.
A “safety net” is defined by the Merriam-Webster online dictionary as “something that provides security against misfortune or difficulty,” but the 2014 Farm Bill does not include the term. The lack of a clear definition of the misfortunes or difficulties that the farm safety net is trying to protect farmers against makes its evaluation dependent on the focus of the evaluator. However, it is clear that the communication strategies of both the USDA Farm Service Agency (2018) and members of Congress (see, for example, language used by Rep. Collin Petersen in a recent Minnesota Public Radio interview, Weber, 2017; or by Sen. Joni Ernst (2017) on her official website ) equate Farm Bill programs with a farm safety net.
Recent analyses of the farm safety net have focused on the performance of Farm Bill programs across regions (Antle and Houston, 2013) and commodities (Schnepf, 2014; Mercier, 2016; Novakovich and Wolf, 2016; Schnitkey and Zulauf, 2016). Earlier studies highlighted potential compliance issues for U.S. farm policy with the WTO’s Uruguay Round Agreement on Agriculture (Schnepf, 2017) and the potential for different safety net programs to make overlapping payments for the same loss (O’Donoghue et al., 2011).
In a recent article, Zacharias and Paggi (2016) make a case for reviewing the federal crop insurance program from an “optimal program design” perspective to identify areas of improvement and facilitate the analysis of the safety net from a formal and explicit objective formulation rather than an ad hoc formulation. In an earlier article analyzing the safety net for farm households, Gundersen et al. (2000) explored alternative scenarios for government assistance to agriculture based on the concept of ensuring some minimum standard of living and concluded that a clear understanding of objectives and intended beneficiaries should be the starting point for discussions of future farm policies.
Without a formal and explicit objective formulation for the farm safety net in general—and commodity programs in particular—there is no clear way to evaluate the performance of the Agricultural Risk Coverage (ARC) and Price Loss Coverage (PLC) programs; most policy discussions therefore tend to focus on the current and future distribution of payments by state and commodity. By losing sight of the link between the Farm Bill commodity programs and the financial situation of the operations receiving program payments, the policy discussion misses the opportunity to improve the effectiveness of the farm safety net and the efficiency with which public monies are used.
Over the previous two Farm Bills, there has been a gradual shift from decoupled programs to “safety net” programs. Commodity programs in the 1996 and 2002 Farm Bills were led by the direct payment programs, which were essentially fixed decoupled payments that flowed to agricultural producers regardless of the situation in the agricultural economy. With the 2008 and 2014 Farm Bills, commodity programs have been modified to react to conditions in the agricultural economy. The PLC program provides payments when low prices occur and can be considered a price “safety net” program. The ARC program at the Individual Level (ARC-IC) provides coverage against low income for an operation, and it can also be considered a farm revenue “safety net” program. The ARC program at the County Level (ARC-CO) is based on area revenue, decoupled from farm yields and prices. ARC-CO can be considered a revenue “safety net” program, but given the decoupling from farm yields and prices, its effectiveness is an open question. In fact, ARC-CO can be characterized as a lottery of government payments with probability of payment less than one, equal prizes per base acre within each county, and great variability in prizes across county lines. However, ARC-CO is a very popular program. Base acres enrolled in ARC-CO account for 75% of total program base acres in the nation. Furthermore, 92% and 96% of corn and soybean base acres are enrolled in the ARC-CO program. Accumulated ARC-CO payments for corn and soybean base acres in 2015 and 2016 amount to nearly $9.2 billion and represent 89% of all ARC-CO payments for all covered commodities and 71% of all ARC-CO and PLC payments nationwide over the same period.
Many farmers, in essence, traded the direct payment program for ARC-CO. Did their trade result in a better “safety net” for agriculture? Should ARC-CO provide coverage against temporary low incomes, profits, liquidity, or solvency to be considered an integral part of the “safety net” program?
Instead of trying to answer these questions from the normative perspective, the present article contributes to the current policy discussion by providing anecdotal evidence of the disconnect between ARC-CO payments and farm incomes, profits, liquidity, solvency, and farm size using a unique dataset of farm financial information from the Iowa Farm Business Association (IFBA). The data capture production and financial trends for nearly 700 mid-sized commercial farms actively managed in 55 of Iowa’s 99 counties (Plastina, 2017a). The database covers all agricultural districts in Iowa. Each point in the database is a farm–year combination and accounts for ARC-CO payments made in 2015 and 2016 (corresponding, respectively, to crop years 2014/15 and 2015/16). For each component in the analysis, we present two comparisons. The first comparison examines all farms regardless of whether they received ARC-CO payments. This comparison explores the “safety net” aspect of the program. The second comparison examines only those farms that received payments and explores the decoupled aspect of the program. Since ARC-CO is an area-based program, regional disparities across counties (Plastina et al., 2018) are embedded in the program and will not be analyzed in this article.
Source: Authors’ calculations based on IFBA data.
Source: Authors’ calculations based on IFBA data.
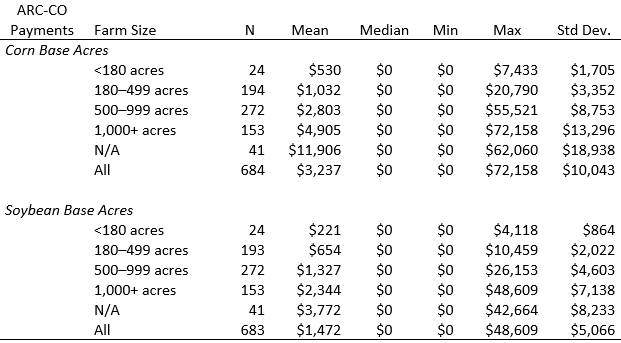
Since information on crop base acres is not collected by the IFBA, farm size is measured in operator crop (owned and rented) acres in 2016, which can differ from crop base acres, which are used to calculate ARC-CO payments. Table 1 presents the descriptive statistics of ARC-CO payments by farm size for all farm–year combinations, including those that received or did not receive payments. The median payment for all categories was zero, and average payments increase with farm size. However, as discussed below, payments—once triggered—are not significantly different across farms receiving payments (Table 2). Therefore, there is not enough evidence that ARC-CO payments are systematically related to farm size, although the largest farms (1,000+ acres) tend to receive larger payments than other farms.
A comparison of the average payments on corn and soybean base acres for all farm–year combinations (regardless of whether they received payments) by farm size using the Tukey’s Studentized Range (HSD) Test indicates that the only significant differences at the 5% level of confidence occur between the largest farms (1,000+ acres) and farms with 180–499 acres (Table 1: $4,905 vs. $1,032 for corn base acres, $2,344 vs. $654 for soybean base acres) and between farms for which the number of acres was not reported and all other groups.
Table 2 presents the descriptive statistics of ARC-CO payments by commodity only for farm–year combinations that received payments. Average ARC-CO payments on corn base acres were higher than on soybean base acres ($21,086 vs. $10,158 across all farm–year combinations that received payments); median payments amounted to $17,744 and $7,181 for corn and soybean acres, respectively. This is due in part to the predominance of corn base acres in Iowa and the lower payments per soybean base acre observed in 2015 and 2016 (Plastina, 2017b).
The HSD tests for payments on corn base acres that received payments conclude that (i) the average payment received by the largest farms, $31,271, is significantly higher than that received by all other groups of farms (except for farms with no reported farm size, where the difference is not statistically significant) and (ii) the average payment received by farms with 500–999 acres, $20,064, is significantly larger than that received by farms with 180–499 acres, $8,705. All other pairwise comparisons of average payments across farms of different size are not statistically significant (Figure 1a). The HSD tests for average payments by farm size on soybean base acres that received payments show that the only significant difference occurs between the largest farms (1,000+ acres) and farms with 180–499 acres: $16,299 vs. $5,050 (Figure 1b).
|
Figure 1a. Boxplot of ARC-CO Payments
on Corn Base Acres by Farm Size for Farms That Received Payments 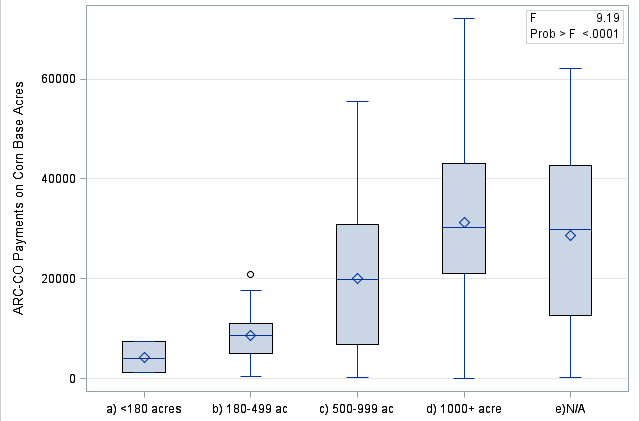
Note: F-test and p-value from ANOVA reported in box. |
Figure 1b. Boxplot of ARC-CO Payments
on Soybean Base Acres by Farm Size for Farms That Received Payments 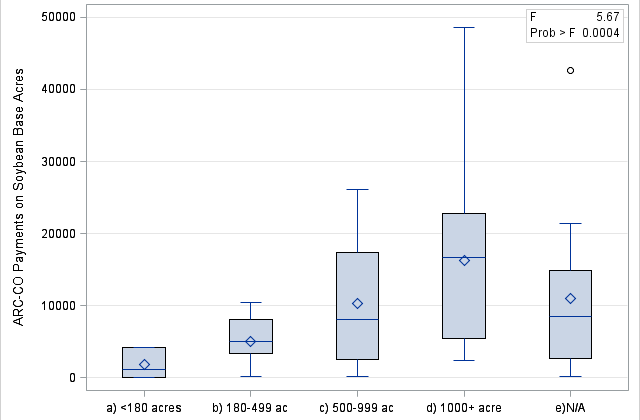
Note: F-test and p-value from ANOVA reported in box. |
Source: Authors’ calculations based on IFBA data.
Source: Authors’ calculations based on IFBA data.
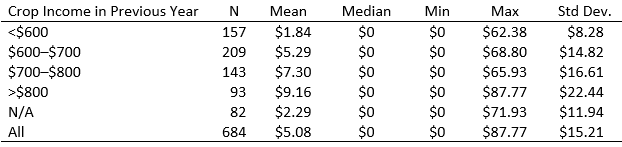
Table 3 shows the descriptive statistics of ARC-CO payments per acre by crop income (accrued) per acre in the previous year for all farm–year combinations (regardless of whether they received payments). Per acre incomes and payments are examined to remove the effect of farm size on the analysis. The median payment for all categories was zero, and average payments tend to increase with the level of crop income in the previous year. This is counterintuitive for a “safety net” program, as one would expect lower incomes to be paired with higher program payments. A pairwise comparison of average ARC-CO payments for all farm–year combinations (regardless of whether they received payments) across groups of farms using HSD tests at the 5% confidence level indicates that (i) farms with the largest crop income per acre (>$800) received significantly higher ARC-CO payments per acre than farms with up to $600 in crop income per acre: $9.16 vs. $1.84; (ii) farms with crop income of $700–$800 per acre received significantly higher ARC-CO payments per acre than farms with up to $600 in crop income per acre: $7.30 vs. $1.84. All other pairwise comparisons across groups of farms with known crop incomes in the previous years are not statistically significant.
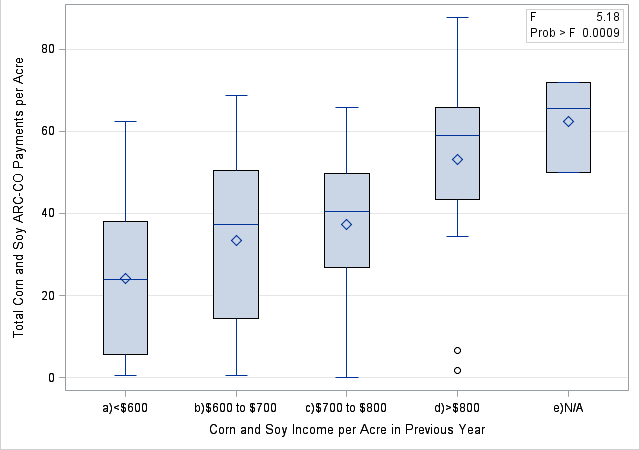
Note: F-test and p-value from ANOVA reported in box.
Source: Authors’ calculations based on IFBA data.
Table 4 shows the descriptive statistics of ARC-CO payments by crop income (accrued) in the previous year only for farm–year combinations that received payments. A similar pattern to that in Table 3 is observed, as average payments tend to increase with the level of crop income in the previous year. A pairwise comparison of average ARC-CO corn and soybean payments per acre across farms grouped by crop income in the previous year using HSD tests at the 5% confidence level indicates that (i) the average payment for the group of farms with more than $800 in crop income per acre, $53.22, is significantly larger than the average payment received by farms with crop income up to $600 per acre, $24.08, and farms with crop income of $600–$700 per acre, $33.49; (ii) average payments for the three groups of farms with up to $800 in crop income per acre ($24.08, $33.49, and $37.26) are not significantly different among themselves (Figure 2).
Since ARC-CO payments tend to increase with crop incomes in the previous year, the ARC-CO program seems to fail at protecting farmers against low income. In fact, operators with higher incomes tend to capture higher payments under ARC-CO.
Crop profits are calculated by subtracting accrued operating expenses and economic depreciation (on machinery and equipment, buildings, and improvements) from crop income (accrual). Profits equal the net farm income used to compensate unpaid family labor, plus returns to equity and management. As with crop incomes, crop profits are examined on a per acre basis to remove farm size effects.
Source: Authors’ calculations based on IFBA data.
Source: Authors’ calculations based on IFBA data.
Table 5 shows the descriptive statistics of ARC-CO payments by crop profits in the previous year for all farm–year combinations (regardless of whether they received payments). The median payment for all categories was zero. A pairwise comparison of average ARC-CO payments for all farm–year combinations across groups of farms using HSD tests at the 5% confidence level indicates that (i) the average payment for the group of farms with crop profits larger than $150 per acre, $12.67, is significantly larger than the corresponding averages for the four groups of farms with profits up to $100 per acre ($3.08, $5.39, $4.43, and $3.60); (ii) the average payment for the group of farms with crop profits of $100–$150 per acre is significantly larger than the corresponding average for the group of farms with crop losses of up to $50 per acre ($11.19 vs. $3.08). All other pairwise comparisons across groups of farms with known crop profits in the previous years are not statistically significant. Once again, the results are generally the opposite of what one would expect from a “safety net” program. Farmers with the lowest crop profits (or largest crop losses) tended to receive less from ARC-CO than farmers with better profitability.

Note: F-test and p-value from ANOVA reported in box.
Source: Authors’ calculations based on IFBA data.
Table 6 shows the descriptive statistics of ARC-CO payments by crop profits in the previous year only for farm–year combinations that received payments. A pairwise comparison of average ARC-CO corn and soybean payments across farms grouped by crop profits fails to find significant differences using HSD tests at the 5% confidence level (Figure 3). This slightly modifies the previous pattern, as once ARC-CO payments are triggered, they are roughly shared equally across the profit spectrum. It must be noted that the 92 data points in Table 6 are distributed across 48 counties and cover all agricultural regions in Iowa, except for the South Central and the Southeast agricultural regions (which had the highest concentration of counties that did not receive ARC-CO payments on corn base acres, Plastina et al., 2018). In terms of crop profitability, the ARC-CO payments act more like decoupled payments in counties where payments are triggered and less like a “safety net” for all farms.
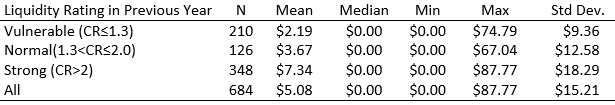
Liquidity refers to the degree to which debt obligations coming due over the following year can be paid from cash or assets that soon will be turned into cash. The selected indicator to measure liquidity across farms of different sizes is the current ratio (CR), calculated as current assets divided by current liabilities. According to the Farm Financial Scorecard (Becker et al., 2014), a CR above 2.0 indicates a strong liquidity position; a ratio below 1.3 indicates a vulnerable liquidity position, and a ratio between 1.3 and 2.0 is normal and indicates that liquidity should be watched closely. According to these liquidity thresholds, the annual average CR for IFBA farms is consistently strong (Plastina, 2017c), but we are interested in the distribution of CRs and their interaction with ARC-CO payments in this analysis.
Source: Authors’ calculations based on IFBA data.
Source: Authors’ calculations based on IFBA data.
Table 7 shows the descriptive statistics of ARC-CO payments by crop acre by liquidity rating at the end of the previous year for all farm–year combinations (regardless of whether they received payments). Average payments per operated crop acre tend to increase with the strength of the liquidity rating. HSD tests at the 5% confidence level indicate that farms with strong liquidity ratings received, on average, significantly larger ARC-CO corn and soybean payments than farms with vulnerable liquidity ratings ($7.34 vs. $2.19). The other pairwise comparisons are not statistically significant.
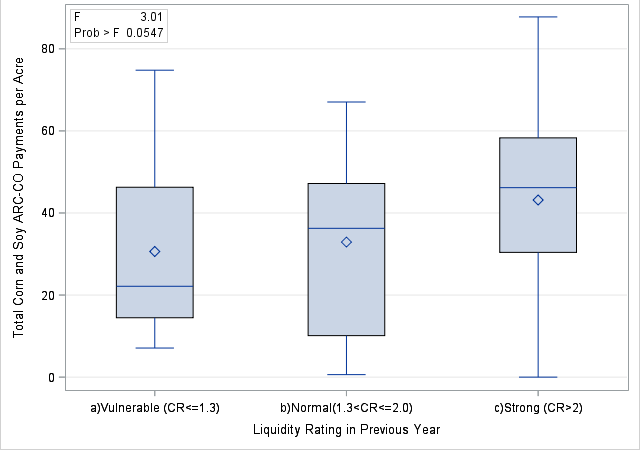
Note: F-test and p-value from ANOVA reported in box.
Source: Authors’ calculations based on IFBA data.
Table 8 shows the descriptive statistics of ARC-CO payments per operated crop acre by liquidity rating at the end of the previous year only for farm–year combinations that received payments. Although the average payments are higher for stronger liquidity ratings, the mean differences are not statistically significant at the 5% confidence level according to pairwise HSD tests (Figure 4). The patterns here mimic the patterns for crop profitability. For a “safety net” program, one would expect higher payments to flow to producers in the weaker liquidity categories. Instead, higher payments flow to the stronger producers in general. Once ARC-CO payments are triggered, they act more like a decoupled payment than a “safety net” payment.
Solvency refers to the degree to which all debts are secured by asset values and evaluates the relative mix of equity and debt capital used by the farm. Financial statements prepared by IFBA consultants use a mix of valuation strategies to better track farm financial performance: Current assets are valued at their market value, but some intermediate and all long-term assets (such as machinery and land, respectively) are valued at their cost (or book) value. Therefore, IFBA solvency measures are not affected by changes in the market value of land, machinery, and other long-lived assets or by their tax basis.
According to the Farm Financial Scorecard (Becker et al., 2014), a total debt-to-asset ratio (DTA) above 0.60 indicates a vulnerable solvency position, a ratio below 0.30 indicates a strong solvency position, and a ratio between 0.30 and 0.60 is normal and indicates that solvency should be monitored closely. According to these solvency thresholds, the annual average DTA for IFBA farms is consistently strong (Plastina, 2017c).
Source: Authors’ calculations based on IFBA data.
Source: Authors’ calculations based on IFBA data.
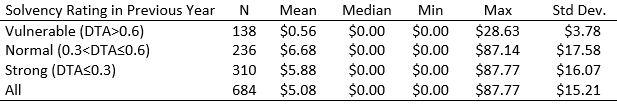
Table 9 shows descriptive statistics for ARC-CO corn and soybean payments per operated crop acre by groups of farms with similar solvency ratings for all farm–year observations (regardless of whether they received payments). HSD tests at the 5% confidence level indicate that (i) average payments for farms with vulnerable solvency ratings are significantly lower than the average payments for farms with normal or strong liquidity ($0.56 vs. $6.68 and $5.88, respectively) and (ii) average payments for farms with normal solvency ratings are significantly different from corresponding payments for farms with strong solvency.
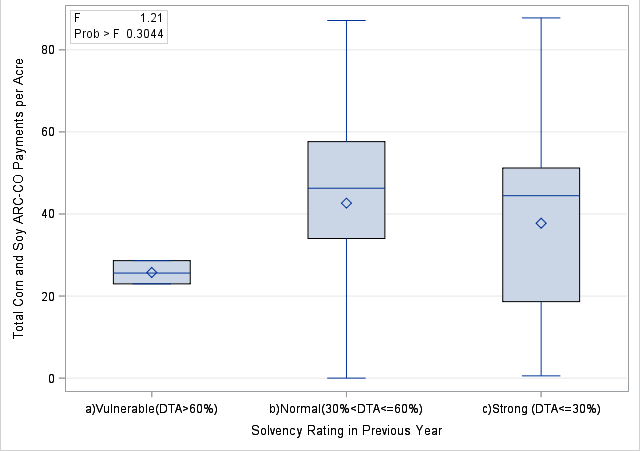
Note: F-test and p-value from ANOVA reported in box.
Source: Authors’ calculations based on IFBA data.
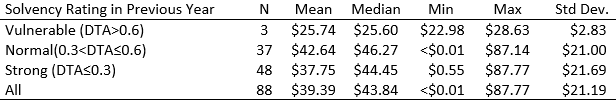
Table 10 shows descriptive statistics for ARC-CO corn and soybean payments per operated crop acre by groups of farms with similar solvency ratings for farms that received payments. Among ARC-CO payment recipients, the HSD tests fail to reject mean equality across groups, averaging $39.39 per acre (Figure 5). The solvency results parallel the crop profitability and liquidity results.
This article explores the relationship between ARC-CO payments and four potential risks that a farm safety net might protect farmers against. Using farm-level data from Iowa, we found no support to the hypotheses that ARC-CO payments would be larger for farms with lower incomes, lower profits, vulnerable liquidity ratings, or vulnerable solvency ratings. On the contrary, we found support that ARC-CO payments tend to be larger for farms with higher crop incomes and profits in the previous year, stronger financial positions, and at least 1,000 acres. In summary, ARC-CO payments, instead of acting as a safety net for Iowa farmers, can be more accurately characterized as decoupled support for farms located in counties where payments are triggered, but without the consistency of previous programs, such as the direct payment program. In the end, farmers traded the certainty of the direct payment program for a lottery of government payments with probability of payment less than one, equal prizes per base acre within each county, and great variability in prizes across county lines.
Antle, J., and L. Houston. 2013. “A Regional Look at the Distribution of Farm Program Payments and How It May Change with a New Farm Bill.” Choices 24(4):1–7.
Becker, K., D. Kauppila, G. Rogers, R. Parsons, D. Nordquist, and R. Craven. 2014. Farm Finance Scorecard. St. Paul, MN: University of Minnesota Center for Farm Financial Management. Available online: http://articles.extension.org/sites/default/files/w/e/e9/Farm_Financial_Scorecard_Corrected.pdf
Ernst, J. 2017, October 23. Heitkamp, Ernst Introduce Bipartisan Bill to Help Farmers Suffering from Low Commodity Prices: Senators’ Bill Would Strengthen ARC-CO Safety Net Program in Next Farm Bill. Available online: https://www.ernst.senate.gov/public/index.cfm/2017/10/heitkamp-ernst-introduce-bipartisan-bill-to-help-farmers-suffering-from-low-commodity-prices
Gundersen, C., M. Morehart, L. Whitener, L. Ghelfi, J. Johnson, K. Kassel, B. Kuhn, A. Mishra, S. Offutt, and L. Tiehen. 2000, October. A Safety Net for Farm Households. Washington, DC: U.S. Department of Agriculture, Economic Research Service, Agricultural Economic Report AER-788.
Hoppe, R.A., K. Penni, E.J. O’Donoghue, and D.E. Banker. 2007, June. Structure and Finances of U.S. Farms: Family Farm Report, 2007 Edition. Washington, DC: U.S. Department of Agriculture, Economic Research Service, Economic Information Bulletin EIB-24.
Mercier, S. 2016. “Federal Benefits for Livestock and Specialty Crop Producers.” Choices 31(4):1–6.
Novakovic, A.M., and C. Wolf. 2016. “Federal Interventions in Milk Markets.” Choices 31(4):1–8.
O’Donoghue, E.J., A.B. Effland, J.C. Cooper, and C. You. 2011, November. Identifying Overlap in the Farm Safety Net. Washington, DC: U.S. Dept. of Agriculture, Economic Research Service, Economic Information Bulletin EIB-87.
Plastina, A. 2017a, September. Financial Stress in Iowa Farms. Ames, IA: Iowa State University Extension and Outreach, FM 1892R.
Plastina, A. 2017b. “Past and Future of Farm Bill Payments.” Agricultural Policy Review 2017(Winter):1–3.
Plastina, A. 2017c, September. Financial Performance Measures for Iowa Farms. Ames, IA: Iowa State University Extension and Outreach, Ag Decision Maker File C3-55.
Plastina, A., C. Hart, C. Anderson, J. Yi, and C. Balmer. 2018. ARC/PLC Payments per Base Acre in Iowa. Ames, IA: Iowa State University, Center for Agricultural and Rural Development. Available online: http://www.card.iastate.edu/tools/farm-bill/arc-plc/
Schnepf, R. 2015, April. 2014 Farm Bill Provisions and WTO Compliance. Washington, DC: Congressional Research Service, CRS Report R43817.
Schnepf, R. 2017, August. Farm Safety-Net Payments under the 2014 Farm Bill: Comparison by Program Crop. Washington, DC: Congressional Research Service, CRS Report R44914.
Schnitkey, G., and C. Zulauf. 2016. “The Farm Safety Net for Field Crops.” Choices 31(4):1–8.
Shields, D.A. 2015, August. Farm Safety Net Programs: Background and Issues. Washington, DC: Congressional Research Service, CRS Report R43758.
Shields, D.A., J, Monke, and R. Schnepf. 2010, December. Farm Safety Net Programs: Issues for the Next Farm Bill. Washington, DC: Congressional Research Service, CRS Report R41317.
U.S. Department of Agriculture (USDA). 2018. Farm Safety Net. Washington, DC: U.S. Department of Agriculture, Farm Service Agency. Available online: www.fsa.usda.gov/programs-and-services/farm-bill/farm-safety-net/index
Weber, T. 2017, October 3. “Peterson on Farm Bill: No Extra Dollars to Boost Safety Net.” Interview with Representative Collin Peterson. MPR News. Available online: https://www.mprnews.org/story/2017/10/03/what-is-happening-to-2018-farm-bill
Zacharias, T.P., and M.S. Paggi. 2016. “Current Perspectives on the Crop Insurance Farm Safety Net.” Choices 31(3):1–5.

