A hallmark of the Trump administration has been to reverse the post–World War II consensus on lowering trade barriers toward a more protectionist and perhaps mercantilist position vis-à-vis trade policy. Average tariffs peaked at nearly 60% in the 1930’s after implementation of the Smoot-Hawley Tariffs and have since dropped to an average of less than 5% (U.S. Department of Commerce). One of the administration’s first actions in this regard was to leave the Trans-Pacific Partnership (TPP) agreement, followed thereafter by raising tariffs on steel and aluminum imports. President Trump left no doubt where he stood on the North American Free Trade Agreement (NAFTA), which he often stated was the “worst trade deal maybe ever signed anywhere.” The administration’s actions on trade are likely to have significant implications for U.S. farmers, as these actions target three of the largest markets for U.S. agricultural exports (Canada, China, and Mexico), representing an average of $63 billion annually from 2013 to 2015 and accounting for some 44% of U.S. agricultural exports.
We estimate the impacts on U.S. agriculture of the set of recently agreed upon and potential trade policies. First, we assess the recently agreed to, but not yet ratified, United States–Mexico–Canada Agreement (USMCA). The USMCA—at times referred to as NAFTA 2.0—represents a modified NAFTA, which has been in place for 25 years. This analysis is done from two different perspectives. The first uses the NAFTA agreement as the base case and compares it with USMCA to estimate the impacts of changes introduced in USMCA related to the agricultural sector, assuming no other changes.
Because there have been many other changes in trade policies (steel and aluminum tariffs and the retaliation against those U.S. imposed tariffs, U.S. withdrawal from the TPP agreement, etc.), the second perspective includes other trade policy changes. The first of these cases includes just the agricultural tariffs imposed by Canada and Mexico in retaliation to the U.S. actions in steel and aluminum. The second case adds agricultural tariffs imposed by other countries, such as China and the European Union (EU).
The third case explores the recently implemented TPP agreement. Despite U.S. withdrawal from the agreement, its implementation will impact U.S. agriculture as the TPP countries substitute away from U.S. products toward intra-TPP trade under the new preference scheme.
While USMCA, TPP, and trade war policies correspond to ongoing U.S. trade policy measures, in the near term, alternative policies could be introduced either toward liberalization or further protectionism. One possible protectionist measure is the dissolution of NAFTA, which the current U.S. administration has recently discussed. We explore this case within the second set of policies.
Finally, we explore the impact of the set of alternative policies toward trade liberalization on the agriculture and food sectors. In addition to the USMCA agreement, this includes the United States rejoining the TPP.
To conduct this analysis, we use the Global Trade Analysis Project (GTAP) model calibrated to the 2014 GTAP database (Aguiar, Narayanan, and McDougall, 2016; Corong et al., 2017). Additional details on methodology can be found in Chepeliev, Tyner, and van der Mensbrugghe (2019).
Source: Aguiar, Narayanan, and McDougall (2016); United
Nations (2018).
Source: Aguiar, Narayanan, and McDougall (2016);
United Nations (2018).
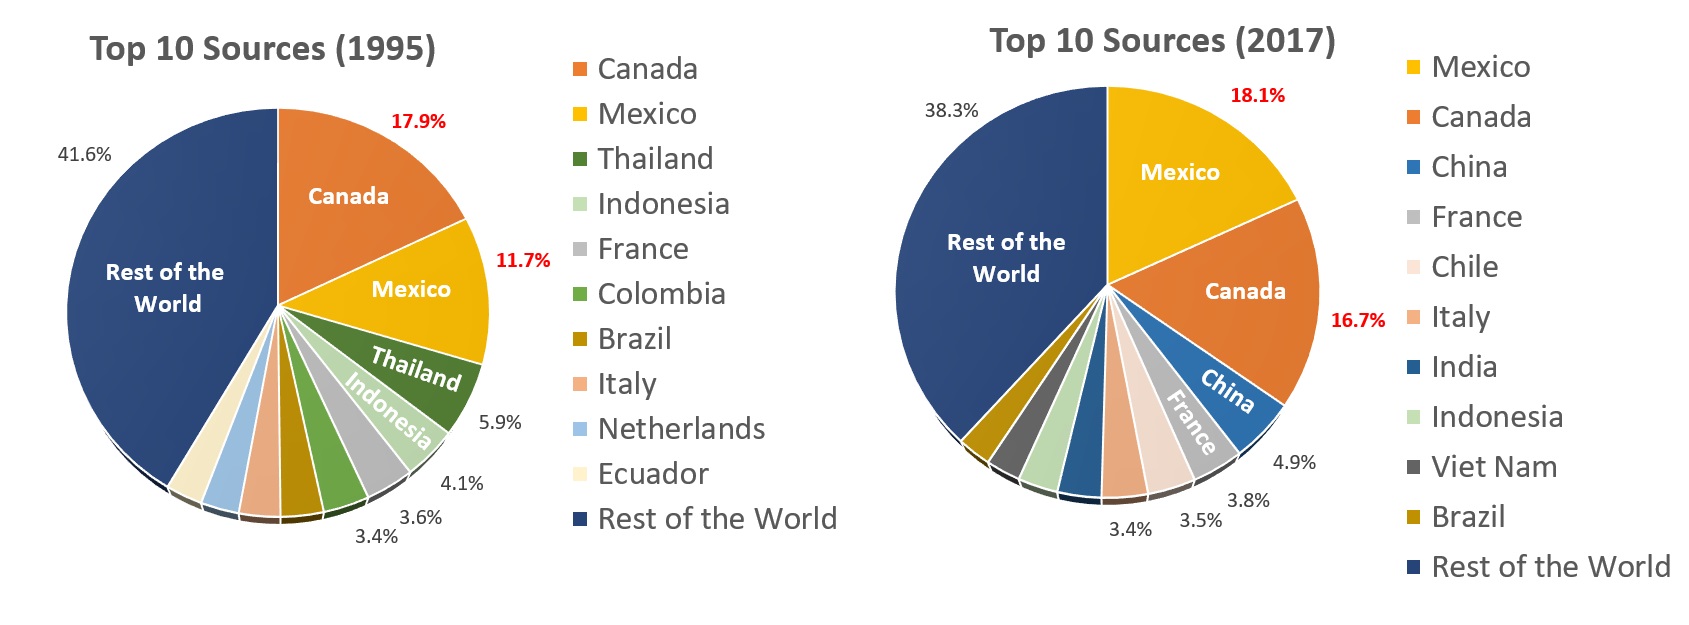
U.S. agricultural exports and imports have increased significantly since 1961, growing at a pace comparable with GDP (3.0%–3.3% annually). Following NAFTA implementation in 1994, U.S. agricultural imports outpaced agricultural exports and GDP, growing an average 4.2% of per year (World Bank, 2018; Food and Agriculture Organization, 2018). Over one-third (36.6%) of the increase in U.S. agricultural and food imports between 1995 and 2017 was associated with Canada and Mexico, although their combined shares only grew from 30% to 35%. Canada and Mexico were already the largest sources of U.S. agricultural imports in 1995 (Figure 1). China was not an important agricultural exporter in 1995 but ranked third in 2017.
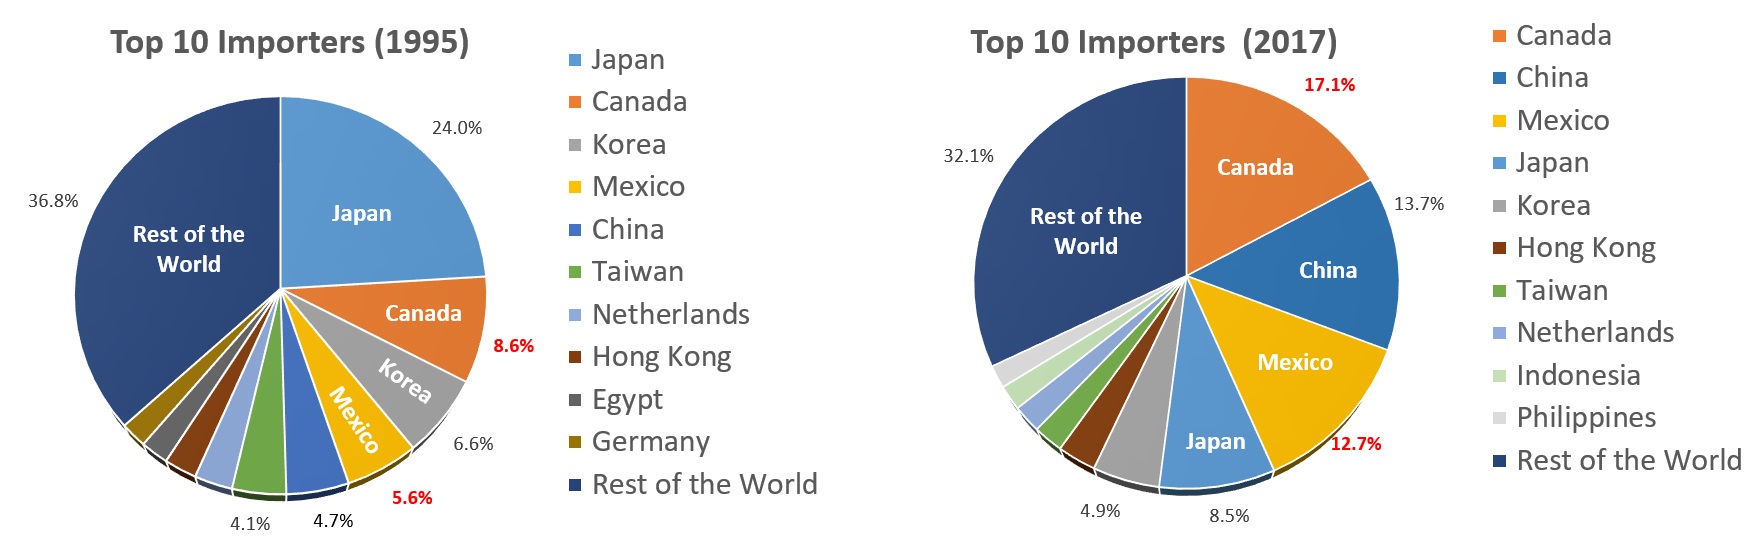
This growth has been accompanied by a major shift in U.S. agricultural trade destinations and sources. Over 1995–2017, the shares of U.S. agricultural exports destined for Canada and Mexico more than doubled, from 14.2% to 29.8% (Figure 2). The other major change was China, which moved from a share of 4.7% to 13.7%.
The most significant impacts of the USMCA related to market access are concentrated in the automobile sector and a few agricultural sectors:
Many of the other new provisions relative to the original NAFTA deal with so-called “deeper” integration issues such as reducing the impacts of nontariff barriers (such as transparency in import and export licensing). Additional provisions deal with intellectual property and the digital economy, the latter in its infancy when the original NAFTA was signed.
After a transition period at the beginning of the implementation of NAFTA, agricultural trade across the three NAFTA countries was largely liberalized and increased substantially. A few key exceptions include protection of Canada’s heavily regulated dairy sector and, to a lesser extent, poultry. The dairy and poultry sectors were subject to tariff rate quotas (TRQs), which provide minimal access at a low tariff level. Higher exports, so-called out-of-quota exports, face much higher and typically prohibitive tariffs. In particular, in 2017 TRQs were applied to chicken and turkey products, eggs and egg products, milk, butter, cream, cheese, ice cream, etc. Some of the specified Canadian quotas were reserved for selected regions (for example, cheese of all types other than imitation cheese, 66% allocated to EU; powdered buttermilk, reserved for New Zealand; concentrated/condensed milk/cream, reserved for Australia).
Source: GTAP model simulations.
Note: All gains or losses reported in this paper correspond to
annual changes.
The new agreement expands U.S. quotas in these sectors. This analysis estimates that based on the proposed quota increases, the dairy quota expands by 105.6% from an initial low level and the “pork and poultry products, etc.” sector by some 11.5%. There are smaller expansions in two other sectors—“other food products” (0.04%) and “pigs, chicken, etc.” (2.7%)—which include live chickens and eggs (Office of the U.S. Trade Representative, 2018). Our interpretation of the changes to agricultural protection under the USMCA is limited to these four sectors and only affects U.S. exports to Canada.
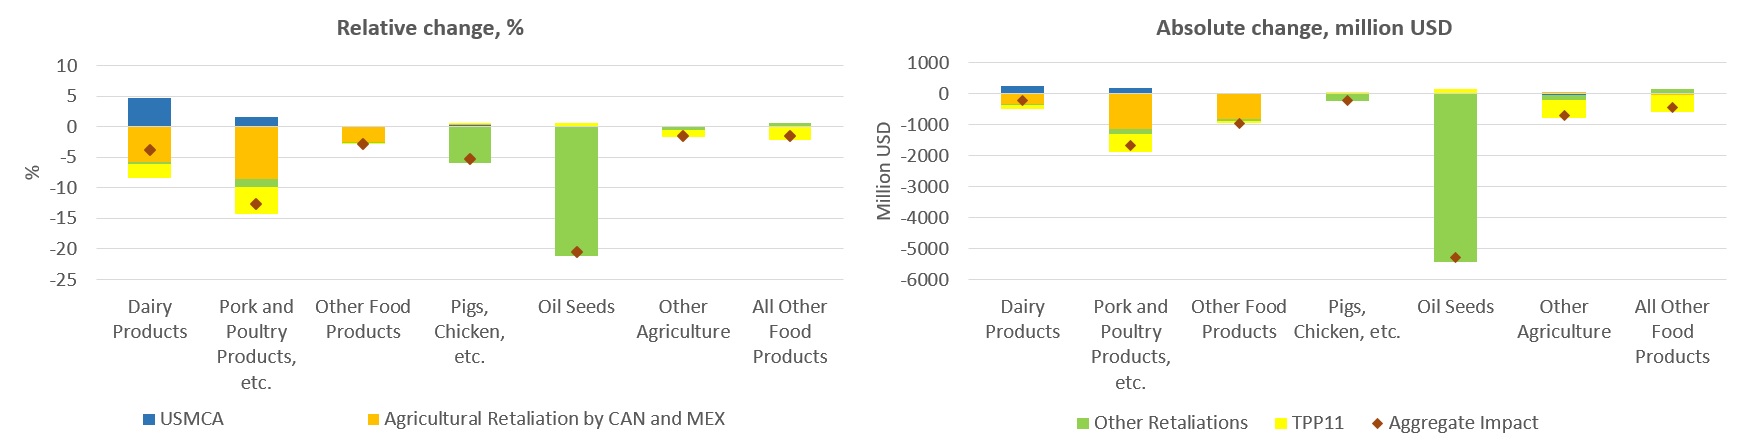
The impact on total U.S. agricultural exports is relatively modest at around $440 million. Focusing on the target sectors, dairy exports increase by 4.6% and “pork and poultry products, etc.” exports increase by 1.6%; to some extent, this reflects the low share of U.S. exports in these sectors toward Canada (Figure 3). Export increases in the other two target sectors are much lower, 0.35% and essentially 0% for “pigs, chicken, etc.” and “other food products,” respectively. In value terms, the largest export increases are also associated with the dairy ($269 million) and “pork and poultry products, etc.” ($206 million) sectors (Figure 3).
In March 2018, the Trump Administration used national security considerations to justify imposing tariffs of 25% on steel and 10% on aluminum imports from most countries. Many U.S. trading partners, including both NAFTA partners, initiated retaliatory tariffs, targeting a broad set of traded goods, including agricultural commodities.
According to our simulations, retaliatory tariffs enacted by Canada and Mexico on their imports of U.S. agricultural and food products would reverse any potential gains that emerge from implementation of the USMCA, with exports losses for the sector at roughly $1.74 billion (we do not include U.S. aluminum and steel tariffs in this scenario). In the most affected sectors, these retaliatory tariffs lead to a decline in U.S. exports of “pork and poultry products, etc.” by 7%, “dairy products” by 1.2%, and “other food products” by 2.5% (Figure 3). Exports of fruits and vegetables experience only a minor drop. In value terms, the largest decreases in exports are observed in “pork and poultry products, etc.” ($918 million) and “other food products” ($824 million). Exports in other sectors increase marginally as U.S. agriculture adjusts its production and exports toward the nontargeted sectors.
Implementation of the USMCA is taking place in the context of a much broader set of trade policies. The steel and aluminum import tariffs implemented by the United States in March 2018 launched a chain reaction of retaliatory trade measures by U.S. trading partners, including China and the EU. This included multi-round tariff increases between China and the United States (Li, 2018). Relative to the positive impacts of the USMCA on U.S. agriculture, the aforementioned trade frictions have a sharp negative effect. These tariff increases begin with the steel and aluminum tariffs implemented by the United States and include all the tariff changes up to the first round of U.S.–China tariff increases (Li, 2018).
Under this more dramatic scenario of bilateral tariff increases, U.S. agriculture takes a much more sizeable hit, as aggregate U.S. agricultural and food exports drop by around $7.7 billion. While “oilseeds” exports suffer the most (a 21% decline) following implementation of the retaliatory policies by China, exports in other agricultural and food sectors also decline (Figure 3). “Pork and poultry products, etc.” exports drop by 8.3%, “pigs, chicken, etc.” by 5.4%, “other food products” by 2.7%, and “dairy products” by 1.5%.
Though slightly different in terms of sectoral aggregation and reference data year, our results are in line with other studies that estimated potential impacts of China’s retaliatory tariffs on U.S. agriculture. Zheng et al. (2018) and Taheripour and Tyner (2018) estimated that U.S soybeans exports to China would fall by 34.2% and 47.7% (under the standard GTAP trade elasticities), respectively. Our results suggest a 44.8% reduction in U.S. “oilseeds” exports to China . Zheng et al. (2018) predicted a 83.3% reduction in U.S. pork exports to China, compared to our estimate of a 93.4% reduction.
After the United States withdrew its signature, the remaining 11 countries (Australia, Brunei, Canada, Chile, Japan, Malaysia, Mexico, New Zealand, Peru, Singapore, and Vietnam) negotiated a new agreement (TPP11), officially called the Comprehensive and Progressive Agreement for Trans-Pacific Partnership (CPTPP). Implementation of TPP11 includes reductions in tariffs (MACMAP, 2018) and nontariff barriers (NTBs). To estimate the ad valorem equivalents (AVEs) of the NTBs for goods, we follow Kee, Nicita, and Olarreaga (2009), while AVEs on services are sourced from Jafari and Tarr (2015). Following Petri and Plummer (2016), we assume that the actionable portion of the estimated NTBs is 56.3% for goods and 37.5% for services. To represent the TPP policy implementation, we assume a full reduction in the actionable portion of the NTBs for TPP11 members.
Implementation of the TPP11 leads to an additional reduction in the U.S. agricultural and food exports, as trade within TPP11 countries increases and substitutes away from U.S.–based imports. U.S. agricultural and food exports fall by an additional $1.8 billion. While “oilseeds”, “other food products” and “pigs, chicken, etc.” exports are not significantly impacted by the TPP11, pork and poultry products get the most sizeable hit (-4.4%), followed by dairy products (-2.9%) and all other food products (-2.1%) (Figure 3).
On aggregate, USMCA implementation together with the full suite of measures and countermeasures and TPP11 results in an almost $9.5 billion reduction in exports, half associated with oilseeds and another 19% with pork and poultry products.

Source: GTAP model simulations.
In this section, we explore the impacts on U.S. agriculture from the possible dissolution of NAFTA (and ipso facto the nonimplementation of USMCA), following recent discussions by the U.S. administration. We assume that all three NAFTA members sign out from the agreement and “most-favored nation” (MFN) tariffs for all intra-NAFTA trade are imposed (Ciuriak et al., 2017). Following Ciuriak et al. (2017), we assume no change to the dairy regime between Canada and Mexico and imports to Canada from the United States as well as no change in the sugar regime for all bilateral flows except imports to Canada from the United States.
Termination of NAFTA results in an aggregate drop in U.S. agricultural and food exports of over $12 billion. Exports of “pork and poultry products, etc.” decline by 35.1% ($4.6 billion), dairy product exports decline by 16.4% ($950 million), and “other food products” exports decline by 15.1% ($4.9 billion) (Figure 4). “Pigs, chicken, etc.” and “all other food products” also get a sizeable hit, with declines in exports of 6.4% and 4.7%, respectively (Figure 4).
Source: GTAP model simulations.
Though the United States withdrew from TPP on January 23, 2017, and the initial agreement has been transformed into TPP11, already ratified by seven countries, in this section we explore a scenario in which the United States joins the TPP under conditions outlined in the initial agreement—a TPP12 scenario. To be precise, we compare TPP12 with our original reference data and not with the TPP11 scenario, which could lead to (typically) modest interaction effects.
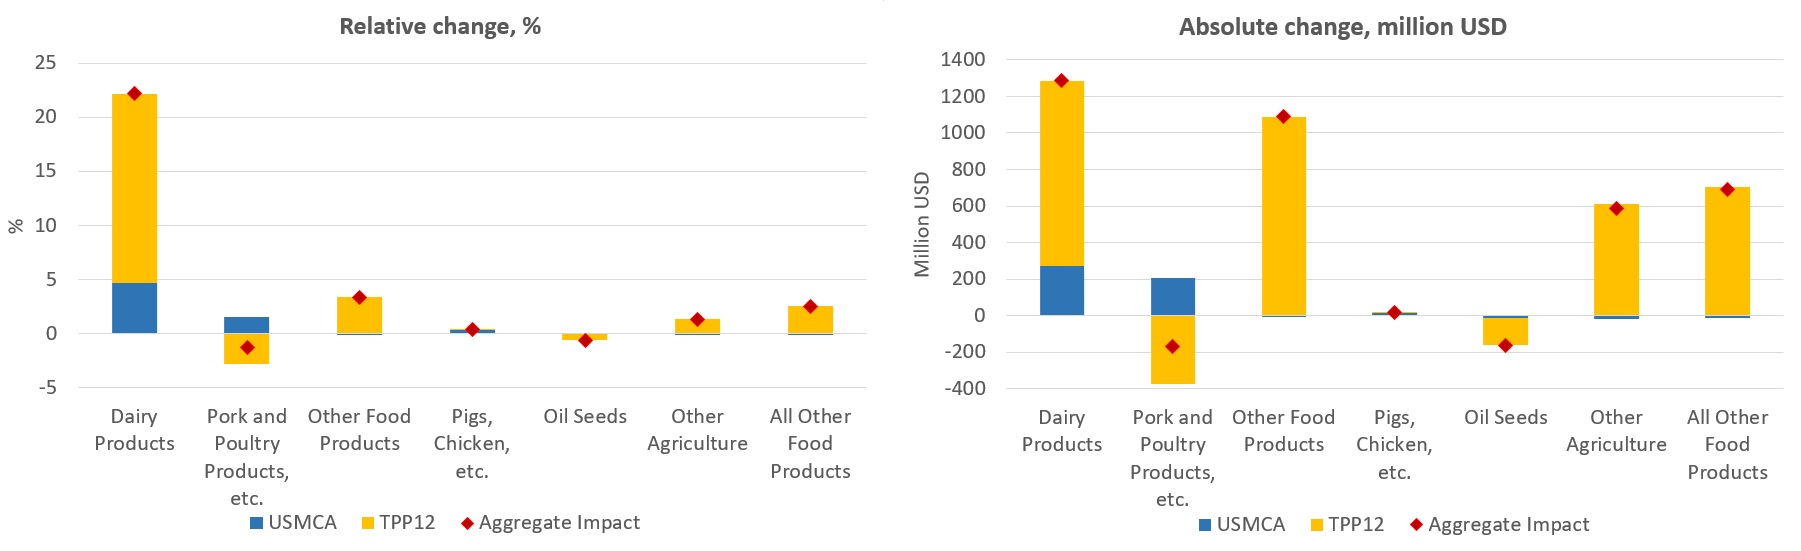
Our simulations show that the United States joining the TPP would have a sizable positive impact on U.S. agricultural and food exports, with an increase of around $2.9 billion. The “dairy products” sector experiences the largest relative increase in exports—17.5%, equivalent to $1 billion (Figure 5). A similar increase in export values—around $1.1 billion—is observed in the “other food products” sector, while exports of “other agriculture” and “all other food products” grow by $600 million to $700 million.
U.S. “oilseeds” and “pork and poultry products, etc.” experience a modest reduction in exports—$150 million and $370 million, respectively. In the case of oilseeds, as key U.S. export destinations (China, the EU, and the rest of East Asia) are not members of the TPP12 agreement, corresponding export activities are less attractive and are substituted by other exports (“all other food products” exports to Japan, “dairy products” exports to Japan and Canada, etc.). U.S. exports of “pork and poultry products, etc.” fall due to the partial loss of the Japanese market. As a result of sharp reduction in tariffs on “pork and poultry products, etc.” imports from Chile to Japan under the TPP12 scenario, Japan substitutes away from U.S.–based imports.
Source: GTAP model simulations.
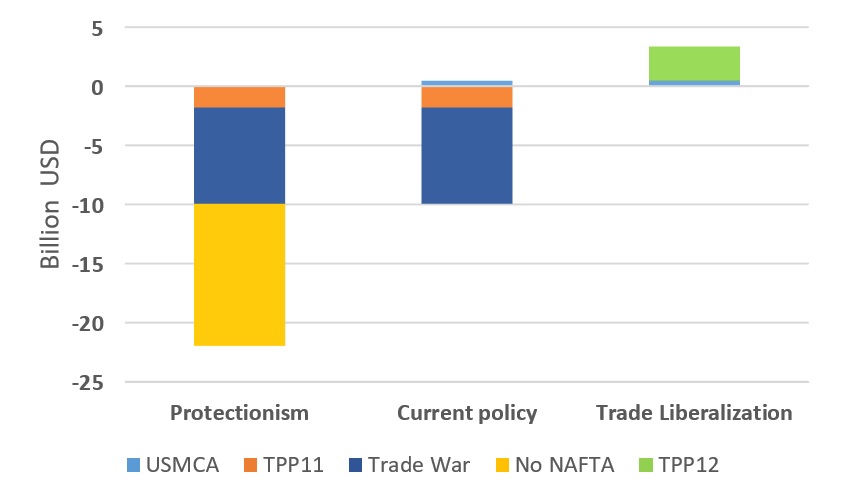
Note: “Current policy” scenario corresponds to the
combination of USMCA + TPP11 + Trade war scenarios.
U.S. agriculture has benefitted significantly from increasing market access in Canada and Mexico as a result of the formation of NAFTA some 25 years ago. The share of U.S. agricultural exports to these two countries has increased from 14.2% when the agreement was first signed to almost 30% currently. According to our estimates, a withdrawal from NAFTA, with tariffs reverting to MFN levels, would create a decline in U.S. agricultural exports of over $12 billion (Figure 6).
The new NAFTA agreement, USMCA, consolidates the agricultural market access gains from NAFTA 1.0—fortunately for farmers—and in some sectors leads to improvements in market access—notably in dairy and poultry exports to Canada. U.S. agricultural exports would increase by an estimated $440 million, largely concentrated in dairy and poultry (Figure 6).
Nonetheless, international trade policies are currently in a state of considerable flux as the Trump administration reverses the decades-long commitment toward freer trade. One of the first salvos was the imposition of 25% and 10% tariff increases on steel and aluminum, respectively. The U.S. trading partners reacted to these tariffs by targeting U.S. exports, particularly in sensitive sectors such as agriculture. The retaliatory tariffs implemented by Canada and Mexico on U.S. agricultural exports will reverse the modest export gains from USMCA—a decline of $1.7 billion rather than a gain of $440 million. In a broader trade context, with all measures and countermeasures (including retaliation by China and the EU), U.S. agricultural exports will decline by around $7.7 billion (Figure 6).
According to our estimates, a U.S. withdrawal from TPP reduces agricultural and food exports by an additional $1.4 billion. Following trade liberalization among the 11 TPP members, trade increases within the TPP11 countries, which substitutes away imports from the United States. If the United States rejoined the TPP, farmers would significantly benefit, as exports are estimated to increase by around $2.9 billion.
Further extension of the current trade policy trajectory toward protectionism—the U.S. withdrawal from NAFTA—would result in U.S. agricultural export reductions of $22 billion. These negative trade impacts would be reflected in lower incomes for U.S. farmers, reduced land returns, and labor displacement. On average, such an export reduction is equivalent to $4,000 per person employed in the agricultural and food sectors. This scenario would also result in an aggregate welfare loss of $42.5 billion, or over $340 per U.S. household.
What does all this mean? It suggests that U.S. agriculture is entering a very risky environment with respect to international trade. On the downside, agriculture risks losing much of the trade gains achieved over the past 20–30 years, which would result in significant economic damage to U.S. agriculture. On the upside, if USMCA were approved, if the trade war ended, and if the U.S. were to rejoin TPP, U.S. agriculture could see not only the gains of the past decades reinforced but the potential open for additional trade gains. The outcome is clearly critical for the future of U.S. agriculture.
Aguiar, A., B. Narayanan, and R. McDougall. 2016. “An Overview of the GTAP 9 Data Base.” Journal of Global Economic Analysis 1(1):181–208.
Chepeliev, M., W. Tyner, and D. van der Mensbrugghe. 2019. “How Differing Trade Policies May Impact U.S. Agriculture: The Potential Economic Impacts of TPP, USMCA, and NAFTA.” Oak Brook, IL: Farm Foundation. Available online: https://d2fxn1d7fsdeeo.cloudfront.net/farmfoundation.com/wp-content/uploads/2019/03/05112739/FINAL-March-2019-Purdue-GTAP-ANALYSIS.pdf.
Ciuriak, D., L. Ciuriak, A. Dadkhah, and J. Xiao. 2017. “Quantifying the Termination of NAFTA.” Working paper, Ciuriak Consulting Inc. Available online: https://www.cdhowe.org/sites/default/files/Technical%20Paper.pdf.
Corong, E., T. Hertel, R. McDougall, M. Tsigas, and D. van der Mensbrugghe. 2017. “The Standard GTAP Model, Version 7.” Journal of Global Economic Analysis 2(1):1–119.
Food and Agricultural Organization. 2018. FAOSTAT. Available online: http://www.fao.org/faostat/en/#data. [Accessed Sep. 26, 2018].
Jafari, Y., and D.G. Tarr. 2015. “Estimates of Ad Valorem Equivalents of Barriers against Foreign Suppliers of Services in Eleven Services Sectors and 103 Countries.” World Economy 40(3):544–573
Kee, H.L., A. Nicita, and M. Olarreaga. 2009. “Estimating Trade Restrictiveness Indices.” Economic Journal 119(534):172–199.
Li, M. 2018. CARD Trade War Tariffs Database. Available online: https://www.card.iastate.edu/china/trade-war-data/ [Accessed Oct. 19, 2018].
Market Access Map (MACMAP). 2018. TPP Tariffs. Available online: https://www.macmap.org. [Accessed Nov. 8, 2018].
Office of the U.S. Trade Representative. 2018. United States-Mexico-Canada Trade Fact Sheet - Agriculture: Market Access and Dairy Outcomes of the USMC Agreement. Available online: https://ustr.gov/about-us/policy-offices/press-office/fact-sheets/2018/october/united-states%E2%80%93mexico%E2%80%93canada-trade-fact [Accessed Oct. 26, 2018].
Petri, P.A. and Plummer, M.G. 2016. “The Economic Effects of the Trans-Pacific Partnership: New Estimates.” Working paper 16-2, Peterson Institute for International Economics. Available online: https://piie.com/publications/wp/wp16-2.pdf.
Taheripour, F., and Tyner, W. 2018. “Impacts of Possible Chinese Protection of 25% on US Soybeans and Other Agricultural Commodities.” Working paper 83, Global Trade Analysis Project. Available online: https://www.gtap.agecon.purdue.edu/resources/download/9074.pdf.
United Nations. 2018. UN Comtrade Database. Available online: https://comtrade.un.org/. [Accessed Sep. 26, 2018].
Walmsley, T., and P. Minor. 2017. “Reversing NAFTA: A Supply Chain Perspective.” Working Paper, ImpactECON. Available online: https://impactecon.com/resources/reversing-nafta/ [Accessed Oct. 24, 2018].
World Bank. 2018. World Bank Open Data. Available online: https://data.worldbank.org/. [Accessed Sep. 25, 2018].
Zheng, Y., D. Wood, H.H. Wang, and J.P.H. Jones. 2018. “Predicting Potential Impacts of China’s Retaliatory Tariffs on the U.S. Farm Sector.” Choices 33(2).

