Much public discussion and analysis has accompanied the announcements by the Trump administration in 2018 and 2019 of assistance to farmers in response to trade damage caused by tariffs imposed by China and other affected U.S. trading partners on U.S. products, particularly agricultural commodities (e.g., Giri, Peterson, and Sharma, 2018; Schnepf et al., 2019; Schnepf, 2019). The foreign tariffs were imposed in retaliation for U.S. tariffs previously imposed by the Trump administration on imports from those countries due to “concerns over national security and unfair trade practices” (Schnepf et al., 2019). The fiscal year (FY) 2018 and FY 2019 “trade aid packages” offered $12 billion and $16 billion, respectively, of relief to U.S. farmers from the damage caused by “unjustified retaliatory tariffs,” especially by China (USDA, 2019a). Most of the assistance took the form of Market Facilitation Program (MFP) payments to farmers ($10 billion in 2018 and $14.5 billion in 2019). A much smaller portion was directed to a Food Purchase and Distribution Program (FPDP) to purchase various agricultural commodities and distribute them through domestic nutrition assistance programs ($1.2 billion in 2018 and $1.4 billion in 2019).
The smallest and most-often overlooked component of the USDA trade aid packages in both years is the Agricultural Trade Promotion (ATP) program, which allocated additional funding of $200 million in FY 2018 and $100 million in FY 2019 to the USDA Foreign Agriculture Service (FAS) to “boost trade promotion efforts” (Schnepf et al., 2019). The additional trade promotion funds were directed to the Foreign Market Development Program (FMDP) and the Market Access Program (MAP), the two major FAS trade-promotion programs. The ATP allocations amounted to only 1.67% and 0.625% of the total trade aid packages in FY 2018 and FY 2019, respectively. Nevertheless, the allocation nearly doubled the combined funding for FMDP and MAP for FY 2018 and added almost 50% to their combined funding for FY 2019. Under the last several farm bills, Congress provided a flat $200 million annually to FMDP and $34.5 million annually to MAP. In fact, MAP has been funded annually at that level since 2006 and FMDP at its level since 2002. The current farm bill maintains that level of funding for the two programs through 2023. Interestingly, President Trump’s budgets for both FY 2018 and FY 2019 called for an elimination of both programs.
MAP and FMDP provide cost-share funding for public–private partnerships between the USDA FAS and nonprofit U.S. agricultural trade associations, farmer co-operatives, nonprofit state-regional trade groups and small businesses to conduct overseas marketing and promotional activities (Reimer et al, 2017). MAP promotes exports through consumer promotion, market research, trade shows, and trade servicing in foreign markets. Both generic and some brand promotion are financed through MAP, which is used primarily by organizations promoting exports of processed products, fruits, vegetables, nuts, and bulk and intermediate products. MAP currently provides cost-share funding to 65 nonprofits and co-operatives (USDA, 2019b).
FMDP focuses on trade servicing and trade capacity building by opening, expanding, and maintaining long-term markets for U.S. agricultural products (Reimer et al., 2017). FMDP activities emphasize foreign market issues relating to infrastructure and other market impediments, processing capacities, product codes and standards, and new market or new use opportunities, among others (CRS, 2017). FAS partners with U.S. agricultural producers and processors represented by nonprofit commodity or trade associations called co-operators. FMDP currently provides cost-share funding to 22 such co-operators (USDA, 2019b).
Despite essentially flat funding levels for FMDP and MAP over the last decade or more, total spending under the programs has increased sharply because industry contributions have increasingly exceeded the cost-share requirement. Industry contributions amounted to 71% of total USDA Export Market Development Program spending in 2014 compared with 59% in 2009 and 61% in 2004 (Williams, et al., 2016). In terms of the cost-share requirement, industries contributed 240% in 2014 compared with 171% in 2009 and 158% in 2004. Williams et al. (2016) cite the growth in industry contributions as evidence of recognition by contributing groups that government-supported export promotion is a successful tool for opening, expanding, and maintaining export markets.
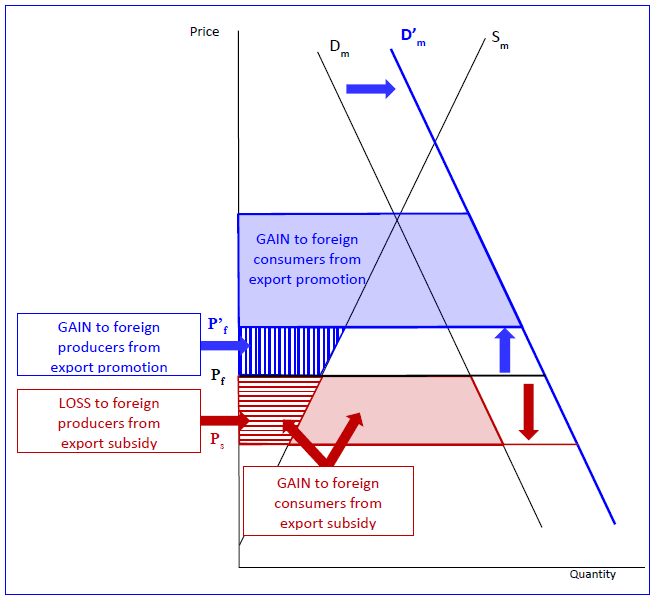
The term “export promotion” is often used as a synonym for export subsidy (see, e.g., De Baere and du Parc, 2009). Although all export subsidies may be considered forms of export promotion, not all export promotion activities are export subsidies. As carried out under the FAS export market development programs, “export promotion” differs from export subsidies in important ways. Importantly, export subsidies lower the prices of subsidized imported goods in importing countries, while export promotion tends to raise the price of promoted goods in importing countries. Figure 1 depicts a “large” importing country that produces (supply curve Sm) and consumes (demand curve Dm) some imported commodity. A “large” importing country is one whose imports are large enough to influence world prices for the imported commodity to some extent. On the other hand, a “small” importing country is a price taker in world markets, one whose import levels have essentially no impact on world market prices.
Given an export supply of that good to the importing country, an export subsidy of Vx = P'f − Ps lowers the price in the importing country from Pf (the free trade level) to Ps in Figure 1, which benefits consumers and harms producers in that country. Economists would say that the export subsidy reduces producer surplus (red lined area) but enhances consumer surplus (red solid area plus the lined red area).
In contrast, assume that export promotion through foreign market development shifts out the demand curve in the importing country from Dm to D'm and raises the price from Pf to P'f in Figure 1. Consequently, import-competing producers in the importing country benefit from the higher price while consumers benefit from greater access to products they desire. In this case, economic surplus increases for both producers (blue lined area) and consumers (blue solid area) in the importing country. Note that the gain to consumers from promotion in the importing country is found by moving the triangle representing consumer surplus before promotion in Figure 1 (the area to the left of the original demand curve, Dm, and above the original price line at Pf) vertically up into the area representing consumer surplus with promotion (the area to the left of the new demand curve, D'm, and above the new price line at P'f) as far as it will go. The remaining area is the blue-shaded area, representing the area by which the new consumer surplus with promotion is greater than the area representing consumer surplus before promotion.
The magnitudes of the producer and consumer gains and losses from export subsidies relative to export promotion change as the magnitudes of the export subsidy and promotion change and as the price elasticities of demand and supply in the importing country and of the export supply facing the country change. Regardless, the directions of change remain the same. Foreign producers lose from export subsidies and gain from export promotion. Foreign consumers gain in both cases. The gain to foreign producers from export promotion goes to zero as the export supply elasticity increases (the case of a small, price-taking importing country). The gain to foreign consumers from export promotion increases in such situations. The opposite occurs with a decline in the export supply elasticity.
Note that the export subsidy and export promotion both raise the price of the good exported in world markets (Pf to P'f in Figure 1) so that both operate to benefit producers in the exporting country. Consequently, the trade aid package allocations to FMDP and MAP can benefit U.S. producers just like an export subsidy but without the undesirable negative effects on producer welfare in importing countries. At the same time, such export market promotion activities, “including market information, advice and promotion relating to particular products” are listed as “green box” policies in Annex 2 of the 1994 World Trade Organization (WTO) Agreement on Agriculture (AoA). Thus, unlike export subsidies, export promotion is legal under the General Agreement on Tariffs and Trade (GATT) and not subject to any reductions stemming from the WTO Nairobi agreement. Of course, like an export subsidy, export market development also tends to raise the U.S. price of promoted goods, which tends to reduce U.S. consumer welfare.
Although it is a GATT-legal means of expanding exports that also avoids the negative foreign producer welfare effects of export subsidies, does export promotion effectively expand U.S. agricultural and food exports? The conclusion across the large body of literature on export promotion across a broad range of agricultural commodities is that export promotion pays. Over a representative sample of export promotion studies, the reported benefit–cost ratio (BCR), the commonly used metric of the return on investment in export promotion, ranges from $4 to $60 per $1 invested in export promotion, with an average of about $10 (see Reimer et al., 2017; Williams et al., 2016; CRS, 2017).
A few of those studies have analyzed the return to public investments in FMDP and MAP combined. Two studies by IHS Global Insight (2007, 2010) reported BCRs of $25 and $35, respectively, in additional U.S. agricultural export revenue (gross) per $1 spent on trade promotion through the two programs. More recently, Williams et al. (2016) estimated the BCR for the combined FMDP and MAP to be between the two IHS Global Insight estimates, at $28.3 per $1 spent.
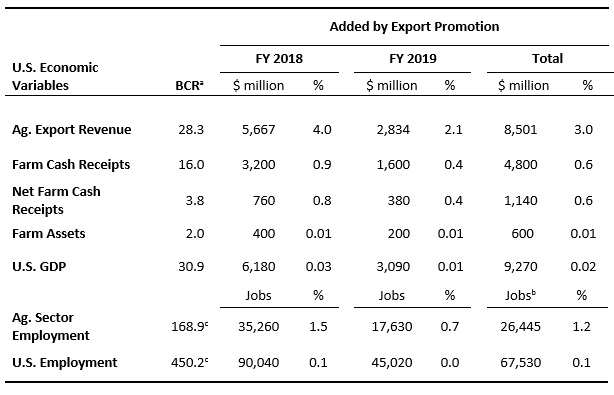
Source: Calculated by author from information in Williams
et al. (2016).
a Upper bounds of benefit–cost ratios (dollars added per $1
of export promotion), reported by Williams et al. (2016).
b Average of FY 2018 and FY 2019.
c Jobs created per $1,000,000 of promotion.
The Williams et al. (2016) study also reports BCRs as metrics of the effects of those two programs on various other key U.S. economic variables including those listed in the left column of Table 1. The BCRs in column 2 of Table 1 indicate the estimated upper bounds of the gains in the corresponding variables per $1 spent by USDA on export promotion through MAP and FMDP in the Williams et al. (2016) study. In other words, the increases in the values of the listed economic variables per $1 spent through FMDP and MAP are not likely to be greater than indicated by the respective BCRs in Table 1 (Williams et al., 2016). Thus, based on the Williams et al. (2016) results, the total increase in funding of $300 million for FMDP and MAP in the ATP components of the trade aid packages for FY 2018 and FY 2019 will create no more than $8.5 billion in additional U.S agricultural export revenue, an addition of up to about 3% over levels forecast by USDA for those two years (Daugherty and Jiang, 2019).
In turn, the additional export revenue has implications (albeit small) for the overall agricultural sector. Based on the BCRs reported by Williams et al. (2016) in Table 1, the additions to MAP and FMDP in FY 2018 and FY 2019 will increase U.S. farm cash receipts by up to $4.8 billion, farm assets by up to $600 million, and agricultural sector employment by up to 26,445 jobs, all increases of no more than 1% or less over the corresponding USDA estimates of the levels of those variables in those years (USDA, 2019c). The small gains in the agricultural sector will lead to even smaller gains in the overall economy. U.S. gross domestic product (GDP) will increase by up to $9.3 billion and overall U.S. employment will rise by up to 26,445 jobs, both nearly imperceptible upticks from estimated levels (St. Louis Fed, 2019; CBO, 2019).
Despite the generally large BCRs estimated for USDA export promotion programs, the small relative allocations of the trade aid package to those programs results in small relative benefits to the U.S. agricultural and overall economies. One possible conclusion is that the allocation to ATP programs affords little assistance to producers and may even have been unnecessary given research concluding that, at least for corn, sorghum, and soybean producers, MFP alone will provide more than adequate compensation for losses caused by the Chinese tariffs (Giri, Peterson, and Sharma, 2018; Schnepf, 2019).
An alternative conclusion, however, might be that too little of the trade aid package was allocated to ATP programs. The large body of literature on export promotion programs concludes that the high BCRs estimated for such programs imply that they are generally underfunded and, thus, underutilized as tools to enhance agricultural exports and the U.S. agricultural sector. In the case of MAP and FMDP, for example, the BCR of $28.3 reported by Williams et al. (2016) indicates that, for every $1 in additional funding not allocated to FMDP and MAP, the U.S. agricultural sector loses an average of $28.3 in additional export revenue. Of course, increases in promotion funding generally are accompanied by reductions in the corresponding BCRs due to diminishing returns to increasing investments in export promotion. With such a high estimated export promotion BCR, however, funding for USDA agricultural export promotion programs could be increased substantially before the BCR would decline to a level at which continued increases in funding would generate smaller increases in export revenue.
If USDA export promotion programs are underfunded, as suggested by the high BCRs estimated for those programs by Williams et al. (2016) and previous studies by IHS Global Insight (2007, 2010), suppose that substantially more of the trade aid package funds were allocated to ATP programs. An extreme and unlikely case would be the allocation of all the trade aid funding to ATP. Following the same process used previously, allocating all the trade aid funding of $12 billion in FY 2018 and $16 billion in FY 2019 to ATP programs would increase agricultural exports by up to about 280%, enhance farm cash receipts by up to no more than 60%, and double employment in the agricultural sector (Table 2). Such an allocation to export promotion would also deliver benefits to the overall U.S. economy, bumping U.S. GDP by up to 2% and U.S. employment by up to 4%. While such additions to USDA export promotion programs are unlikely, this example demonstrates the potential of those programs to deliver substantial benefits to the U.S. agricultural and overall economy.
Of course, as noted, the diminishing returns associated with such a large expansion of the USDA export promotion program would likely reduce the BCRs reported by Williams et al. (2016) and used in the calculations in Table 2. Even if the BCRs dropped by, say, 75%, however, agricultural export revenue would still increase by up to 60%, farm cash receipts by up to 13%, and agricultural sector employment by up to 25% from allocating all the trade aid funding to the ATP component. Whether such gains would be greater than those that might have been achieved by instead allocating the entire trade aid package funding to MFP or a combination of MFP and FPDP is not clear. Such a determination would require a comparable analysis of the overall impacts of those programs on the U.S. agricultural and general economies.
The purpose of these “what if” scenarios is not to argue that more of the trade aid package funding should have been allocated to ATP. Rather, the purpose is to illustrate the potential effectiveness of the substantially underfunded USDA export promotion programs as a mechanism to support the U.S. agricultural sector and to mitigate the negative effects of tariffs on foreign imports of U.S. agricultural commodities. Like export subsidies, these programs tend to increase the cost of food to U.S. consumers, but unlike export subsidies, they expand exports without reducing producer welfare in importing countries, enhance consumer welfare in importing countries, and are legal under WTO rules.
The inclusion of agricultural trade promotion as one of three components of the trade aid packages in FY 2018 and FY 2019 could be understood as tacit recognition of its potential effectiveness in supporting the agricultural sector and in mitigating the export-depressing effects of the tariffs imposed on U.S. agricultural exports by China and other U.S. trading partners. The funds allocated to ATP were relatively small, however, so the support to agriculture and the tariff mitigation effects are correspondingly low. Given the high BCRs to export promotion through MAP and FMDP as reported by several studies, increased funding to those underfunded programs could produce rather dramatic results, even if diminishing returns to the increased investment in promotion substantially reduced their high BCR levels. The longer the tariff war with China and others continues, the more beneficial additional funding for both public and private agricultural export promotion programs could become as a means of mitigating the negative U.S. export effects of the tariffs. A side benefit of export promotion as a means of supporting the agricultural sector and boosting exports is that it is legal under WTO and avoids the negative effects on producer welfare in importing countries that result from promoting exports through traditional export subsidy programs while still benefiting consumers in those countries.
Congressional Budget Office (CBO). 2019. The Budget and Economic Outlook, 2019 to 2029. Washington, DC: U.S. Congress. Available on-line: https://www.cbo.gov/publication/54918.
Congressional Research Service (CRS). 2017. USDA Export Market Development and Export Credit Programs: Some Selected Issues. Washington, DC: Congressional Research Service, CRS Report R44985, October.
Daugherty, K., and H. Jiang. 2019. Outlook for U.S. Agricultural Trade. Washington, DC: U.S. Department of Agriculture, Economic Research Service, Report AES-108, May.
De Baere, P., and C. du Parc. 2009. Export Promotion and the WTO: A Brief Guide. Geneva, Switzerland: International Trade Centre. Available on-line: http://www.intracen.org/Export-Promotion-and-the-WTO-A-Brief-Guide/
Federal Reserve Bank of St. Louis (St. Louis Fed). 2019. “Employment Level: Agriculture and Related Industries.” FRED Economic Data. Available on-line: https://fred.stlouisfed.org/series/LNU02034560 [Accessed June 19, 2019].
Giri, A., E.W.F. Peterson, and S. Sharma. 2018. “The Impact of the Market Facilitation Program on U.S. Soybean, Sorghum and Corn Producers.” Choices 33(4): 1–7.
IHS Global Insight. 2007. A Cost-Benefit Analysis of USDA’s International Market Development Programs. Report to the USDA Foreign Agricultural Service. Eddystone, PA: IHS Global Insight Agriculture Service.
IHS Global Insight. 2010. A Cost-Benefit Analysis of USDA’s International Market Development Programs. Report to the USDA Foreign Agricultural Service. Eddystone, PA: IHS Global Insight Agriculture Service. Available on-line: https://www.fas.usda.gov/sites/development/files/2013-09/market_development_eval-2010.pdf.
Reimer, J.J., G.W. Williams, R.M. Dudensing, and H.M. Kaiser. 2017. “Agricultural Export Promotion Programs Create Positive Economic Impacts.” Choices. 32(3): 1–7.
Schnepf, R. 2019. Farm Policy: USDA’s Trade Aid Packages. Washington, DC: Congressional Research Service, Report R45865, November.
Schnepf, R., J. Monke, M. Stubbs, and A. Regmi. 2019. Farm Policy: USDA’s Trade Aid Package. Washington, DC: Congressional Research Service, Report R45310, June.
U.S. Department of Agriculture (USDA). 2019a. “USDA Assists Farmers Impacted by Unjustified Retaliation.” Washington, DC: U.S. Department of Agriculture, Press Release No. 0151.18, May. Available on-line: https://www.usda.gov/media/press-releases/2018/07/24/usda-assists-farmers-impacted-unjustified-retaliation.
U.S. Department of Agriculture (USDA). 2019b. “Foreign Agriculture Service: Programs.” Washington, DC: U.S. Department of Agriculture, Foreign Agriculture Service. Available on-line: https://www.fas.usda.gov/programs.
U.S. Department of Agriculture (USDA). 2019c. “Farm Income and Wealth Statistics.” March 6 release. Washington, DC: U.S. Department of Agriculture, Economic Research Service. Available on-line: https://www.ers.usda.gov/data-products/farm-income-and-wealth-statistics/.
Williams, G.W., J. J. Reimer, R. M. Dudensing, B.A. McCarl, H.M. Kaiser, and J. Somers. 2016. Economic Impact of USDA Market Development Programs. Report prepared for U.S. Wheat Associates, USA Poultry and Egg Export Council, Pear Bureau Northwest, and the USDA Foreign Agriculture Service, Washington, DC: Informa Economics, IEG. Available on-line: https://www.fas.usda.gov/sites/default/files/2016-10/2016econimpactsstudy.pdf.

