Over the last eighty years, U.S. federal crop insurance has evolved from an experimental program, limited to only a few field crops in major producing regions, into a national program that covers all major crops, including speciality crops. In this article, we provide a brief overview of the history of the federal crop insurance program and analyze the recent development of Whole Farm Revenue Protection—WFRP—which had a higher premium subsidy rate and lower loss ratio in 2015 than all other federal crop insurance programs. The lower loss ratio for WFRP may be attributable to risk pooling and the whole farm premium subsidy to encourage program participation at the margin by relatively efficient operations. WFRP serves as a complement for buy-up insurance and a substitute for ad hoc disaster assistance and catastrophic risk protection—CAT. A farm can’t purchase WFRP and CAT simultaneously, but WFRP can be purchased with buy-up coverage and to insure the previously uninsurable portion of a farm that is eligible for ad hoc disaster assistance.
The practice of insuring one crop at a time, as opposed to insuring the whole farm production, runs counter to the traditional risk management practice of risk pooling—insuring a broad cross-section of risks to reduce the potential impact of any single risk. Several studies find that the fair price of insurance (the premium) would be lower for whole farm insurance than for commodity-specific insurance plans (Bielza and Garrido, 2009; Hart, Hayes, and Babcock, 2006). Bielza and Garrido (2009) conclude that whole farm insurance would benefit producers and improve the efficiency of the government’s insurance subsidies. Effective risk pooling is more likely if many producers purchase crop insurance, but this can be difficult to achieve if there is significant adverse selection—producers who are more likely to suffer a loss are also more likely to purchase insurance. Whole farm insurance may increase risk pooling in the crop insurance program because farms without a commodity-specific insurance plan available for their commodities can now participate and because it reduces the transaction costs of crop insurance relative to purchasing separate insurance plans for specific commodities.
Risk: Exposure to uncertainty.
Revenue insurance: Whereas yield insurance compensates the insured when yield falls below a specified level, revenue insurance compensates the insured when gross revenue (yield multiplied by price) falls below a specified level.
Liability: An insurer’s financial debt or obligations to the insured; the value of the insured asset.
Coverage level: The percentage of the insured value covered by insurance.
Premium: The amount payable by the insured to the insurer for the period—or term—of insurance granted by the policy; the price of insurance.
Premium subsidy: The amount of the crop insurance price—the premium—that is paid by the federal government on producers’ behalf.
Indemnity: The amount payable by the insurer to the insured in the event of an insured loss.
Loss ratio: Indemnity divided by premium, with a value of one representing a program that breaks even and higher values representing less efficient programs.
Turvey (2012) assesses the potential for unintended consequences of whole farm revenue insurance and finds that producers may alter farm plans in response to the type of insurance and level of subsidy available. Production responses to changes in subsidized whole farm insurance result from producers’ optimizing behavior and moral hazard. Moral hazard occurs if producers engage in less efficient behavior when they are insured than when they’re not. With insurance, there is less incentive for efficient farming practices because insurance cuts off the lower end of the revenue distribution, guaranteeing some minimum level of revenue regardless of production outcomes.
Private companies rarely sell crop insurance if the government does not subsidize it. It is difficult to earn a profit selling crop insurance because adverse selection can cause the fair price of crop insurance to increase, pricing out the lowest-risk producers and reducing the size and diversity of the insurance pool. Federally subsidized Multiple-Peril Crop Insurance was established during the Dust Bowl era of the 1930s to cover losses from extreme weather and natural disasters. To reduce the adverse selection problem, major policy changes have focused on expanding the insurance pool. However, crop insurance operated on a limited basis until major policy changes in the mid-1990s and 2000:
These policy changes significantly affected the market for federally subsidized crop insurance. Over 295 million acres were insured in 2013, nearly 90 million more than in 2000 (U.S. Department of Agriculture, 2016a). Increases in premium subsidies between 1997 and 2002 induced more producers to participate and resulted in higher coverage levels, total premiums, and premiums per acre (O’Donoghue, 2014). Currently, more than 80% of land planted to major field crops in the United States is insured under the federal crop insurance program. Program growth in acreage since 2004 has been largely due to new insurance plans offered for rangeland and forage (U.S. Department of Agriculture, 2016a). These new products accounted for about 57 million acres, or roughly 20% of the 295 million acres insured, but less than 3% of total insurance premiums in 2013 due to their relatively low premium per acre. The federal crop insurance program has become the main agricultural risk management tool since the enactment of the 2014 Farm Bill.
The basic concept of whole farm insurance is to provide insurance coverage for all agricultural commodities in one insurance product and establish revenue as a common denominator for all commodities (U.S. Department of Agriculture, 2014a,b). The first whole farm insurance plans were Adjusted Gross Revenue—AGR—and Adjusted Gross Revenue Lite—AGR-L. They were WFRP pilot programs that were available for select counties and discontinued after 2014 (Schnitzler, 2017). Farms were not eligible for AGR if more than 50% of expected income was from insurable commodities or if more than 35% of expected allowable income was from animals and animal products. Farms were not eligible for AGR-L if more than 50% of total revenue was from commodities bought for resale or if more than 83.35% of total revenue was from potatoes. AGR and AGR-L could stand alone or be used in conjunction with other federal crop insurance plans-but not each other. Their premium was reduced if they were purchased with other federal crop insurance plans—but not to each other. For AGR-L, there was an inverse relation between coverage level and premium subsidy rates; for the coverage levels of 80%, 75%, and 65%, the premium subsidy rates were 48%, 55%, and 59%, respectively. The premium subsidy rate is the percentage of the crop insurance price—premium—paid by the federal government on a producer’s behalf.
WFRP is available to more farms and has higher premium subsidy rates than AGR and AGR-L. It is designed for farms with up to $8.5 million in insured revenue for all commodities except forest products and animals for sport, show, and pets (U.S. Department of Agriculture, 2016e). WFRP was available to most counties in the United States in 2015 and all counties in 2016. As shown in Table 1, it is designed to encourage commodity diversity, as premium subsidy rates and available coverage levels increase with the farm’s “commodity count”:
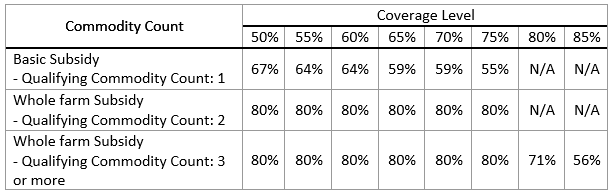
Source: U.S. Department of Agriculture (2014c).
Farms with CAT coverage are not eligible for WFRP. WFRP is available with other crop insurance plans purchased at buy-up coverage levels that exceed the basic CAT coverage. When a producer buys WFRP with another insurance plan, the WFRP premium is reduced due to the coverage provided by the other plan. It also provides replant coverage for annual crops, except those covered by another plan. Replant coverage equals the cost of replanting, up to a maximum of 20% of the expected revenue, when 20% or 20 acres of the crop need replanting. As with all other federal crop insurance plans, the federal government pays the premium subsidies for producers and reinsurance guarantees for the private companies that partner with the government to offer insurance.
At least three characteristics of WFRP may affect the efficiency of the federal crop insurance program. The first two may address adverse selection and are likely to promote efficiency, while the third has ambiguous effects on efficiency.
Information on the liability, premium, premium subsidy, indemnity, and loss ratio for WFRP and all other federal crop insurance programs in 2015 is reported in Table 2. For WFRP, Table 2 also reports this information by coverage level. The most popular coverage level for WFRP was 75%, accounting for 67% of the total liability, 67% of premium paid, 69% of premium subsidies, and 60% of indemnity payments. This suggests that the three-commodity count threshold or lower subsidy rates was a deterrent to adopting the highest coverage levels. The loss ratio increased with coverage level. This may be a sign of intra-program adverse selection, where less efficient producers select the highest levels of protection. The total liability for WFRP was more than $1.1 billion and the liability per policy was more than $939,000. The liability for WFRP is about 1% of the liability for all other federal crop insurance programs, but WFRP has significantly higher liability per policy, premium per policy, premium subsidy per policy, and indemnity per policy than all other federal crop insurance programs. This suggests that WFRP is a relatively small program that is still in its infancy but that, on average, higher-value assets were insured under WFRP than under other crop insurance plans.
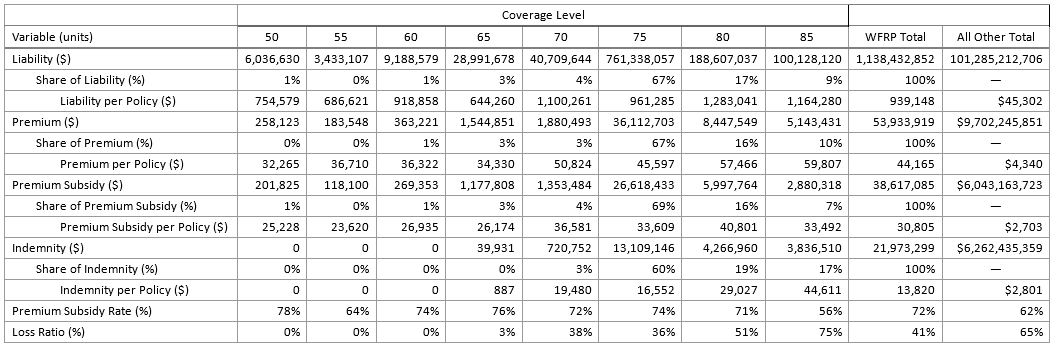
Note: Percentages are rounded to nearest percent. Dollar values are rounded to the nearest dollar. The data used
for generating Tables 2 and 3 are from the Risk Management Agency Summary of Business Reports and Data for
2015–2016 (U.S.Department of Agriculture, 2016b). The data for 2016 does not yet provide information on indemnity
payments because 2016 production data are not yet fully available to the public. Thus, we do not analyze indemnity
payments and loss ratios for 2016.
There are at least three reasons why relatively high-value assets are covered under WFRP. First, WFRP reduces the transaction costs of crop insurance relative to purchasing separate insurance plans for specific commodities, which may encourage producers to insure more crops under a single plan. Second, producers can purchase WFRP to insure the previously uninsurable portion of a farm that is eligible for ad hoc disaster assistance, which may encourage producers to insure more crops. Third, farms with CAT coverage are not eligible for WFRP; if all else is equal, average coverage levels and liability will be higher for WFRP than for crop-specific plans because CAT provides the minimum 50% coverage level. The average premium subsidy rate for WFRP was 72%, which indicates that many farms participating in WFRP received the whole farm subsidy and had at least two commodities. The premium subsidy rate for WFRP is significantly higher than the 62% premium subsidy rate for all other federal crop insurance programs. The WFRP loss ratio was 0.41, significantly lower than the loss ratio for all other federal crop insurance programs—0.65.
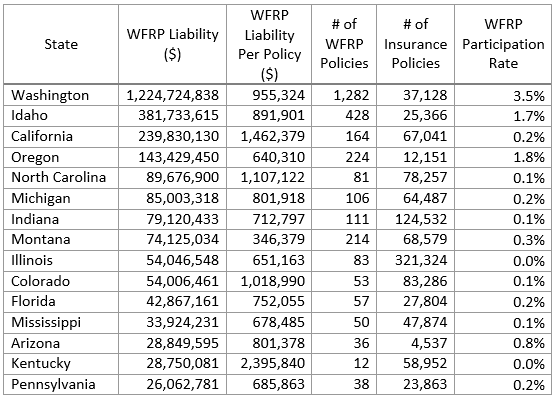
Note: Participation rate is rounded to the nearest tenth of a percent.
Table 3 shows that the liability in the WFRP program is highest in Washington, Idaho, California, and Oregon. The liability in Washington is more than three times the liability in the second top state, Idaho. By 2016, 3,340 WFRP policies were sold in the United States. More than two-thirds of the policies sold—69%—were sold in Washington, Idaho, Oregon, Montana, and California. The liability per policy was highest in Kentucky, California, North Carolina, and Colorado. The participation rate, which is the number of WFRP policies divided by the number of all federal crop insurance policies, is highest in Washington (3.5%), Oregon (1.8%), Idaho (1.7%), and Arizona (0.8%). Participation rates may be relatively high in these states because they produce many specialty crops without available commodity-specific insurance and have been relatively reliant on federal ad hoc disaster assistance.
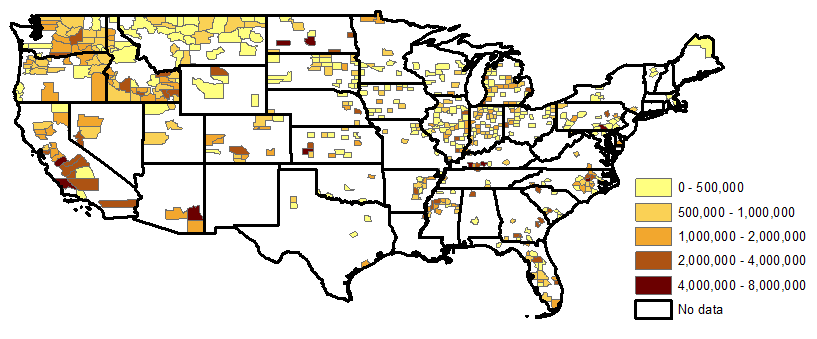
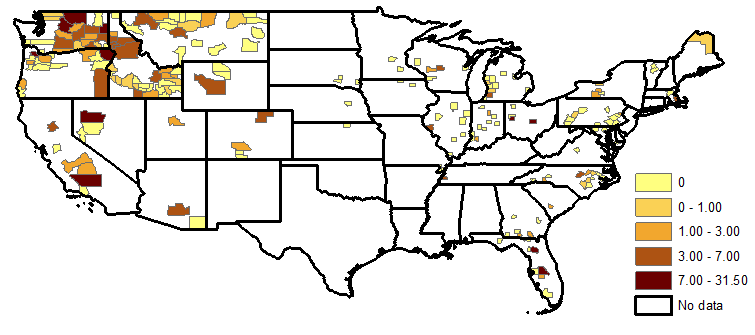
At the county level, the number of WFRP policies sold are most concentrated in the Columbia River Valley of Washington, Snake River Plain and Palouse regions of Idaho, northern Montana, San Joaquin Valley of California, and scattered patches across Oregon (Figure 1). In California, the liability per policy is relatively high (Figure 2) and the premium subsidy rates are relatively low (Figure 3). Since premium subsidy rates are tied to a farm’s commodity count (Table 1), the relatively low premium subsidy rates in California indicate that many of these farms either have at least three commodities and adopt the highest coverage levels or have one commodity. Given the extreme diversity of California agriculture, the former is more likely than the latter and suggests that the three-commodity threshold was not a significant deterrent to adopting the highest coverage levels for farms in California. Outside of California, most counties had average premium subsidy rates of 70–80%, indicating that the government paid for approximately three-fourths of the price of crop insurance on producers’ behalf and that many of these farms had two or three commodities. Based on the limited data for 2015, loss ratios are relatively high on the West Coast (Figure 4). This may not be a reliable spatial representation because 2015 was the culmination of a historic four-year drought on the West Coast, which likely inflated loss ratios in this area. Comparing Figure 4 to Figures 1–3 shows that most of the counties that participated in WFRP in 2016, but not in 2015, are outside of the Pacific Northwest. Thus, many of the earliest adopters of WFRP were in the Pacific Northwest.
|
Figure 1: Whole Farm Revenue Protection Policies Sold Is Most Concentrated in Pacific Northwest and California, 2015-2016
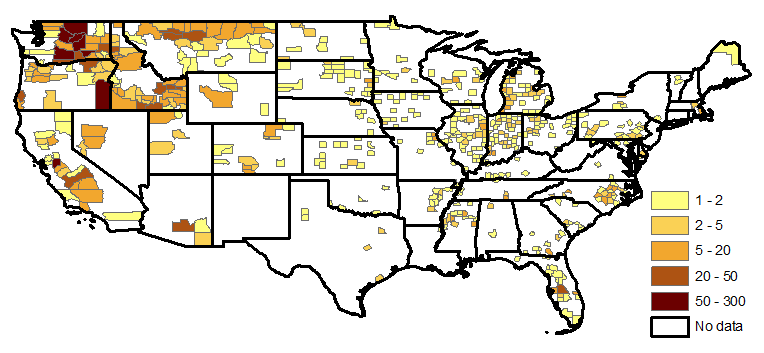 |
Figure 2: Average Liability per Whole Farm Revenue Protection Policy Is Relatively High in California, 2015-2016
 |
|
Figure 3: Average Premium Subsidy Rate for Whole Farm Revenue Protection Policies Is Relatively Low in California, 2015-2016
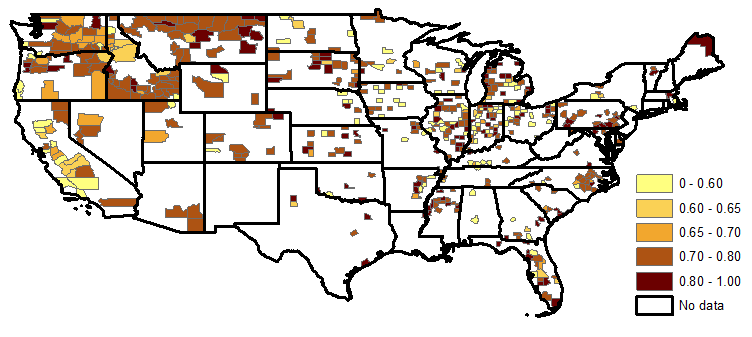 |
Figure 4: Loss Ratio for Counties for Whole Farm Revenue Protection, 2015
 |
The USDA Risk Management Agency undertook significant educational effort to help insurance agents and producers in the Pacific Northwest understand WFRP because this was one of the first areas to receive AGR and AGR-Lite. Many producers used these whole farm revenue insurance plans to cover their fruit crops (Webb, 2016). WFRP is a complement for buy-up insurance, especially in the Midwest and eastern United States where CAT coverage and ad hoc disaster assistance have been less popular than in other areas. WFRP is a substitute for CAT coverage, especially in the western, southern, and northeast United States, where CAT coverage is relatively popular and average coverage levels are relatively low (Dismukes and Glauber, 2005). WFRP is a substitute for ad hoc disaster assistance, especially in the West, where many specialty crops without available commodity-specific insurance are produced. As shown in Table 3, there is interest in WFRP throughout the country, but participation rates remain low. Further educational effort may increase WFRP participation in other locations, enhance risk pooling in the federal crop insurance program, and reduce reliance on ad hoc disaster assistance and CAT coverage. California—the nation’s most prolific and diverse farm economy—is a prime candidate for expanded educational effort because its WFRP participation rates are surprisingly low. As the fledgling WFRP program continues, it is prudent to track its outcomes and estimate its effects on agricultural production and the federal crop insurance program.
Bielza, M., and A. Garrido. 2009. “Evaluating the Potential of Whole-Farm Insurance over Crop-Specific Insurance Policies.” Spanish Journal of Agricultural Research 7(1):3–11.
Dismukes, R., and J. Glauber. 2005. “Why Hasn't Crop Insurance Eliminated Disaster Assistance?” Amber Waves, June.
Hart, C.E., D.J. Hayes, and B.A. Babcock. 2006. “Insuring Eggs in Baskets: Should the Government Insure Individual Risks?” Canadian Journal of Agricultural Economics 54(1):121–137.
O'Donoghue, E. 2014. The Effects of Premium Subsidies on Demand for Crop Insurance. Washington, D.C.: U.S. Department of Agriculture, Economic Research Service, Economic Research Report 169, July.
Schnitzler, G.R. 2017 (March 15). Personal communication.
Turvey, C.G. 2012. “Whole Farm Income Insurance.” Journal of Risk and Insurance 79:515–540.
U.S. Department of Agriculture. 2014a. Adjusted Gross Revenue. Risk Management Agency, Washington, D.C., June. Available online: http://www.rma.usda.gov/pubs/rme/agr2014.pdf
U.S. Department of Agriculture. 2014b. Adjusted Gross Revenue-Lite. Risk Management Agency, Washington, D.C., June. Available online: http://www.rma.usda.gov/pubs/rme/agr-lite2014.pdf
U.S. Department of Agriculture. 2014c. Whole-Farm Revenue Protection (WFRP) Plan FAQs. Risk Management Agency, Washington, D.C., November. Available online: http://www.rma.usda.gov/help/faq/wfrp.html
U.S. Department of Agriculture. 2016a. Government Programs & Risk. Economic Research Service, Washington, D.C., November. Available online: https://www.ers.usda.gov/topics/farm-practices-management/risk-management/government-programs-risk/
U.S. Department of Agriculture. 2016b. Summary of Business Reports and Data. Risk Management Agency, Washington, D.C. Available online: http://www.rma.usda.gov/data/sob/scc/index.html
U.S. Department of Agriculture. 2016c. U.S. Crop Insurance Subsidies Outpace Ad-Hoc Disaster Assistance Payments. Economic Research Service, Washington, D.C., September. Available online: https://www.ers.usda.gov/data-products/chart-gallery/gallery/chart-detail/?chartId=77773
U.S. Department of Agriculture. 2016d. Use of Crop Insurance on U.S. Farms Continues to Grow. Economic Research Service, Washington, D.C., August. Available online: https://www.ers.usda.gov/data-products/chart-gallery/gallery/chart-detail/?chartId=79141
U.S. Department of Agriculture. 2016e. Whole-Farm Revenue Protection. Risk Management Agency, Washington, D.C., August. Available online: http://www.rma.usda.gov/pubs/rme/wfrpfactsheet.pdf
Webb, L. 2016 (September 9). Personal communication.

