This year marks the twentieth anniversary of the launch of the World Trade Organization (WTO) with its attendant agreements on agriculture (Uruguay Round Agriculture Agreement, URAA), technical barriers to trade (Sanitary and Phytosanitary Agreement, SPS), and much more. The URAA and SPS were particularly significant as they brought agriculture fully under the WTO disciplines for the first time. While much progress on reducing manufacturing tariffs had been made under the General Agreement on Tariffs and Trade (GATT) between 1947 and 1995 when the GATT was absorbed into the WTO, the fact that agriculture was not subject to these trade rules allowed countries to implement a wide-range of highly distortionary trade barriers. Many of these were non-tariff barriers which have particularly destabilizing effects on world markets (Peterson, 2009).
To address the problems with agricultural trade, delegates to the Uruguay Round which lasted from 1986 to 1994, managed to craft an agreement focused on three policy areas that came to be referred to as “pillars:”
1. Market access for imports which required the replacement of non-tariff barriers with equivalent tariffs that were to be lowered by 36% over six years (24% for low-income countries over ten years) and a number of other trade policy constraints.
2. Export subsidies which were to be reduced by 36% in value and 21% in volume over six years.
3. Trade-distorting domestic support as measured by an Aggregate Measure of Support (AMS) which was to be reduced by 20% over six years. Policies that are not thought to have an impact on trade are placed in a “green” box and not counted in the AMS. Likewise policies that might be trade-distorting but are complemented by restrictions on output or input use to offset the distortionary effects are also exempt (“blue” box). Policies placed in the “amber” box are counted in the AMS and are subject to reduction (WTO, 2015).
Initial expectations for the URAA were relatively modest. Most analysts thought there would be only limited impacts on actual trade flows but noted that it was an important accomplishment to finally bring agriculture fully into the multilateral trading system (Diakosavvas, 2004; OECD, 2001). Beyond the URAA, the SPS allowed resolution of some long-standing frictions related to manufacturing processes and common practices in animal agriculture (Hobbes, 2014).
World agricultural trade as measured by the real value of exports increased about 150% between 1995 and 2011 (author’s calculations based on data from FAOSTAT, 2015, deflated with the World Bank Manufacturers Unit Value index). Not all of this increase, of course, can be attributed to the effects of the URAA as many other phenomena that occurred over this time period, such as income and population growth, for example, also affected the evolution of world agricultural trade. To sort out the different influences on agricultural trade, economists rely on statistical models. A few years after the URAA was adopted, there were a few efforts to use such models to conduct ex post evaluations of the impact of the agreement. For example, a session at the annual meetings of the Agricultural and Applied Economics Association formerly known as the American Agricultural Economics Association (AAEA) in 1999 brought together speakers who examined evidence on the effects of the agreements (Anderson, 2000; Sumner and Lee 2000; Thompson, Herrmann, and Gohout, 2000; Glauber, 2000; and Martin, 2000). The authors of these studies found that the URAA had begun to have some limited positive impacts on agricultural trade but noted that many of the provisions of the agreement had not been fully implemented and called for continued efforts to further reform agricultural policies. Daikosavvas (2004) and OECD (2001) also found that the early effects of the URAA among the members of the Organization for Economic Cooperation and Development (OECD) were quite limited. Note that in 2011, the OECD accounted for about 62% of world agricultural exports (FAOSTAT, 2015).
The original agricultural agreement included an article specifying that new negotiations on agriculture would begin five years after its implementation. The new talks initiated in 2000 were eventually folded into the Doha Development Round (DDR)—also known as the Doha Development Agenda, DDA—which was launched in 2001 to address a wide range of trade issues. Most analysts seem to have shifted their attention at this time from ex post evaluations of the URAA to ex ante assessments of proposals being raised in the context of the DDR (McCalla and Nash, 2007). More recent ex post evaluations of the URAA include articles by Grant and Boys (2012) and Ghazalian and Cardwell (2010). Grant and Boys (2012) find that the effect of membership in the WTO on both agricultural and non-agricultural trade flows is substantial with the impact on agricultural trade actually surpassing that for non-agricultural goods. Ghazalian and Cardwell (2010) examined the effect of the URAA on international trade of meat products finding that its impact has been limited.
An alternative to assessing the effects of the URAA through analysis of changes in export and import values is to examine changes in the types of policies implemented by WTO members. The URAA targets particular policies—such as, import tariffs— that are expected to influence trade so an important indicator of how well the agreement is working is whether it has actually resulted in changes in the policy instruments that are likely to have the greatest negative impact on trade. Recent studies of this nature have been carried out by the OECD (2013), Swinnen, Olper, and Vandermoortele (2012), Daugbjerg and Swinbank (2009), Josling and Mittenzwei (2013), Jones (2010), and Anderson (2010). In general, these authors find that the URAA has led to substantial changes in the types of agricultural policies practiced by members of the WTO. To reach these conclusions, many of the studies use data on agricultural policy collected by the OECD. In light of the current national policy discussions on trade agreements, it is useful to further examine the effectiveness of this earlier agricultural trade agreement.
Since 1986, the OECD has collected and compiled data on agricultural policies in OECD countries. More recently, this database has been expanded to include several emerging economies as well as Chile, Mexico, and Israel, countries that have only become members of the OECD more recently. Information on government expenditures and trade-related costs is arranged into three broad categories, the producer support estimate (PSE), the general services support estimate (GSSE), and the consumer support estimate (CSE). The PSE, GSSE and part of the CSE are added together to determine a total support estimate (TSE; OECD, 2010). The PSE is the best indicator of direct support to agricultural producers in the OECD database and data on this measure will serve as the basis for the following discussion. OECD analysts use information on national agricultural policies to classify producer support into seven categories:
1. Support based on commodity output including both transfers arising from trade barriers (referred to as “market price support”) and government payments tied to output.
2. Government payments based on input use.
3. Government payments based on current area planted, animal numbers, receipts or income (A/An/R/I) with production required.
4. Government payments based on non-current A/An/R/I with production required.
5. Government payments based on non-current A/An/R/I with production not required.
6. Government payments based on non-commodity criteria (for example, environmental protection).
7. Miscellaneous payments (OECD, 2013).
These policy instruments have different impacts on agricultural trade. Market price support (MPS), for example, is a measure of the monetary benefit to producers of trade barriers which are widely thought to cause the greatest distortions in world markets (Tokarick, 2005; Croser and Anderson, 2010; Martini, 2011; Anderson, Rausser, and Swinnen, 2013). Payments based on non-current attributes (A/An/R/I) with no requirement for production and those based on non-commodity criteria such as environmental safeguards are thought to be fully “decoupled” from production decisions making them less likely to create distortions in world agricultural trade. Decoupled payments are classified as green box policies at the WTO. The other types of payments noted above are generally thought to influence producer decisions about how much to produce, thereby leading to trade distortions to one degree or another (OECD, 2010). In terms of the three pillars of the URAA, import barriers (market access) and export subsidies are measured by the MPS estimates. Government payments fall under the domestic support pillar and are placed in the amber, blue, or green boxes according to the degree to which they are thought to be trade-distorting. The total PSE can be decomposed into the percentages of producer support resulting from the various categories of policy instruments. For example, the U.S. PSE in 2013 was $31.0 billion of which $3.8 billion, or 12.3%, were the result of trade barriers as measured by the MPS.
| Region/ | % PSE | MPS Share | Decouple Share | Other Share | ||||
| Country | 1986* | 2013 | 1986* | 2013 | 1986* | 2013 | 1986* | 2013 |
| OECD | 37.6 | 18.2 | 75.7 | 44.3 | 1.3 | 25.9 | 23 | 29.8 |
| Australia | 12.9 | 1.9 | 75 | 0 | 8 | 25.5 | 17 | 74.5 |
| Canada | 37.4 | 11.6 | 49.6 | 69.6 | 0 | 0 | 50.4 | 30.4 |
| Chile | 11.1 | 10.4 | 95.8 | 2.2 | 0 | 0 | 4.2 | 97.8 |
| EU | 38.6 | 19.8 | 86.6 | 23.2 | 0.5 | 46.1 | 12.9 | 30.7 |
| Iceland | 75.6 | 41.3 | 92.8 | 40 | 0 | 0.2 | 7.2 | 59.8 |
| Israel | 19.1 | 8.1 | 53.2 | 70.4 | 5.5 | 1.4 | 41.3 | 28.2 |
| Japan | 65.1 | 55.6 | 90.2 | 77.8 | 3.2 | 7.4 | 6.6 | 14.6 |
| Korea | 64.5 | 52.5 | 99.5 | 93.2 | 0 | 0 | 0.5 | 6.8 |
| Mexico | 3.6 | 12.3 | 39.9 | 29.2 | 0 | 12.5 | 60.1 | 58.3 |
| New Zealand | 19.7 | 0.5 | 8.8 | 76.8 | 0 | 0 | 91.2 | 23.2 |
| Norway | 69.6 | 52.9 | 48.7 | 35.3 | 0 | 0.3 | 51.3 | 64.4 |
| Switzerland | 75.9 | 49.4 | 82.3 | 29.5 | 0 | 28.1 | 17.7 | 42.4 |
| Turkey | 17.3 | 19.2 | 76.2 | 75.3 | 0 | 0.3 | 23.8 | 24.4 |
| United States | 24.1 | 7.4 | 31.6 | 12.4 | 1.6 | 26 | 66.8 | 61.6 |
Along with measures of the monetary transfers associated with the various producer support policies, the OECD also calculates a number of indicators reflecting the overall levels of support. The easiest to understand is probably the percentage PSE which is calculated by dividing the PSE by a measure of farm income, thereby showing the proportion of farm income that is the result of government policy interventions. Farm income is equal to the value of total production at the farm gate plus government payments to farmers. The percentage PSE for the United States was 7.4% in 2013 suggesting that U.S. farm policies including both government payments and consumer transfers through higher prices brought about by trade barriers accounted for 7.4% of total farm income. The country with the highest percentage PSE in 2013 was Japan where the transfers due to government intervention amounted to about 56% of farm income (Table 1). It should be noted that this brief explanation of the way in which the OECD producer support estimates are calculated and reported leaves out a great many important details. For the purposes of this article, however, this simplified account should provide enough background for discussing the changes in farm support that have taken place in the aftermath of the adoption of the URAA.
The level of producer support as measured by the percentage PSE for the OECD as a whole has declined from 37.6% in 1986 (31.2% in 1995) to 18.2% in 2013 (Table 1). There have been dramatic declines in producer support in Australia and New Zealand while the changes in many other countries have been much more modest. The fall in the percentage PSE is not due entirely to policy changes induced by the URAA. The need for producer support declines as world prices rise as they did after 2007. In the United States, for example, loan deficiency payments for corn, classified by the OECD as payments based on output, reached more than $4 billion in 2005 but have been non-existent since then due to the dramatic increase in corn prices and other policy changes (OECD, 2015). Nevertheless, the URAA has clearly had some impact on the overall decline in the levels of producer support. Daugbjerg and Swinbank (2009), for example, argue that the URAA has had a significant influence on the way agricultural policy has evolved in the EU where there have been substantial changes in both the types of producer support provided under the EU’s Common Agricultural Policy (CAP) and the level of that support.
Note: The percentages for "other support"
are computed as a residual (% other
payments = 100 - MPS share - decoupled
share).
Source: OECD, 2015
Note: The percentages for "other support"
are computed as a residual (% other
payments = 100 - MPS share - decoupled
share).
Source: OECD, 2015

Note: The percentages for "other support"
are computed as a residual (% other
payments = 100 - MPS share - decoupled
share).
Source: OECD, 2015
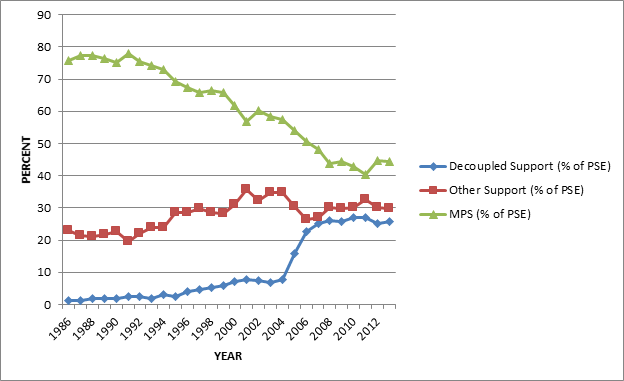
The OECD tracks the changing composition of producer support in its annual reports and many analysts have used the OECD database to assess the impact of the URAA and other agreements on agricultural policy composition (Swinnen, Olper, and Vandemoortele, 2012). In their analyses, these authors tend to group MPS and the more trade-distorting government interventions—payments based on output—into a single category which they show to be declining as a percentage of the total PSE. Because trade barriers are the primary target of the WTO, it is of interest to track MPS separately. In Table 1 and the charts that follow, producer support policies are grouped in three categories: MPS (transfers to producers through import barriers and export subsidies), decoupled payments (payments made without requiring production and payments based on non-commodity criteria), and other payments (the remaining policy categories). The percentages of the total PSE accounted for by each of these three categories are shown in Table 1 and Figures 1-3. Figure 1 displays the evolution of the three components of producer support for the OECD as a whole over the period 1986 to 2013. From 1986 to 1995, market price support accounted for more than 70% of the OECD PSE but in the years following the implementation of the URAA, the proportion of producer support based on trade barriers declined steadily to 40-45% in recent years. This is exactly what would be expected as a result of compliance with the provisions set out in the URAA.
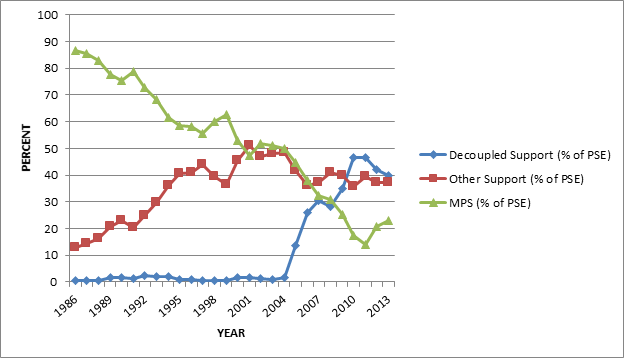
Decoupled payments were almost non-existent until about 2005 after which they have made up an increasing percentage of the OECD PSE. This change in combination with the declining proportion of producer support through trade barriers represents a significant shift from the most to the least trade-distorting agricultural policies. The evolution of the composition of agricultural policies in the EU and the United States is shown in Figures 2 and 3. The most dramatic changes have occurred in the EU (Figure 2) where MPS as a percentage of the total PSE has fallen from 87% at the beginning of the period covered to about 23% in 2013. Much of this decline was related to policy reforms undertaken to comply with the provisions of the URAA. In 2003, the EU implemented a new form of producer support known as the Single Farm Payment (SFP), which is fully decoupled and the proportion of producer support that is decoupled has risen from virtually nothing to almost half the value of the PSE. While Switzerland maintains a higher level of overall support than most OECD members, it has followed the EU’s pattern of reducing the proportion of support from trade barriers while expanding decoupled support (Table 1).
In the United States (Figure 3), MPS—made up primarily of sugar and dairy import barriers and export subsidies—has generally accounted for a lower proportion of the PSE than in many other OECD countries. That percentage has also declined from a high of 54% in 1989 to about 12% in 2013, in part because the use of export subsidies in the United States has declined significantly. Decoupled payments increased with the 1996 Farm Bill and remained fairly steady at about 30% of producer support until 2013. The importance of decoupled payments in U.S. producer support will decline with the elimination of direct payments in the 2014 Farm Bill. In 2013, direct payments, at $4.4 billion, represented 54% of total decoupled payments and 14% of the U.S. PSE. Smith (2014) argues that the new programs introduced in the 2014 Farm Bill to replace the direct payments are likely to be classed as amber box policies suggesting that the new farm policies in the United States may actually be more trade-distorting than has been the case in recent years. Carter (2014) provides a careful assessment of the likely impacts of the 2014 Farm Bill reaching a similar conclusion that the new U.S. policies run counter to aspirations for more liberal agricultural trade. The bulk of U.S. producer support has been provided by non-decoupled payments and that appears likely to continue under the new agricultural legislation.
While members of the OECD account for a large share of world agricultural trade, there are many other countries with interests in the WTO rules related to agriculture. The DDR has been ongoing for some 14 years with little progress to report. In December of 2013, the adoption of the Bali Trade Facilitation Agreement was seen as a potential breakthrough in the talks. In July of 2014, however, India blocked the agreement because of concerns about food security (Ayres, 2014). Historically, many developing countries taxed their agricultural sectors in an effort to keep food prices low for urban consumers (Peterson, 2009). As per capita incomes, urbanization and industrial manufacturing have taken off in some of these countries agricultural policies have begun to shift from consumer to producer support. Emerging economies such as India and China appear to be somewhat wary of agricultural trade liberalization as evidenced by the 2008 collapse of the Doha talks brought about by their disagreement with the United States on the definition of import surges that would trigger agricultural safeguards (The Economist, 2008). Many developing countries are exempt from some of the URAA requirements because they are eligible for “special and differential treatment” under WTO rules. Anderson (2010) argues that the WTO has not been very effective in counteracting rising agricultural protectionism particularly in developing countries.
The OECD collects data on agricultural policies in seven emerging economies: Brazil, China, Indonesia, Kazakhstan, Russia, South Africa, and Ukraine (OECD, 2015). Some of these countries seem to have begun to follow the pattern of many high-income countries in subsidizing their farmers. The level of producer support in China, Kazakhstan, Indonesia, and Russia (percentage PSE equal to 17%, 15%, 21%, and 14%, respectively) is similar to that of Canada, the EU, and Turkey (OECD, 2015). In addition, China is the only one of these emerging economies to provide some support through decoupled programs while most of the producer support in all seven countries comes from trade-distorting trade barriers and payments based on output. Brazil, South Africa, and Ukraine still have low levels of support with percentage PSEs ranging from 1% to 5% (OECD, 2015). For other developing countries, the structural adjustment programs of the 1980s and 1990s led to some modification of the cheap food policies that had been prominent in earlier years as well as some trade liberalization (Peterson, 2009). Most analysts, however, would still argue that there is much work left to be done on opening markets in both emerging and low-income economies (Anderson, 2010; Brink, Orden, and Datz, 2012).
The URAA appears to have been fairly successful in moving producer support policies in the OECD countries away from the trade barriers that create the greatest market distortions while encouraging greater reliance on decoupled policies that have much milder effects on trade. Much of the change in the aggregate OECD support composition is due to policy reforms in the EU, however. In addition, the new U.S. Farm Bill suggests that the United States, long a champion of agricultural trade liberalization, can no longer be counted on to play a leading role in efforts to liberalize global agricultural markets. In addition, it is noteworthy that a significant proportion of producer support comes from decoupled payments in only five of the OECD members. Decoupled support is of some importance only in Australia, the EU, Mexico, Switzerland, and the United States where it is set to diminish. This suggests that efforts to decouple producer support from production decisions have still not been widely embraced.
Furthermore, the prospects for continued progress in reducing the trade-distorting effects of agricultural policies are not promising. Multilateral trade negotiations have become increasingly difficult as the number of countries belonging to the WTO has increased. Agriculture has always been a particularly sensitive sector in trade negotiations and has proved to be a significant stumbling block in the current WTO trade talks. The difficulty of achieving consensus among the governments of 160 countries has added impetus to efforts to craft preferential and regional trade agreements. The WTO lists 406 regional agreements currently in effect (WTO, 2015b) and negotiations are underway to create two significant regional trading blocks. The Trans-Pacific Partnership (TPP), involving 12 countries on the Pacific Rim, and the Trans-Atlantic Trade and Investment Partnership (T-TIP) between the United States and the EU, are ambitious efforts to establish large regional agreements. Burfisher et al., (2014) find that tariff reductions under the TPP would lead to a small increase in regional agricultural trade of about 6% in 2025, the date when the authors assume the agreement will be fully implemented. According to the Office of the U.S. Trade Representative (2015), elimination of tariffs between the EU and the United States could have a significant impact on high-value food trade. Both of these agreements are politically controversial. The Hatch-Wyden-Ryan bill, which will provide the Obama administration with trade promotion authority (TPA), is currently before both the House and the Senate for consideration. TPA allows the executive branch to negotiate trade agreements that are submitted to Congress for ratification without amendments. Many believe that without TPA, the United States would be unable to make a credible commitment to the terms of any agreement reached.
Economists are somewhat divided on the question of whether or not regional trade agreements can serve as stepping stones toward broader trade liberalization. Because regional trade agreements are discriminatory—parties to the agreement apply different trade rules among themselves as compared to the treatment of countries not included in the agreement—they may be less effective in overall trade liberalization than non-discriminatory, multilateral agreements. And, as evidenced by the opposition to TPP and T-TIP, they may be no easier to negotiate than WTO agreements. Despite the problems inherent in completing complex international agreements on agricultural trade, it is important to recognize that global food and agricultural markets are significantly less distorted today than they were when the Uruguay Round was launched.
Anderson, K. 2000. “What Has the GATT/WTO Agriculture Agreement Actually Done? Empirical Assessment of the Uruguay Round and Related Policy Changes for Commodity Markets?” Proceedings of the annual meetings of the AAEA, American Journal of Agricultural Economics. August, 2000:709-30.
Anderson, K. 2010. “Can the WTO Reduce Agricultural Trade Distortions?” Journal of International Trade and Economic Development, Vol. 19, No. 1: 109-34.
Anderson, K., G. Rausser, and J. Swinnen. 2013. “Political Economy of Public Policies: Insights from Distortions to Agricultural and Food Markets.” Policy Research Working Paper 6433, Washington, D.C.: The World Bank.
Ayres, A. 2014. “India: Tough Talk and the Bali Trade Facilitation Agreement.” Forbes Asia, July 30. Available online: http://www.forbes.com/sites/alyssaayres/2014/07/30/india-tough-talk-and-the-bali-trade-faco;otation-agreement-2/.
Brink, L., D. Orden and G. Datz. 2012. “BRIC Agricultural Policies through a WTO Lens,” Journal of Agricultural Economics, 64 (1): 197-216.
Burfisher, M. E., J. Dyck, B. Meade, L. Mitchell, J. Wainio, S. Zahnhiser, S. Arita, and J. Beckman. 2014. “Agriculture in the Trans-Pacific Partnership.” Economic Research Service Report No. 176, USDA, Washington, DC.
Carter, C. A. 2014. “Some Trade Implications of the 2014 Agricultural Act.” Choices, Third Quarter, 29 (3).
Croser, J. and K. Anderson. 2010. “Changing Contributions of Different Agricultural Policy Instruments to Global Reductions in Trade and Welfare.” Policy Research Paper 5345, Washington, D.C.: The World Bank.
Daugbjerg, C. and A. Swinbank. 2009. “Ideational Change in the WTO and its Impacts on EU Agricultural Policy Institutions and the CAP.” European Integration, 31 (3): 311-327.
Diakosavvas, D. 2003. “The Uruguay Round Agreement on Agriculture in Practice: How Open are the OECD Markets?” in Agriculture, Trade, and the WTO, edited by Merlinda D. Ingco, Washington D.C.: The World Bank.
The Economist. 2008. “The Doha Round...and round...and round.” July 31. Available online: http://www.economist.com/node/11848592/print.
Food and Agricultural Organization, Statistics Division (FAOSTAT). (2015). “Trade/ Crops and Livestock Products.” Food and Agriculture Organization. Available online: http://faostat3.fao.org/faostat-gateway/go/to/download/T/*/E.
Ghazalian, P. L. and R. Cardwell. 2010. “Did the Uruguay Round Agreement on Agriculture Affect Trade Flows? An Empirical Investigation for Meat Commodities.” International Advances in Economic Research, 16: 331-344.
Glauber, J. W. 2000. “If a Tree Falls in the Forest: The Effects of Liberalization if Tariffs are Nonbinding– Discussion.” Proceedings of annual meetings of the AAEA, American Journal of Agricultural Economics. August, 2000:727-28.
Grant, J. H. and K. A. Boys. 2012. “Agricultural Trade and the GATT/WTO: Does Membership Make a Difference?” American Journal of Agricultural Economics. 94 (1): 1-24.
Hobbes, J. E. 2014. “Canada, US-EU Beef Hormone Dispute.” Encyclopedia of Food and Agricultural Ethics, New York: Springer Reference, Springer, November 14.
Jones, D. 2010. “Analyzing the Composition of Producer Support: New Tools and Methods.” OECD Food, Agriculture and Fisheries Papers, No. 32, Paris: Organization for Economic Cooperation and Development.
Josling, T. and K. Mittenzwei. 2013. “Transparency and Timeliness: The Monitoring of Agricultural Policies in the WTO using OECD Data.” World Trade Review, 12 (3): 533-47.
Martin, W. 2000. “What Has the GATT/WTO Agricultural Agreement Actually Done?: Discussion.” Proceedings of the annual meetings of the AAEA, American Journal of Agricultural Economics. August, 2000:729-30.
Martini, R. 2011. “Long Term Trends in Agricultural Policy Impacts.” OECD Food, Agriculture and Fisheries Papers, No. 45, Paris: Organization for Economic Cooperation and Development.
McCalla, A. F. and J. Nash (editors). 2007. Reforming Agricultural Trade for Developing Countries, Volume II: Quantifying the Impact of Multilateral Trade Reform. Washington, D.C.: The World Bank.
Organisation for Economic Co-operation and Development (OECD). 2001. The Uruguay Agreement on Agriculture: An Evaluation of its Implementation in OECD Countries. Paris: Organization for Economic Cooperation and Development, January 1.
Organisation for Economic Co-operation and Development (OECD). 2010. OECD’s Producer Support Estimate and Related Indicators of Agricultural Support: Concepts, Calculations, Interpretation and Use. Paris: Organization for Economic Cooperation and Development.
Organisation for Economic Co-operation and Development (OECD). 2013. Agricultural Policy Monitoring and Evaluation 2013. Paris: Organization for Economic Cooperation and Development.
Organisation for Economic Co-operation and Development (OECD). 2015. Producer and Consumer Support Estimates Database. Paris: Organization for Economic Cooperation and Development. Available online: http://www.oecd.org/agriculture/agricultural-policies/producerandconsumersupportestimatesdatabase.htm
Office of the U.S. Trade Representative. 2015. “T-TIP Issue-by-Issue Information Center: Trade in Goods.” Available online: https://ustr.gov/trade-agreements/free-trade-agreements/transatlantic-trade-and-investment-partnership-t-tip/t-tip-0 .
Peterson, E. W. F. 2009. A Billion Dollars a Day: The Economics and Politics of Agricultural Subsidies. Malden, MA: John-Wiley and Sons.
Smith, V. H. 2014. “The 2014 Agricultural Act: U.S. Farm Policy in the Context of the 1994 Marrakesh Agreement and the Doha Round.” ICTSD Issue Paper No. 52, Geneva: International Center for Trade and Sustainable Development.
Sumner, D. A. and H. Lee. 2000. “Assessing the Effects of the WTO Agreemnent on Rice Markets: What Can We Learn from the Past Five Years?” Proceedings of the annual meetings of the AAEA, American Journal of Agricultural Economics. August, 2000: 709-17.
Swinnen, J., A. Olper and T. Vandemoortele 2012. “Impact of the WTO on Agricultural and Food Policies.” The World Economy, 35 (9): 1089-1101.
Tokarick, S. 2005. “Who Bears the Cost of Agricultural Support in OECD Countries?” The World Economy, 28 (4): 573-93.
Thompson, S. R., R. Herrmann, and W. Gohout. 2000. “Agricultural Market Liberalization and Instability of Domestic Agricultural Markets: The Case of the CAP.” Proceedings of annual meetings of the AAEA, American Journal of Agricultural Economics. August, 2000: 718-26.
World Trade Organization (WTO). 2015a. “Summary of the Final Act of the Uruguay Round.” Available online: http://www.wto.org/english/docs_e/legal_e/ursum_e.htm#aAgreement.
World Trade Organization (WTO). 2015b. “Some Figures on Regional Trade Agreements Notified to the GATT/WTO and in Force.” World Trade Organization Available online: http://rtais.wto.org/UI/publicsummarytable.aspx.

