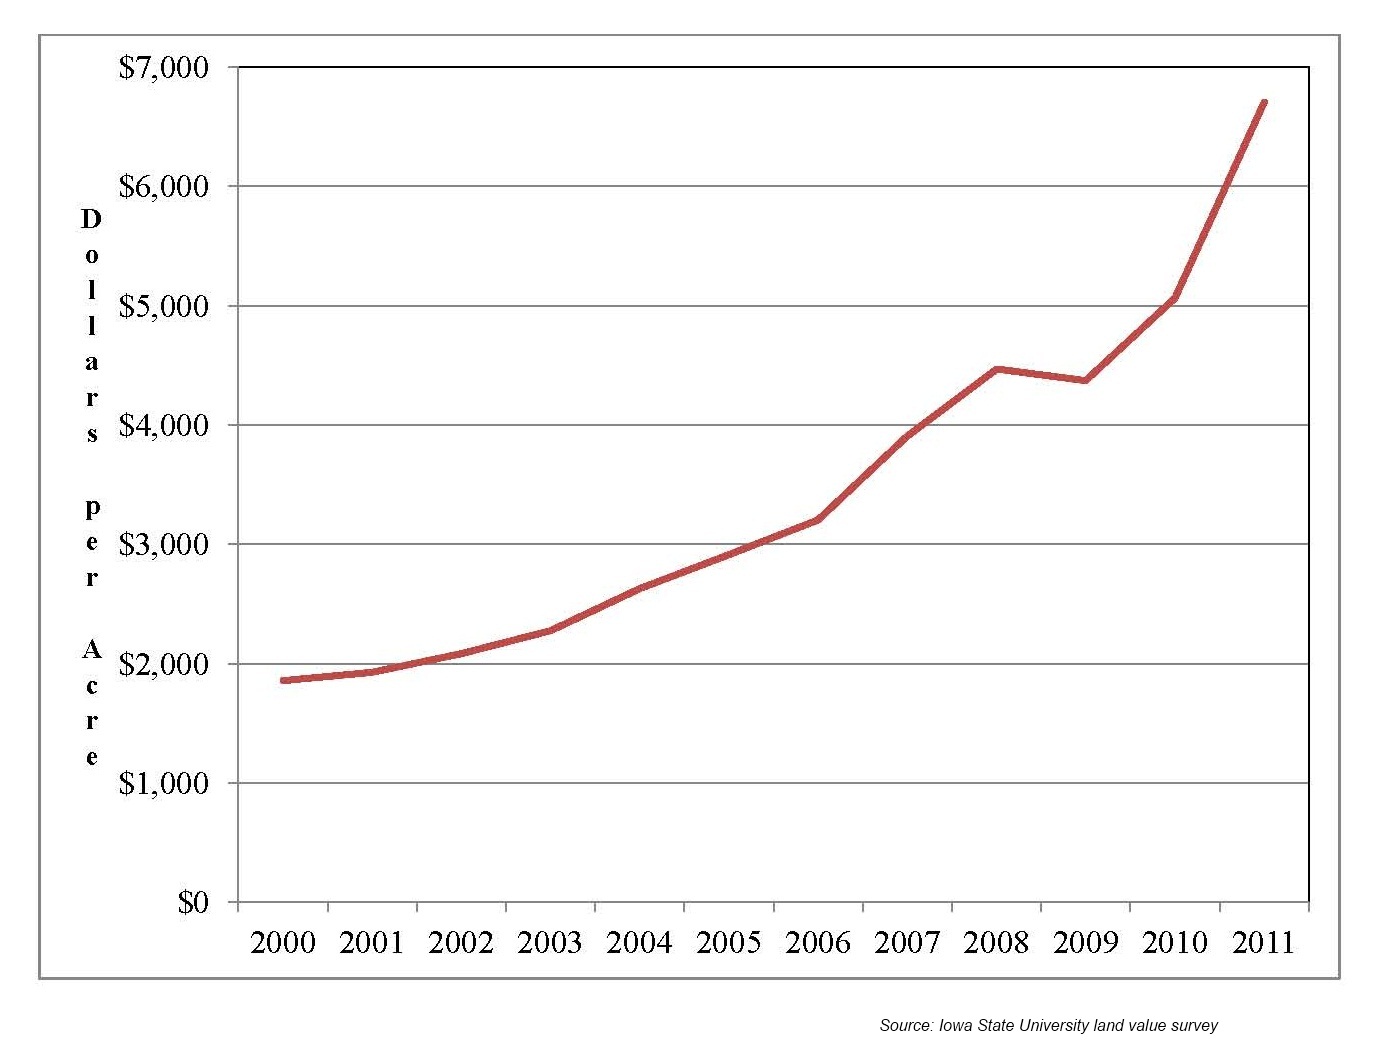
Land is the most valuable asset in United States agriculture (Kay, Edwards, and Duffy, 2012). It is used in the production of both livestock and plants. Land is a unique asset because it is immobile and finite in supply. The value of land is influenced directly by the returns in agricultural production because it is often the residual claimant of excess returns. However, estimating the value of land is not easy. Land has numerous variable characteristics even in very small parcels. Survey values of land in Iowa have more than doubled since 2006, increasing over 32% from 2010 to 2011 (Iowa State University Extension, 2012). However, it was not known if these recent survey results are seen in actual sales data.
Comparing land sale values to expert opinion survey responses may help determine the extent to which the two methods vary. Opinion surveys are cheaper than purchasing or gathering sales data, but savings may come at the cost of less reliable results. Comparing survey values and sale prices may help determine whether survey values overstate, understate, or approximate actual sales values.
The dataset used to compare to expert opinion land values is composed of land sales data from 20 randomly chosen Iowa counties for the years 1990 and 2005 through 2011. This data was purchased from a company specializing in land sales data: Land Sales, Incorporated, in Fort Dodge, Iowa. The data is from open records of sales in each county courthouse. The year 1990 was chosen because it was the earliest year data was available. 2005 was chosen because it was the last year in recent times before values increased sharply (Figure 1).
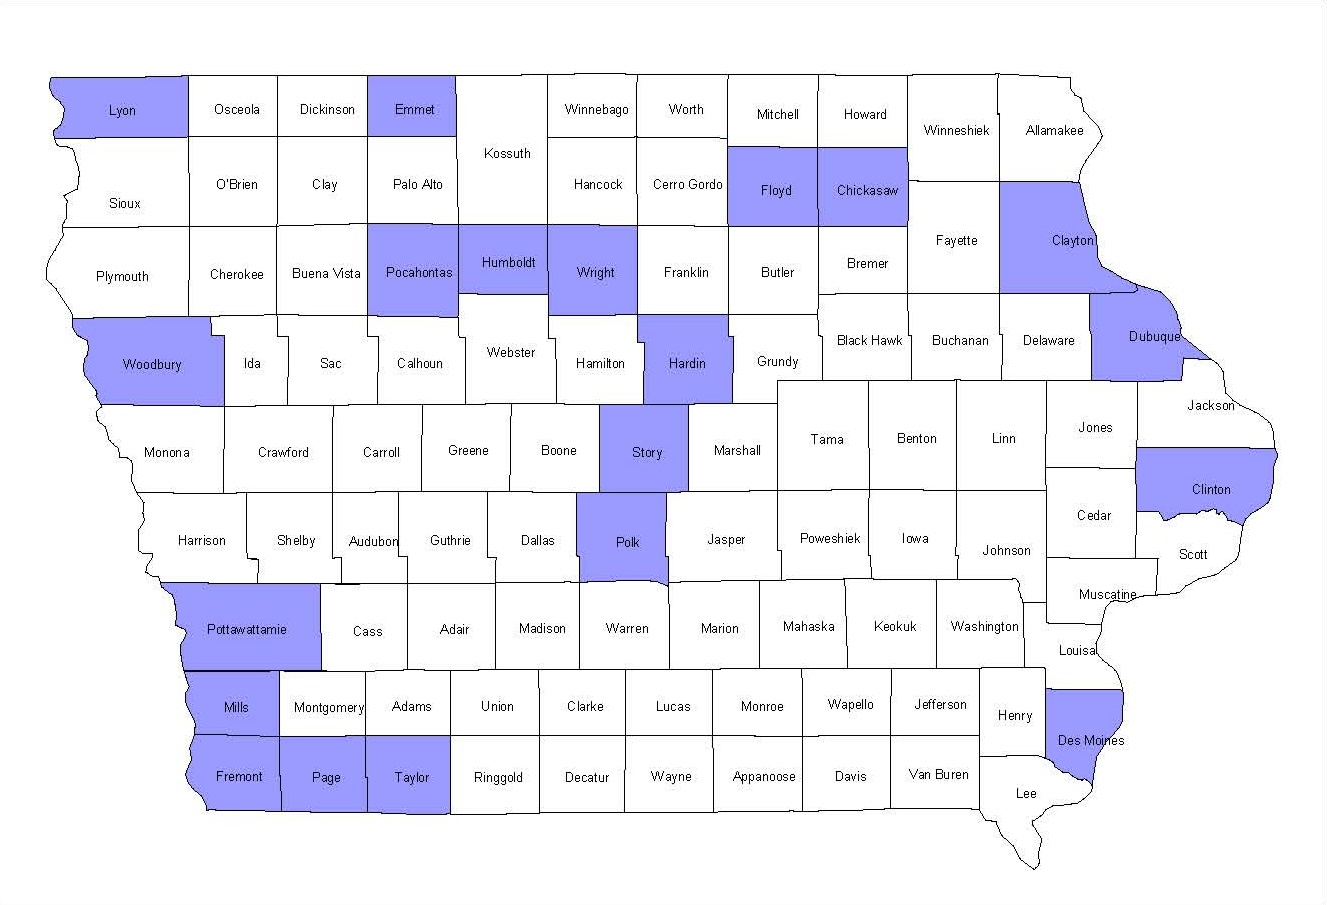
The randomly selected counties were: Chickasaw, Clayton, Clinton, Des Moines, Dubuque, Emmet, Floyd, Fremont, Hardin, Humboldt, Lyon, Mills, Page, Pocahontas, Polk, Pottawattamie, Story, Taylor, Woodbury, and Wright (Figure 2). Some Iowa areas are missing from the dataset, particularly the southeast counties, but this study is by county and not regional.
Only agricultural land was included in this analysis. Observations were removed that were sold as development, deemed as having “high building value,” contained a forest reserve, or were sold to the government or a non-profit organization. In addition, parcels with less than 20 acres or a Corn Suitability Rating (CSR) (Hofstrand, 2010) less than 20 were removed. These parcels are not likely to be used in production agriculture. Finally, those properties with a sales price per acre that were statistically well outside (three standard deviations) average were dropped. These values could be influenced by factors outside the scope of the data reported.
Most land values reported are obtained from opinion surveys of professionals such as the Federal Reserve, realtors, U.S. Department of Agriculture (USDA) officials, or others. Institutions that report land value numbers include the Federal Reserve Bank of Chicago, the University of Minnesota, the University of Nebraska, and Purdue University. These values are often used as part of the barometer of the agricultural economy. If farmers are doing well, land values will rise along with prices of other inputs to agriculture. Also, farm bills, ethanol mandates, and many other things out of the direct influence of farmers can impact land prices. Some of these influences are partly behind the increases shown in Figure 1.
A frequent question is, “How do opinion survey values compare to actual sale prices?” If certain rules are followed, accuracy of survey results when compared to the true value can be quite high (Dillman, 2000). Issues regarding errors of all types have been studied for years, and considerable literature exists on designing surveys to achieve greater accuracy.
However, the foremost issue is the definition of value. David Ricardo (Ricardo, 1819) expands on ideas in Adam Smith’s An Inquiry into the Nature and Causes of the Wealth of Nations. Ricardo states that there are two types of value: “value in use” and “value in exchange.” Value in use is defined as the gain achieved from use of the good. Value in exchange is the amount people will trade or pay for the good. Ricardo says, “Possessing utility, commodities derive their exchangeable value from two sources: from their scarcity, and from the quantity of labor required to obtain them.” Land obtains the majority of its exchangeable value from its scarcity because it is difficult to produce land from labor.
The exchangeable value of land is what people will pay for its possession, which is comparable to sale price. What people will pay can depend on many factors, including their wealth and opportunities for alternative investments. Exchangeable value ignores the value gained from use. People can gain pleasure from ownership that cannot be captured easily by economic theory, but this pleasure should be accounted for in the value in use. For these reasons, surveys of value may not agree with actual sales prices.
A yearly opinion survey is taken of agricultural land values in every county in the state of Iowa (Duffy, 2012). Iowa State University (ISU) conducts a mail survey of those believed to be knowledgeable of land market conditions in their area. The respondents are asked to list:
These values were compared to average sale price values in the selected counties for the corresponding years. This determined if county land value estimates from survey respondents are representative of actual sales prices. State and crop reporting district averages were calculated from the survey responses. These averages were used in estimates combining U.S. Census of Agriculture data and geographical location to produce county average land values (Duffy, 2012).
The dataset described previously was used to calculate an average price per acre for each county and year. Price per acre adjusted for taxable acres—taking total sale price divided by taxable acres instead of dividing by total acres—were available for every parcel except those in 1990; however, using these did not significantly change results. Therefore, price per acre was used so 1990 could be compared to other years. These average prices were compared to the average county values obtained in the ISU survey. For each county, percent differences between the sales and survey data were calculated. A negative value indicates that the survey average was higher than the sales average; a positive value indicates the sales average was higher than the survey average farmland value.
As seen in Table 1, the survey tends to overstate the value of farmland compared to the sales data. The year 2011 has the highest variation in differences—highest positive minus lowest negative—while 2007 was the year with least variation in differences. Survey values were actually higher than the sales values in all years except 2007.
| 1990 | 2005 | 2006 | 2007 | 2008 | 2009 | 2010 | 2011 | |
|---|---|---|---|---|---|---|---|---|
| Percentage of negative obs. | 80.0% | 80.0% | 75.0% | 25.0% | 85.0% | 75.0% | 85.0% | 100.0% |
| Percentage of positive obs. | 20.0% | 20.0% | 25.0% | 75.0% | 15.0% | 15.0% | 15.0% | 0.0% |
| Overall average | -10.0% | -7.8% | -6.3% | 8.6% | -9.7% | -7.3% | -12.2% | -26.7% |
| Average if positive | 3.8% | 4.8% | 9.8% | 12.3% | 6.6% | 5.2% | 9.0% | -- |
| Max if positive | 6.6% | 9.9% | 24.5% | 33.3% | 10.5% | 12.3% | 16.0% | -- |
| Min if positive | 0.3% | 0.0% | 0.6% | 0.8% | 3.8% | 0.9% | 3.8% | -- |
| Average if negative | -13.4% | -10.9% | -11.6% | -2.3% | -12.6% | -11.4% | -15.9% | -26.7% |
| Max if negative | -3.0% | -1.0% | -2.0% | -0.3% | -2.3% | -0.7% | -1.7% | -0.9% |
| Min if negative | -30.9% | -22.0% | -24.2% | -5.8% | -22.5% | -23.0% | -26.4% | -72.1% |
The top two rows of Table 1 show that the survey conducted by ISU is consistently (approximately 80% of the time) higher than actual sales values, except for the years 2007 and 2011.
Over 80% of parcels sold are in the low-third or middle-third of CSR (Stinn, 2012), which is a measure of productivity of agricultural land in Iowa. The value survey numbers used in Table 1 were an average of all land. Higher quality land is not equally represented in the sales data; this could be why sales values are lower than survey results. Further comparison of sales data is needed to determine if the survey values are closer to sale values by using CSR quality measurements. Also, a distinction in the type of land being valued—row crop, tillable pasture, hay ground, and so on—could lead to survey results more comparable to sales data.
According to statistical theory, the survey answers should be consistently close to the true value. The ISU survey's differences from sales data are not statistically significant, which supports the theory. Because the survey is sent out in November, respondents should have most of the sales information available, and these observations about the market should be built into their opinions on value. By this time, most of the harvest is complete and yields and price information are also known.
The results for 2007 and 2011 illustrate the impact of changing expectations. Land values increased rapidly in 2007. They were increasing at a rate higher than the expectations of the survey respondents. By 2011, however, the expectations were exceeding the actual sales price. This is illustrated by the fact that only 25% of the counties were negative—higher survey than sales values—in 2007. But, in 2011, all of the counties were negative.
The ISU land value survey estimates are generally higher than the actual sales. But, in times of rapidly changing land values, the difference between survey and sales values will fluctuate widely.
For 1990, and 2005 through 2011, average prices per acre were calculated for 20 randomly- selected counties in Iowa. These prices were compared to results of the survey conducted by ISU (Duffy, 2012). Survey results were consistently (80% of the time) higher than sales prices, by an average of 8.9%. However, the sales results were not significantly (statistically) different than the survey averages for any year. There were two unusual years, 2007 and 2011. These were years of rapid change in Iowa land values resulting in expectations that were not reflected in land market prices.
The ISU survey asks for “value,” which has many components. Some of these components are not easily observed, such as pride of ownership, opportunity of expansion, and ability to pass the land on to future generations.
The two types of value, “value in use” and “value in exchange,” are not the same and differ from person to person. Value in use captures the utility from—preferences for—the components mentioned above, but value in exchange is the amount a person would be willing to trade or pay for the land.
Land value surveys provide a good indication of the direction of change and level of value, but they are still an opinion survey that represents who is being surveyed. It is important to consider the survey respondents, the questions asked, the time period covered, and other factors relating to a particular survey. Opinion surveys and sales data are two different things. It is important to remember the distinction and uses when considering the data.
Dillman, D.A. (2000). Mail and Internet Surveys, The Tailored Design Method. 2nd ed., New York, N.Y.: John Wiley & Sons, Inc., 2000.
Duffy, M., Smith, D., Reutzel, J., and Johnson, B. (2008). Farmland Ownership and Tenure in Iowa 2007. Iowa State University Extension. PM 1983.
Duffy, M. (2012). 2011 Iowa Land Value Survey. Iowa State University Extension. FM 1825.
Hammes, B.D. (1984). Hedonic prices for farmland characteristics: An analysis of farm transaction prices for Iowa (Unpublished master’s thesis). Iowa State University, Ames, IA.
Hofstrand, D. (2010). Understanding Iowa Corn Suitability Ratings (CSR). Available online: http://www.extension.iastate.edu/agdm/wholefarm/html/c2-86.html.
Kay, R.D., Edwards, W.M., and Duffy, P.A. (2012). Farm Management. 7th ed. Boston: McGraw Hill.
Ricardo, D. (1819). On the Principles of Political Economy and Taxation. 2nd ed. London: John Murray.
Stinn, M.C. (2012). Farmland price determinants in Iowa (Unpublished master’s thesis). Iowa State University, Ames, IA.

