Many U.S. states employ a use-value formula to assess agricultural lands for property tax purposes (Anderson and England, 2014). This formula is based on an income capitalization approach to appraisal, which assesses the value of agricultural land by dividing the estimated annual net income from agricultural production (or cash rent) by a capitalization rate. South Dakota has used a use-value formula to assess all agriculture property since 2010. To qualify as agriculture property in South Dakota, the principal use of the property must be the raising and harvesting of crops, timber, or fruit trees; the rearing, feeding, and management of farm livestock, poultry, fish, or nursery stock; the production of bees and apiary products; or horticulture for an intended agriculture gross income that is at least 10% of the assessed value or where the parcel exceeds a specified size.
The impetus for agricultural use-value assessments in South Dakota was that the market values of agricultural land deviate from their perceived economic value; further motivation was that the qualified “arm’s length” transactions were too infrequent in local areas to effectively use a sales comparison approach. Agricultural use-value formulas have attracted criticism, however, because of perceived preferential treatment. Specifically, use-value assessments exclude market value due to development potential, speculation of asset appreciation, and other nonagricultural income, which can lead to significant valuation divergences between an income capitalization approach and a sales comparison approach. Most of the use-value formulas used for valuing agricultural land in the United States are similar in that they largely utilize annual USDA National Agricultural Statistics Service (NASS) (2008–2017) production, price, and cash rental data and Natural Resources Conservation Service (NRCS) soil survey data to determine agricultural land assessments.
Recently, state legislatures have debated a number of policy issues regarding agricultural use-value formulas. Senate Bill (SB) 178 was introduced in the 2015 Kansas legislative session to change the net income estimate to cash rental rates in the use-value formula. The proposal also attempted to shorten the number of years required to determine the average rental and capitalization rates used in the formula. In addition, Ohio’s 133rd General Assembly passed SB 36, which would modify the use-value formula used in Ohio by using a capitalization rate based on the average rate of return of farm equity over 25 years plus the interest rate. Both bills were reportedly expected to have sizable impacts on agricultural land assessments and potential tax liability.
In South Dakota, the legislature has revisited the method for highest and best use (HBU) determination, which occurs prior to the application of the use-value formula. HBU is defined as the reasonably probable use of property that results in the highest value. According to the appraisal accreditation institutions, the four criteria that the HBU determination must meet are legal permissibility, physical possibility, financial feasibility, and maximum productivity. When making an HBU determination for a mass universe of properties, the Appraisal Standards Board (2018, p.17) requires that the determination employs common data, a standard method, and that the analysis is conducive to statistical testing. In South Dakota, a director of equalization must first develop a supportable determination of HBU of the agricultural land, which is then used to determine which agricultural use-value formula to use for assessment. Similar to other states, South Dakota has two distinct agricultural use-value formulas for agricultural land—(i) cropland and (ii) noncropland, which includes all types of grasslands, wetlands, and woodlands.
The current policy for determining whether the HBU is cropland or noncropland in South Dakota is largely made using the land capability classification (LCC) from the NRCS soil database (Klingebiel, 1958). Using LCC to determine HBU was the practice for assessments in South Dakota prior to the application of the income capitalization approach and agricultural use-value formula from a sales comparison approach. The LCC is a classification system of all U.S. soils that determines the potential productivity and limitations of each soil. In South Dakota, a cropland HBU determination is largely made for LCC class I–IV soils, and a noncropland HBU is made for class V–VIII soils. Public testimony provided to a South Dakota agricultural land assessment oversight task force suggested that a large amount of agricultural property has been assessed incorrectly as cropland when it is currently being used predominantly as noncropland (Simkins, 2015). Additional public testimony has suggested that the incorrect HBU determinations have led to agricultural land parcel assessments that exceed the economic value of the land.
In 2016, the South Dakota Legislature approved funding for research to provide objective data and greater transparency in determining the HBU for each soil type in the state. The purpose of the study was to examine the state’s current method of determining HBU and how that determination is further used to assess agricultural land for property tax purposes using a use-value formula. A number of alternative policy options have been discussed. We explore and report the impacts of two classes of alternative policies. The first concerns what happens if the HBU criteria were changed to a use-value formula based on current land use, more commonly referred to as actual use (AU). Alternatively, we explore a policy that determines HBU based on an economic model that estimates the probability of a particular use for agricultural land, given various attributes of the property and observed use patterns in the area. The class of policies that uses an economic model to make an agricultural use-value determination is commonly referred to as most probable use (MPU).
In following the guidelines set out by appraisal accreditation institutions, we find that the adoption of either an MPU or an AU method would lead to a sizable change in agricultural land assessments in South Dakota. Further, we find that these assessment changes could lead to significant shifts in tax burden to nonagricultural classes of property. We further discuss the impacts and background of the research below.
In many surrounding states, the policy guidelines for determining which agricultural use-value formulas to use are largely based on a property’s current use and not on the HBU. A valuation based on how the property is currently used is called a value-in-use and is defined as the economic valuation of the property to the individual using the current property. Value-in-use assessments would deviate from appraisal guidelines for supportable HBU determinations when assessing property for its market value or for its agricultural market value using an income approach. This is because the policies generally preclude land previously cropped or currently cropped from being valued as noncropland. Moreover, data analysis is not performed to determine whether noncropland land could be improved to be cropland given sufficient net returns that could justify the necessary capital costs to generate additional returns. Granted, HBU of agricultural land is often the same as current or past use; however, HBU is defined, explicitly, as to not be determined solely by current or previous use. Rather, according to the American Society of Farm Managers and Rural Appraisers (ASFMR) (Justin, 2019, pp. 40–41), “HBU determinations must be based on careful consideration of prevailing market conditions, trends affecting market participation and change, and the existing use of the property.” ASFMR further cautions that “surrounding land uses are not always indicative of optimum use, existing use may not be optimum, and zoning may not be consistent with HBU.”
Wilson (1995) summarized two approaches for HBU determination for appraisals: a traditional—or heuristic—decision approach and a contemporary, theoretical approach. The traditional approach is based on observation, experience, and appraisers’ rule-of-thumb approximations of what use would likely occur if the property were offered up in a market. The contemporary—or theoretical—approach defines the HBU decision making and market appraisal process as solving a linear optimization problem for land use that generates the highest net income given the legal and productivity constraints of the land (e.g., Dotzour et al., 1990). The linear optimization approach, Wilson (1995) contends, was preferred because it allows analytical consistency and formalization of the decision among appraisers given that they use the same function to determine optimization, but the approach was not easy to communicate or apply. Thus, Wilson (1995) argued that the traditional, heuristic determination is preferable because it mimics the process of decision makers when making a decision to purchase a property. Wilson (1995) proposed that future HBU heuristic decisions could be improved by systematically using heuristic decision trees to acquire the analytical consistency, formalization, and objectivity demonstrated with the contemporary, theoretical approach.


The first alternative HBU policy we examine is a model using common data and a consistent method that allows for statistical testing. To develop an economic model to estimate the probability of agricultural use, we use a random forest regression, a machine learning technique that develops an ensemble of decision trees to classify agricultural use. This technique is similar to Wilson’s (1995) conceptualization for making objective heuristic decisions regarding HBU.
Using the random forest regression model, we estimate the probability that a soil map unit in South Dakota would be mostly used as cropland or noncropland given various soil attributes from the NRCS soil database, topography, climate, location, and expected returns of common cropland and noncropland uses. We explored a number of variables to include in the random forest regression model but found that only a handful were consistently important indicators of use patterns over multiple years. The variables we report are the county; the crop productivity index of the soil map unit from the NRCS, the NRCS LCC; the mean slope of the soil map unit; the standard deviation of the slope of the soil map unit; the available water-holding capacity of the soil map unit in the top 25 and 50 centimeters of soil from the NRCS; the total percentage of sand, silt, and clay in the topsoil layer; the ponding frequency according to the NRCS; a crop rating we derive from NRCS representative crop yields; forage value rating we derived from the range production of the NRCS database adjusted for the types of plant species associated with the soil map unit according to the NRCS; a crop revenue rating we derived from the crop rating and prices received for crops in South Dakota according to USDA-NASS; and the year of the analysis. The target variable we try to explain is observed uses of soil map units as cropland or noncropland according to the USDA-NASS Cropland Data Layer (CDL). We develop three models for the western, central, and eastern crop reporting districts. Probability estimates can be different in individual locations depending on the use of a single statewide model versus using the three separate models, but the overall conclusion to switch to an MPU method is largely consistent across the state. Further, the results are generally consistent locally and statewide when we test different variables to include or substitute into the model.
The second policy we examine is an AU policy. To estimate the AU of a soil map unit, we use the percentage of the soil map unit was had been used as cropland since 2010 according to the USDA-NASS CDL. We use multiple years of the CDL to make an estimate because the USDA-NASS CDL has been shown to be occasionally inaccurate for certain crops and cropping systems. In addition, known land use changes during the period reflect market dynamics that we want to capture in making an HBU determination.
To use the CDLs, we first mask all development areas and areas of water. We then reclassify the remaining pixels of the CDL into two categories: cropland and noncropland. The cropland category includes all crops and double crops, or band values 1–61 and 196–254. The noncropland category includes all types of pastureland, wetlands, woodlands, shrub lands, and grasslands, or band values 63–80 and 131–195. We sum the number of pixels that were cropland on the soil map unit and divide by the sum of cropland and noncropland pixels on the same soil map unit for each year. We then take the average of the ratios of cropland pixels for each soil map unit across all the years to measure the percentage of AU when examining an AU policy.
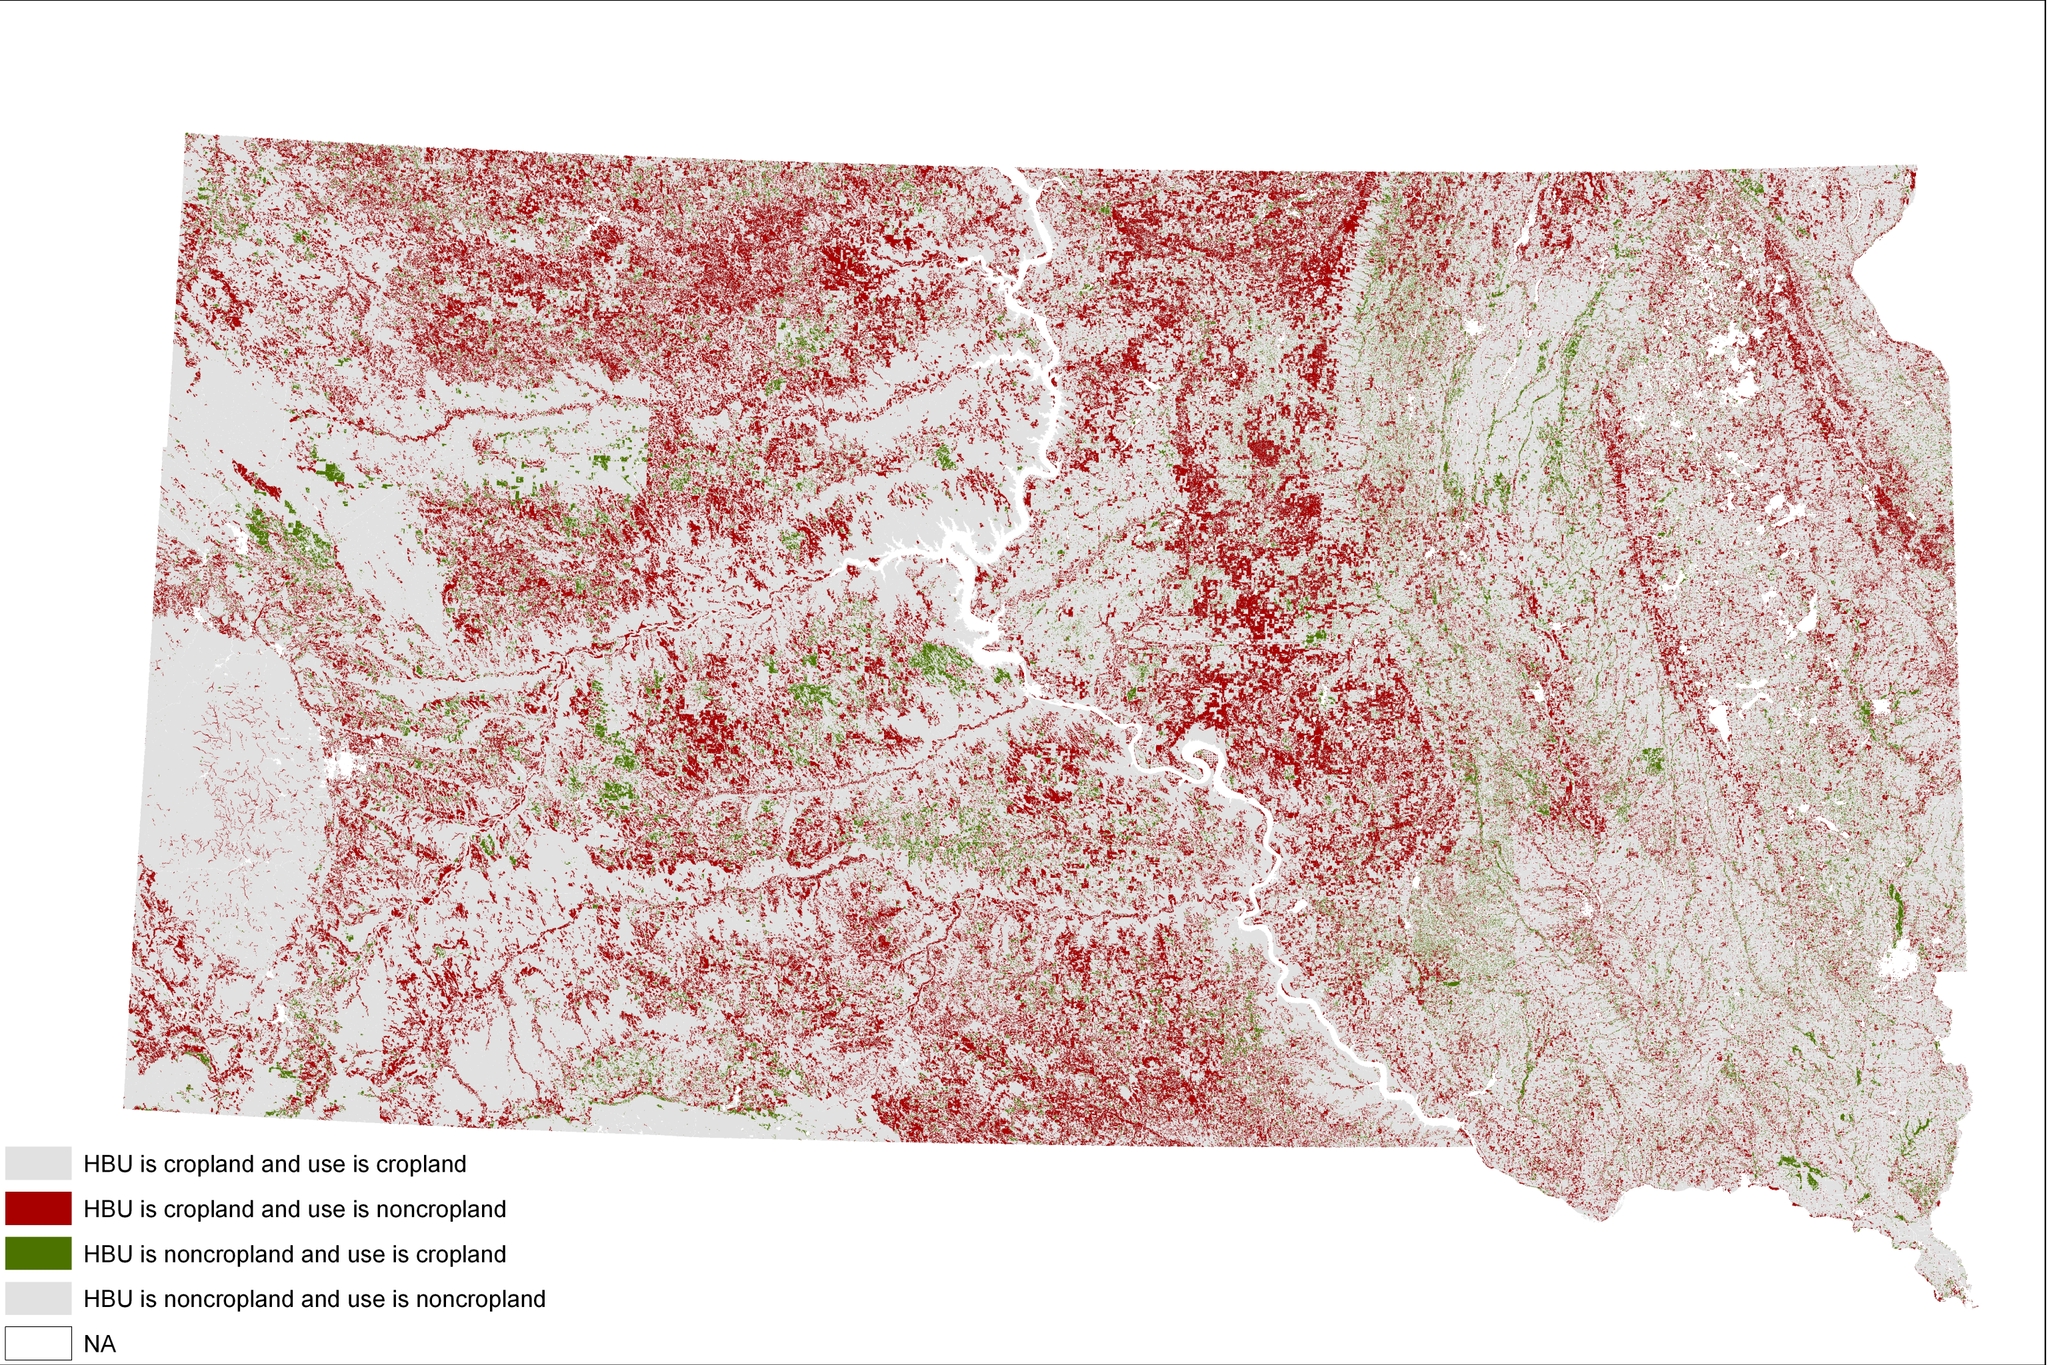
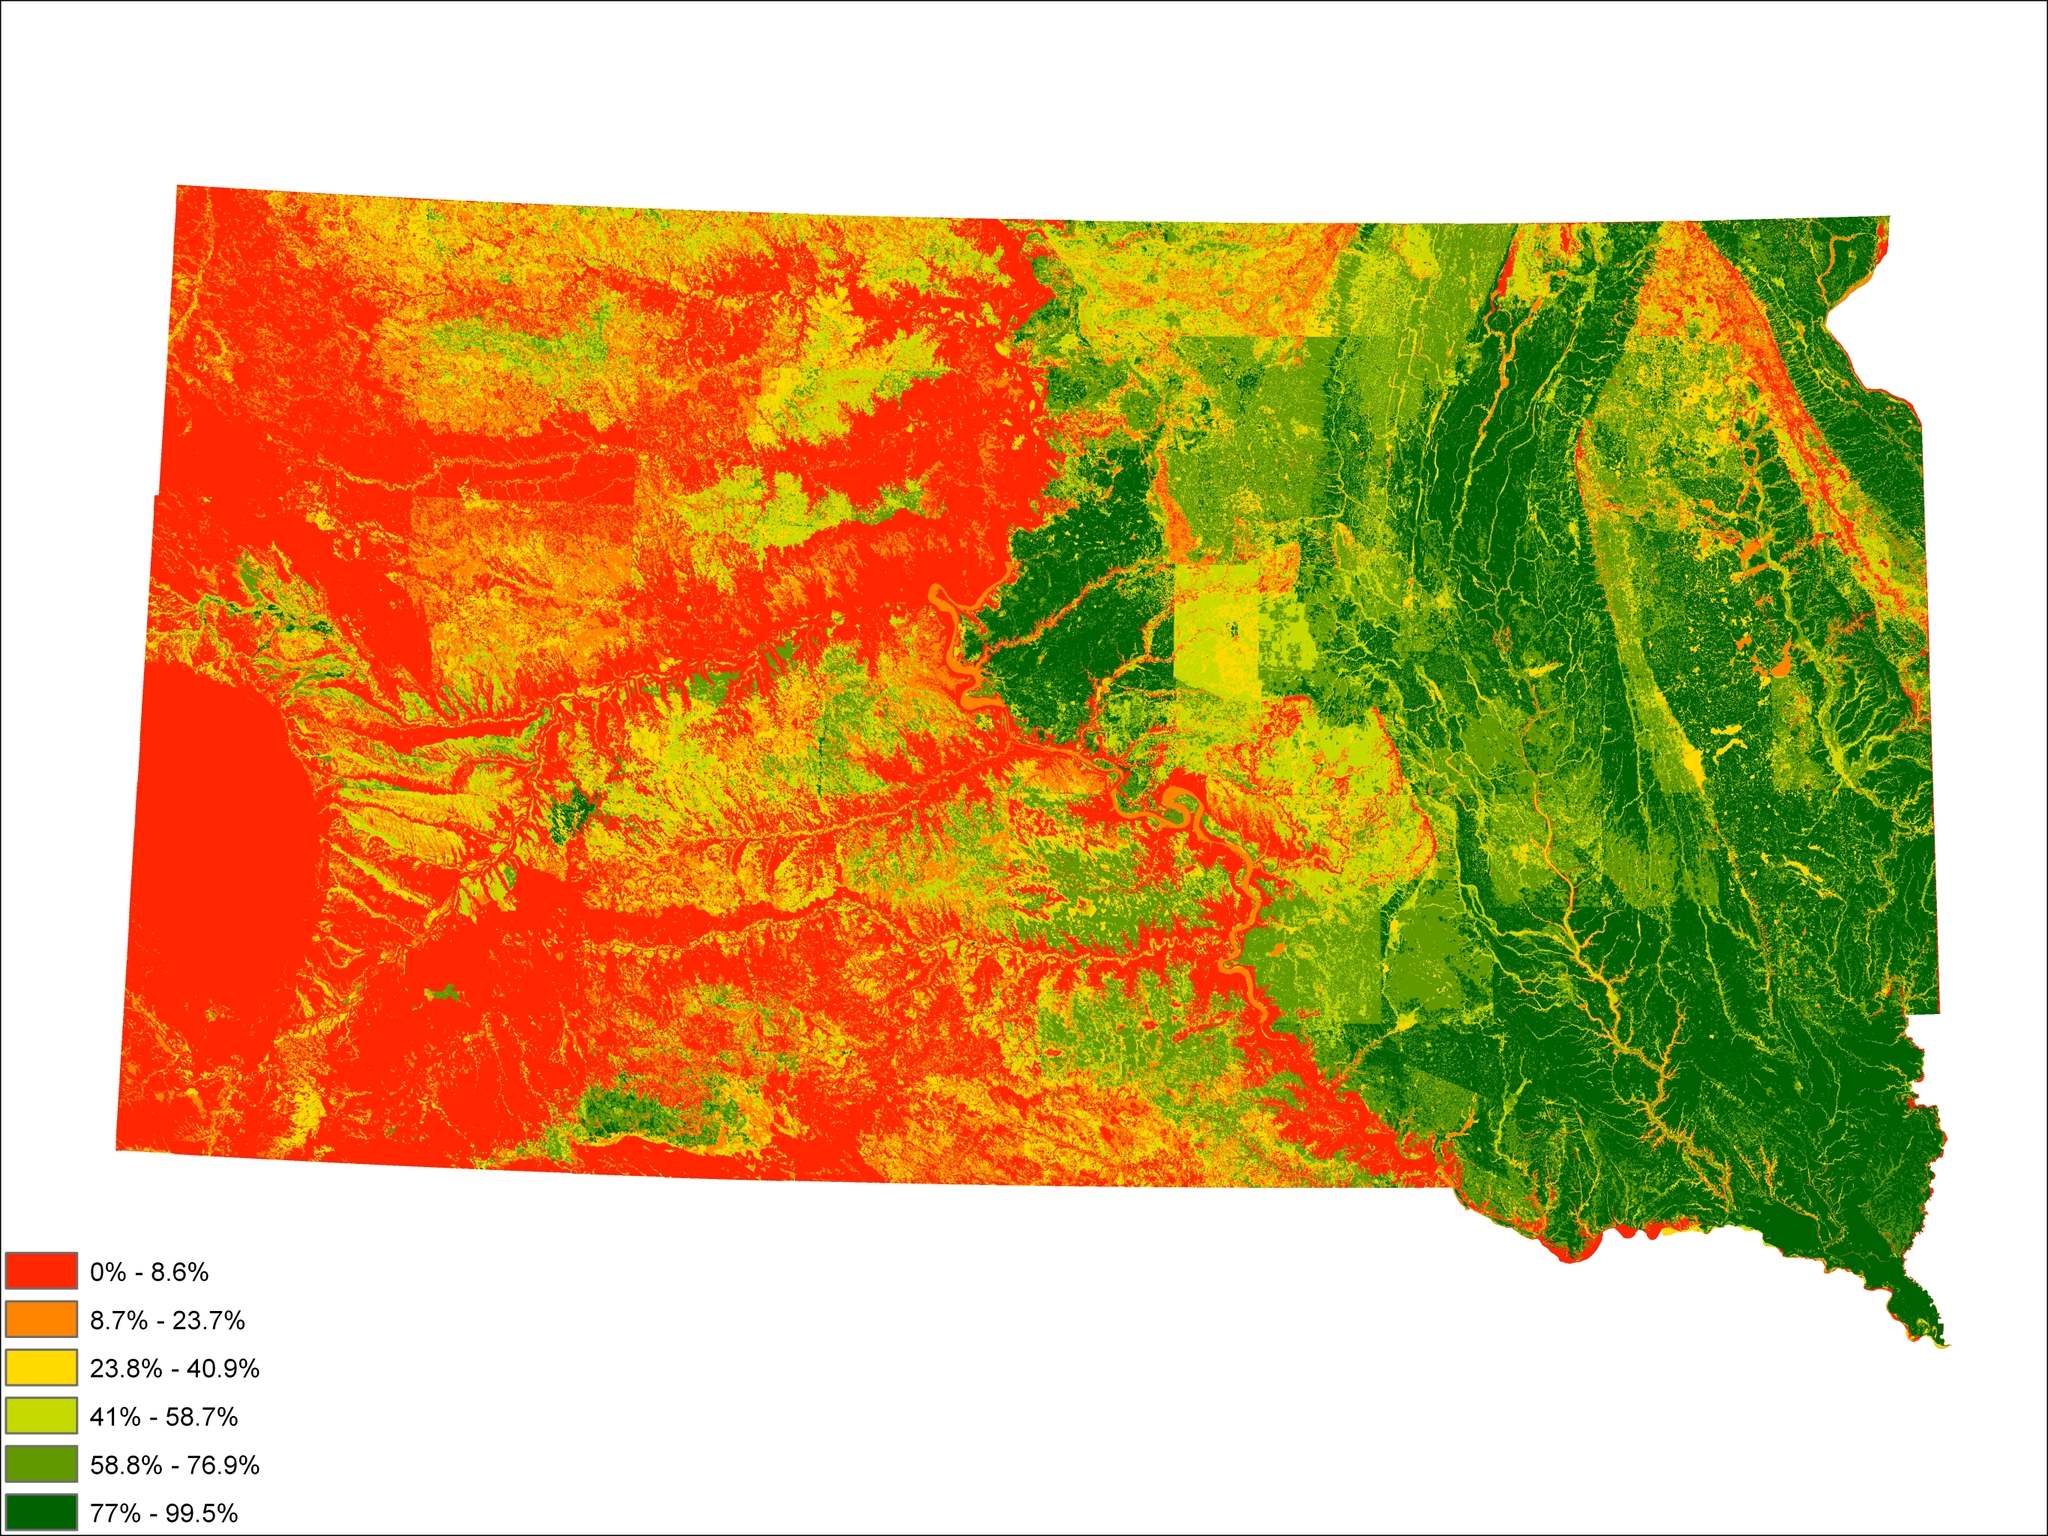
Using the 2017 USDA-NASS CDL, we found that the actual use on a large amount of agricultural land does indeed appear to diverge from the current HBU formula used to make an assessment in South Dakota (see Figure 1). The initial findings suggest that a large number of acres (in red) are assessed using the cropland use-value formula even though they were actually being used as noncropland. Further, a number of acres were assessed as noncropland when they were being used as cropland (indicated by green hue in Figure 1). Areas where the current determination of HBU and the use in 2017 appear to match are indicated by the gray hue in Figure 1. When using the current determination of HBU and the ag productivity formula, assessments in dollars per acre for 2017 are shown in Figure 2.
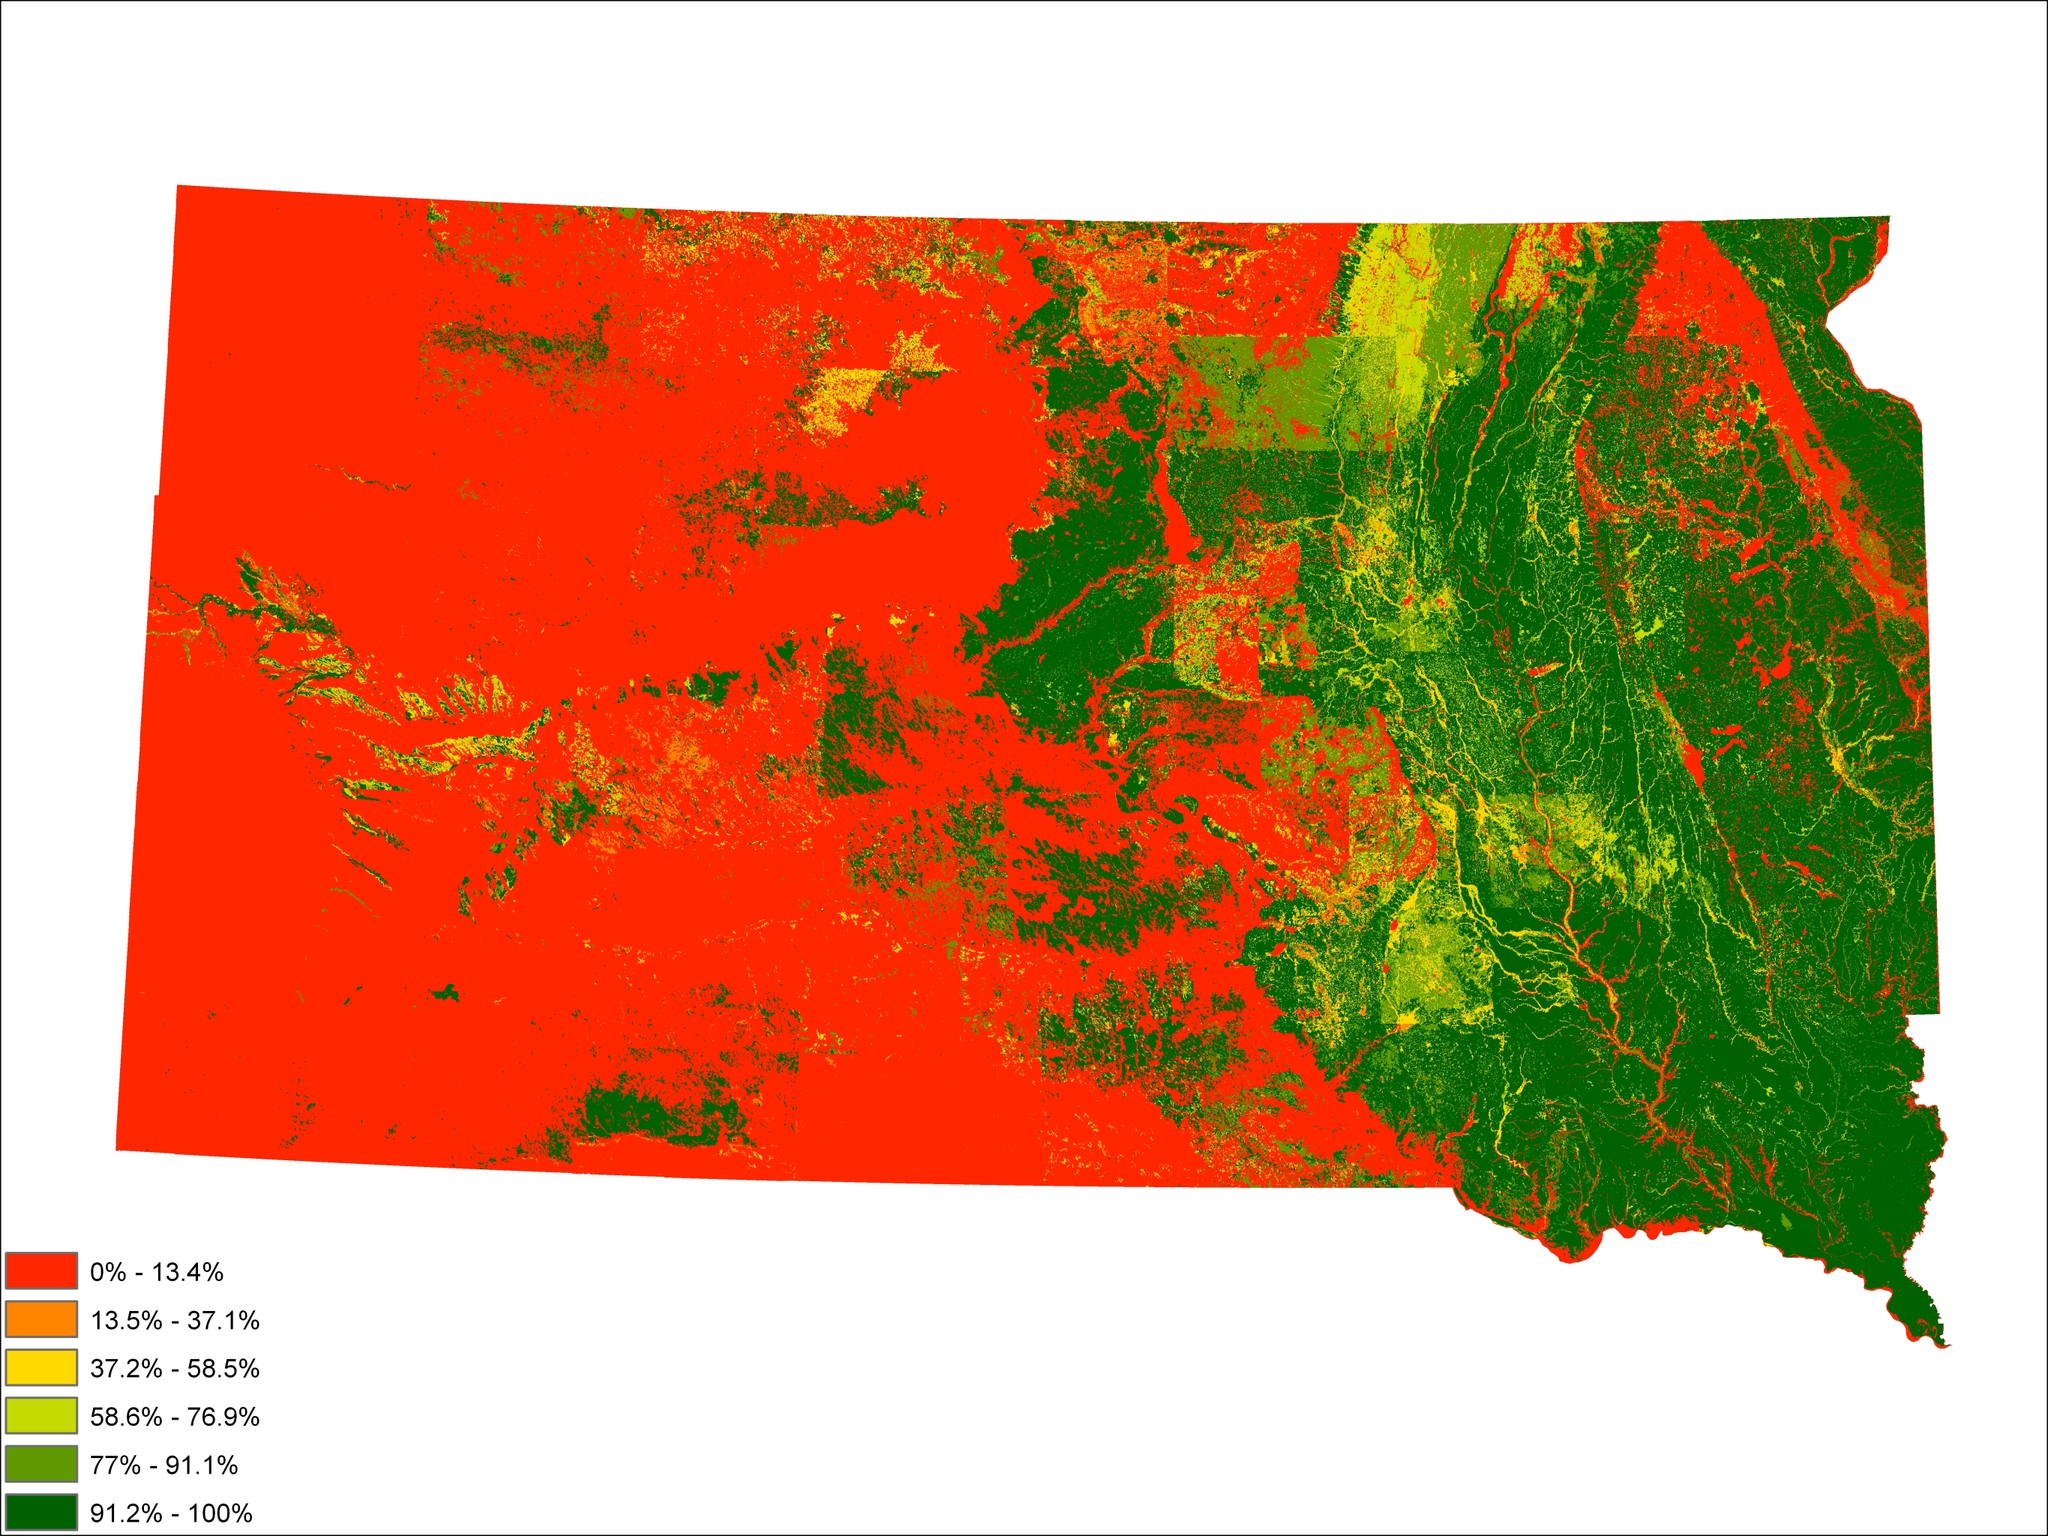
Using the random forest regression model that included soil attributes, crop and range productivity measures, topography, returns, climate information, and observed use patterns, we predicted the intensity of cropland use for each soil map unit throughout the state (see Figure 3). In the eastern third of South Dakota, most of the soil map units, regardless of their LCC, were expected to be cropped at greater than 78% intensity. In central South Dakota, estimates of expected cropping intensity were generally less but greater than 42% cropping intensity for most soils. In western South Dakota, we did not generally expect soil map units to be used intensely as cropland.
Because South Dakota has previously made HBU determinations at the soil map unit level, the MPU rule we examined states that if the soil map unit had greater than 50% probability of being mostly used as cropland, then the director of equalization would assess the whole soil map unit using a cropland use-value formula. Conversely, at a probability of 50% or less, the director would assess the whole soil map unit using a noncropland use-value formula (see Figure 4). We had high confidence the soil map units would mostly be used as cropland when the assessed probability was 90% or greater. Conversely, we had high confidence the soil map units would be mostly used as noncropland when the assessed probability of mostly being used as cropland was low (10% or less). There was less certainty, however, about the primary use of the soil map unit if the probability of being used as cropland was in the 40%–60% range.
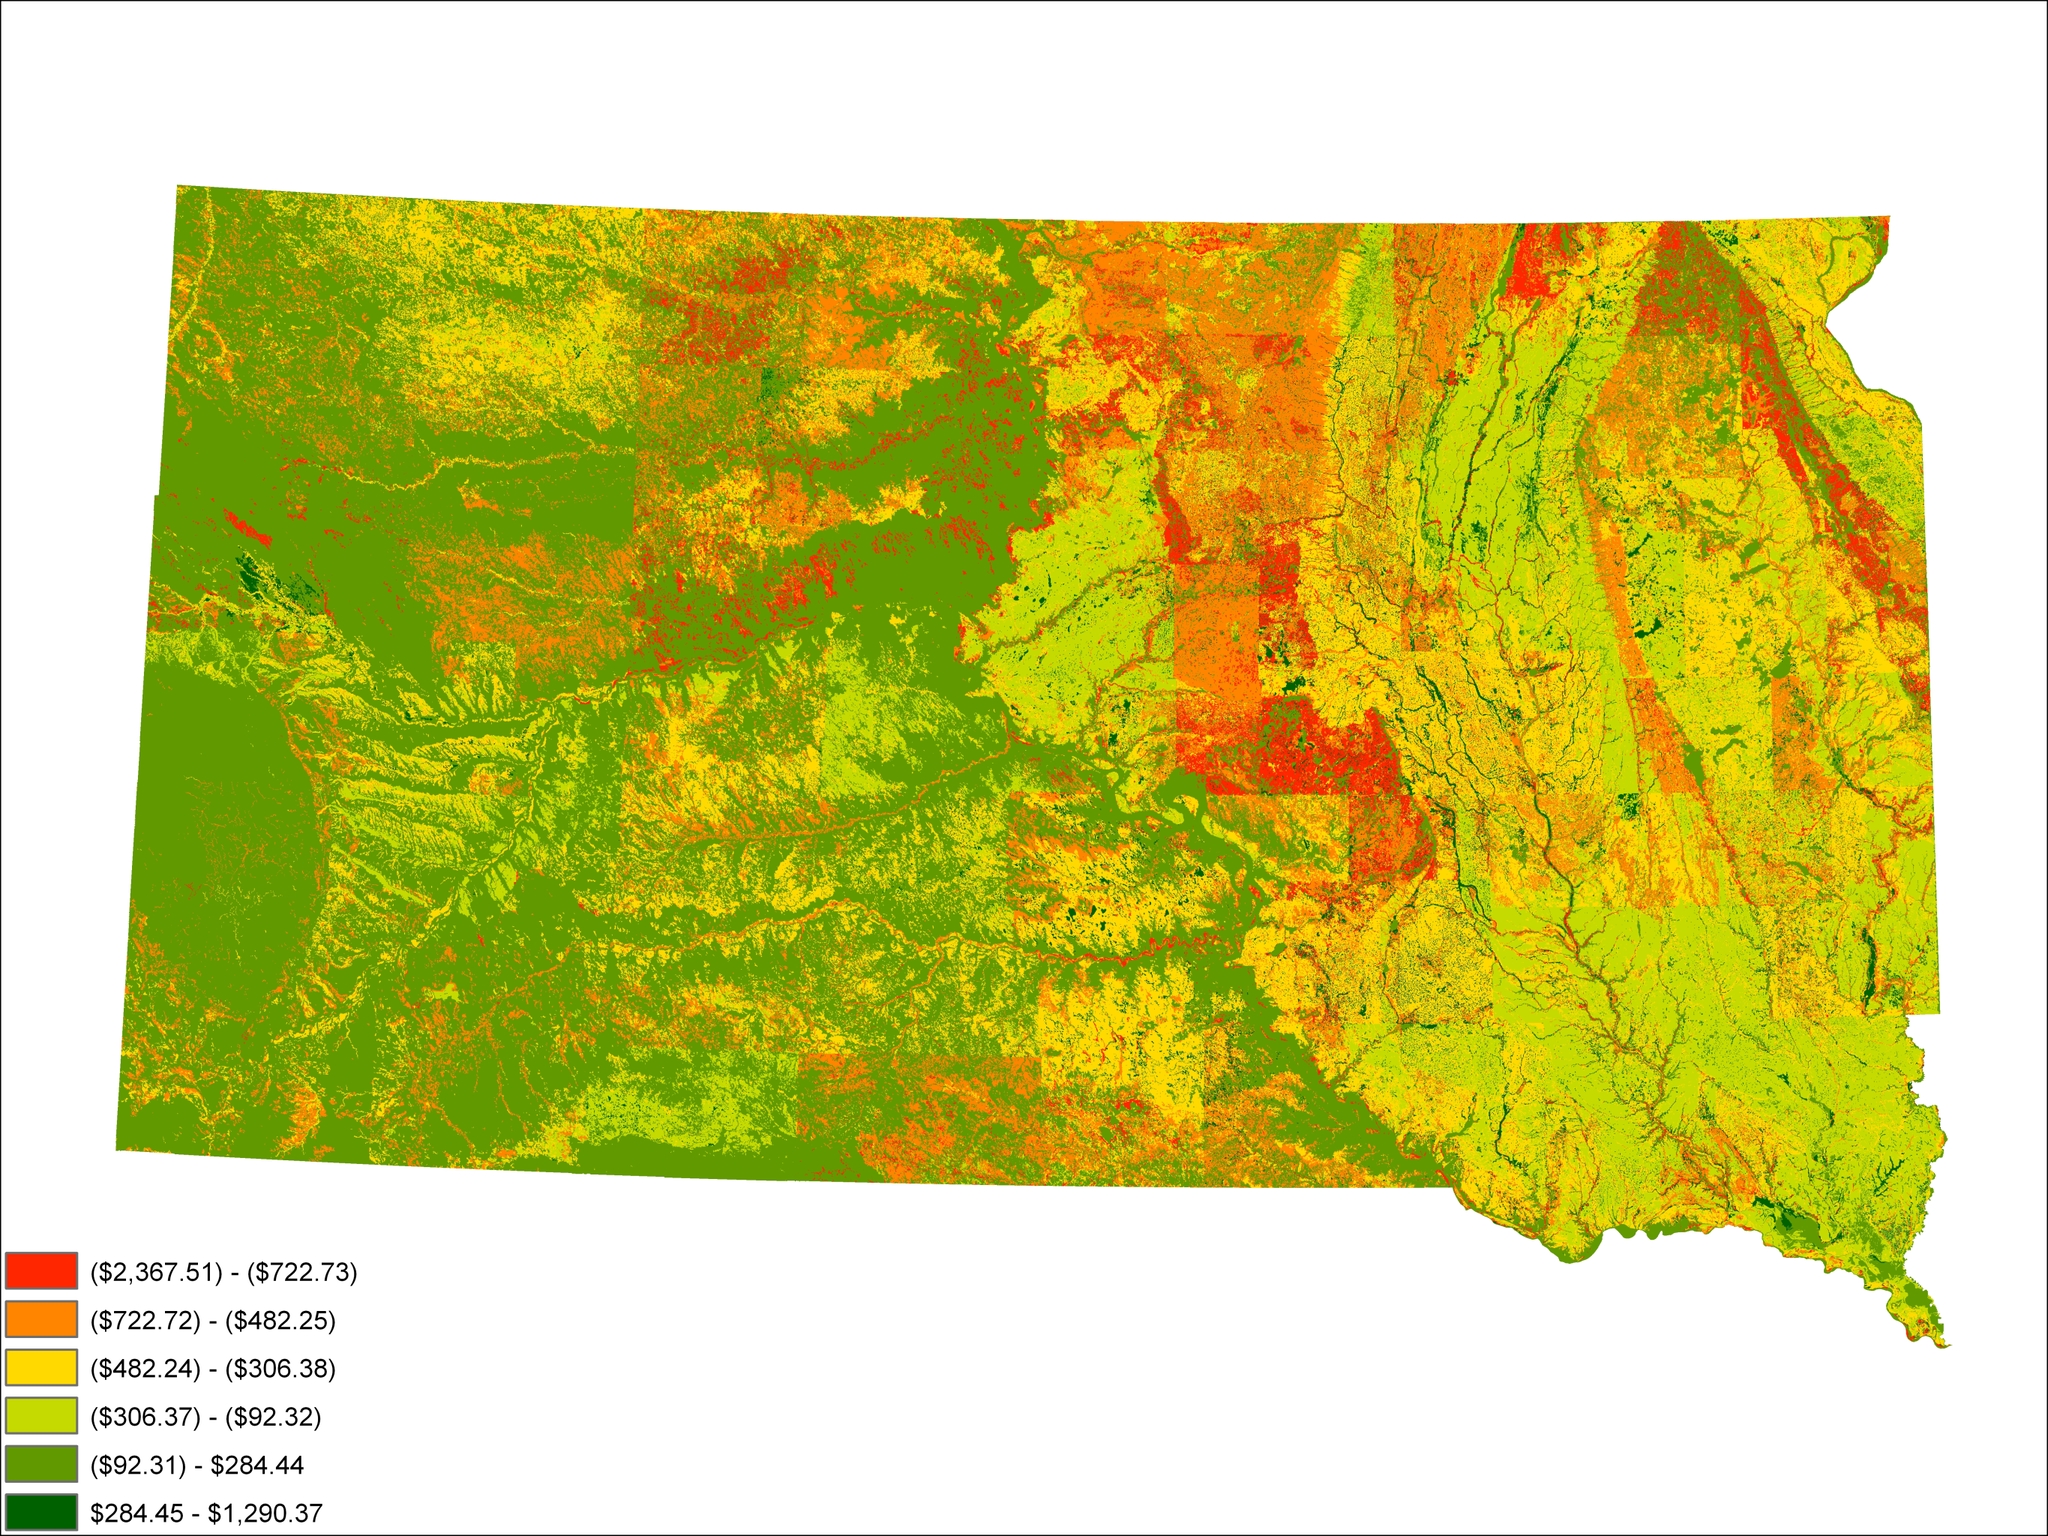
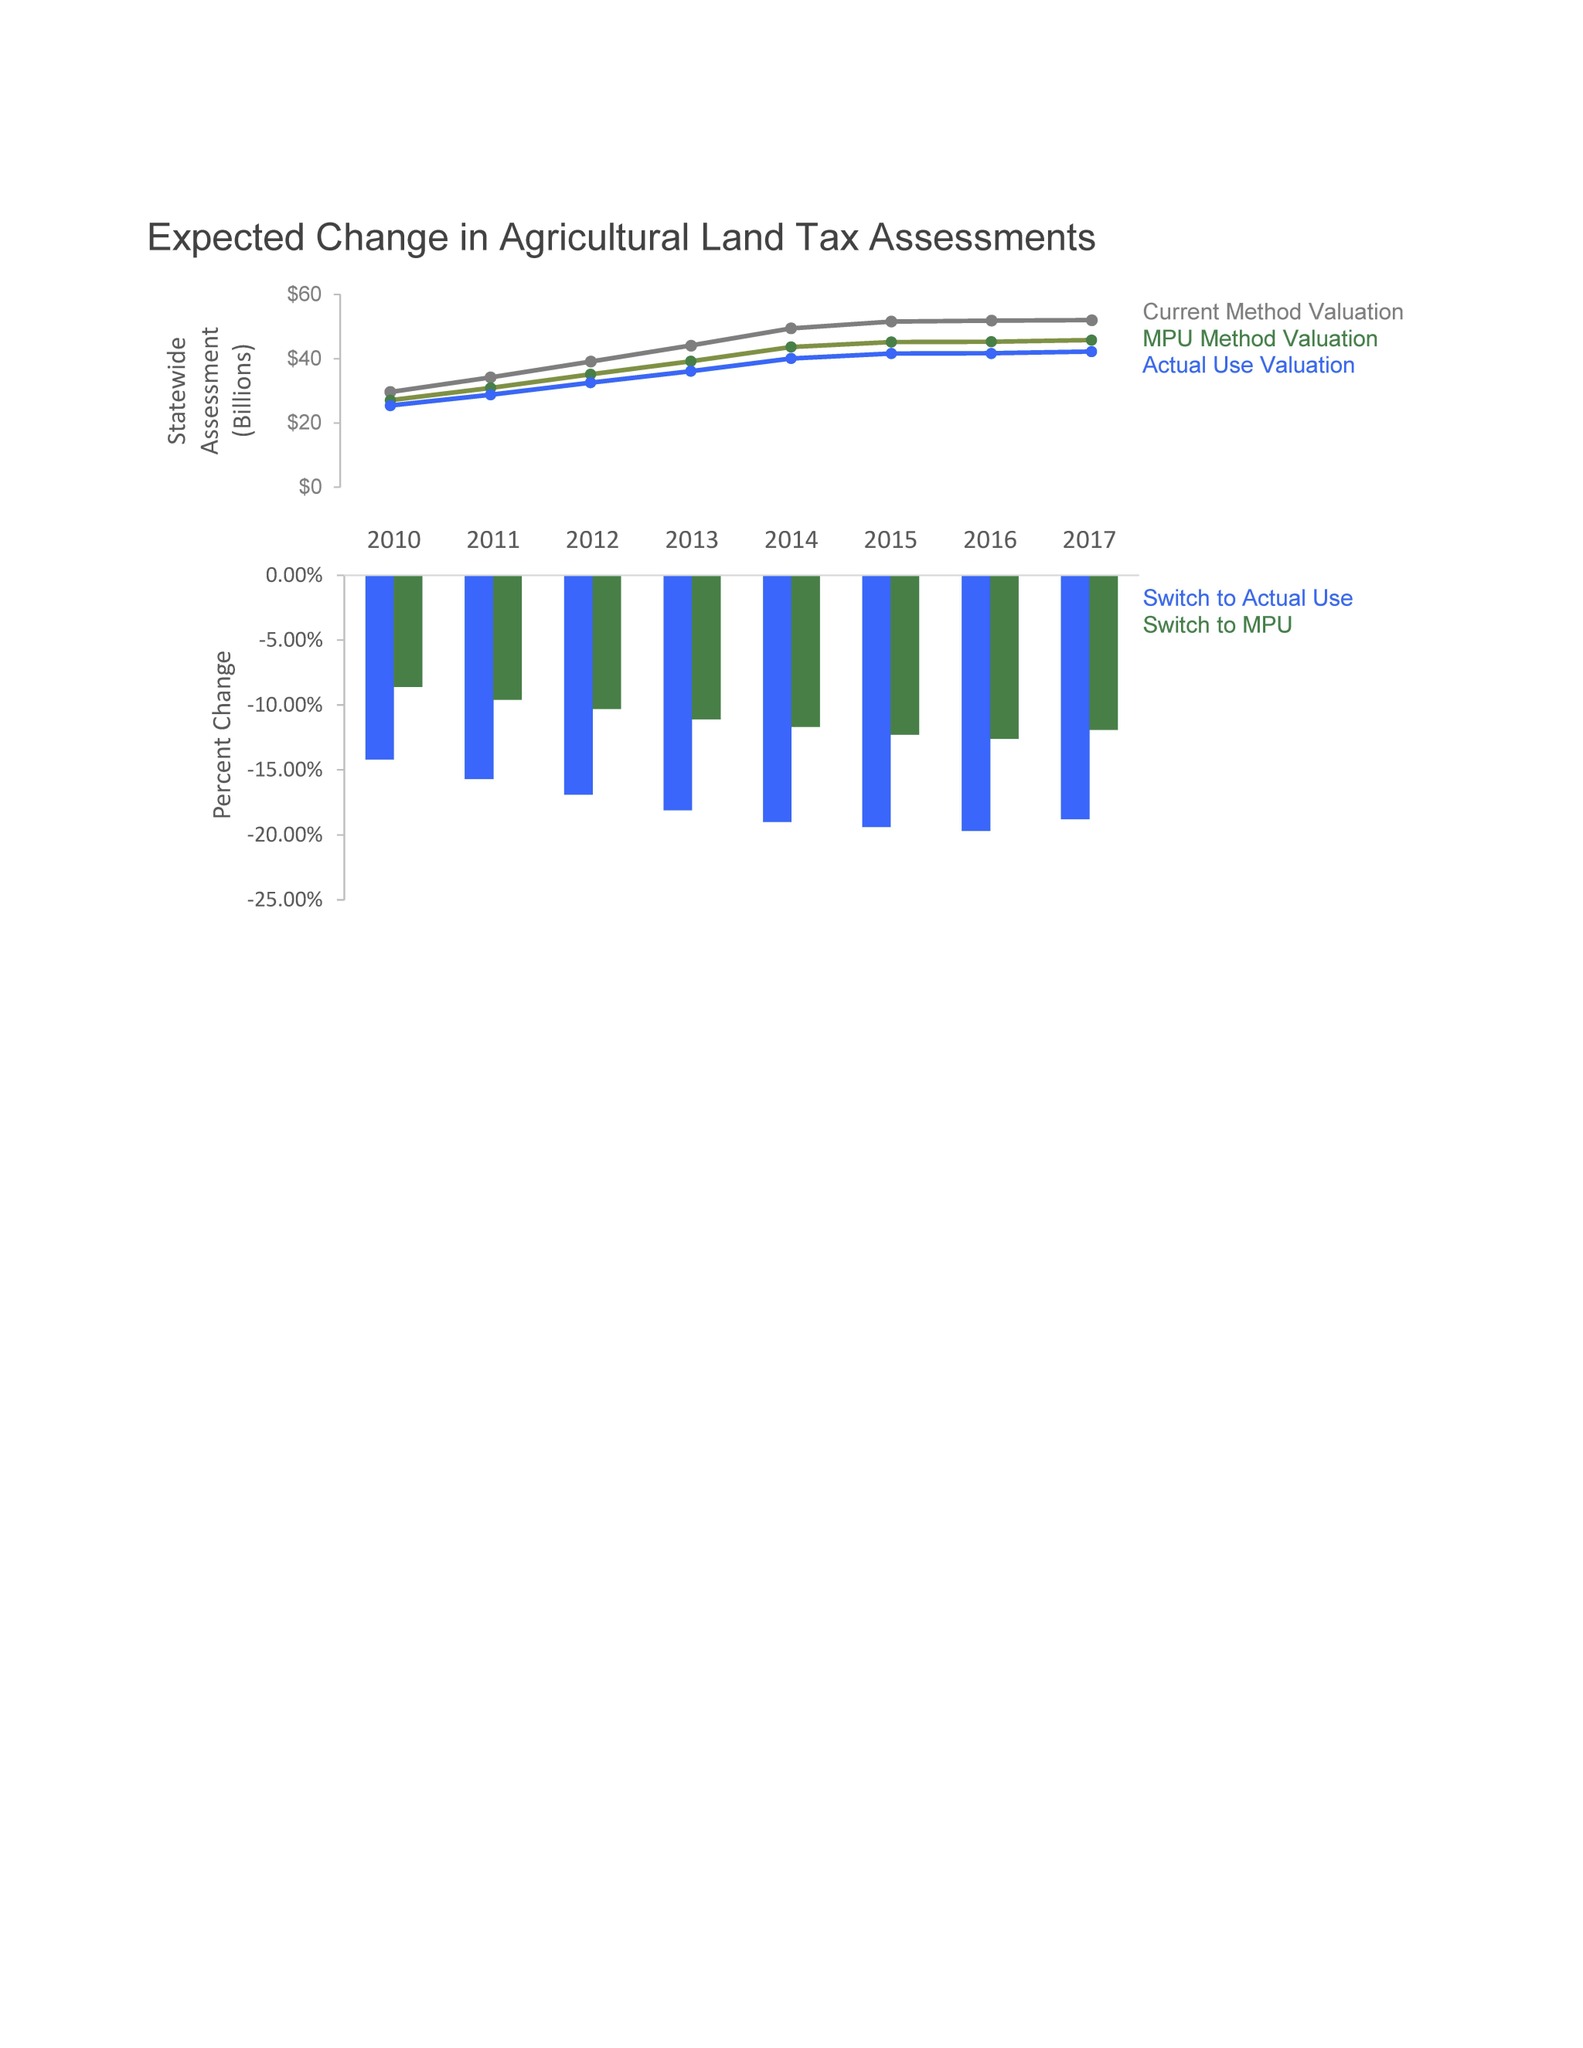
Figure 5 shows the expected change to agricultural land assessments in 2017 if the MPU policy were adopted as previously described. Areas in yellow would see agricultural land assessments decrease by $55.05/acre to $419.22/acre, for example. Areas in orange and red, predominantly in western South Dakota, would see assessments decrease even further. Areas in dark green indicate places where agricultural land assessments would increase by more than $596.02/acre.
Alternatively, the AU policy assesses each soil map unit based on the weighted average formula for cropland and noncropland use since 2010. For example, if average observed cropland use since 2010 is 60%, then the soil map unit would be assessed using a weighted average of the cropland use-value formula and noncropland use-value formula, using weights of 0.6 and 0.4, respectively. Generally, the AU policy would not be based entirely on the current use decisions of one individual except in the rare case in which an individual happens to own all of the acres of a particular soil map unit. Thus, an assessment using an AU policy would likely differ from a value-in-use assessment and would capture some of the guidelines sought in an acceptable HBU determination.
Figure 6 shows the changes in assessments when switching to the AU policy described above. Under this type of policy, many areas would see a decline in agricultural land assessments. The main difference we find is that assessments under the AU method are lower in eastern South Dakota, where there is a high intensity of cropland use but full use of the soil map unit as cropland is often less than 100%, than the assessments made using the MPU method. In western South Dakota, assessments under the AU method would not fall as much when compared to MPU because some soil map units have crops but the intensity of cropping is not sufficiently high to determine that the soil map unit is mostly used as cropland.
Across all the years a use-value formula has been employed in South Dakota, the change from the current HBU policy to either an MPU or an AU policy would cause statewide agricultural land assessments to fall (Figure 7). Specifically, statewide agricultural land assessments in 2017 would have fallen from approximately $52 billion to $46 billion, a drop of 12%, had there been a switch to an MPU method. Statewide assessments would fall to $42 billion, a drop of 19%, had there been a switch to an AU method. The impact would be particularly sizable in the western part of the state if the MPU policy were adopted. Alternatively, the impact would be sizable across the whole state if the AU policy were adopted.
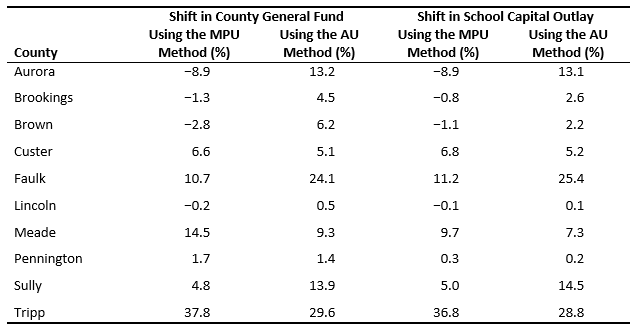
Additional concerns have been raised regarding the impact of HBU policy change on county budgets, local mill levies, and tax liability shifts to commercial and residential classes of property. The expectation is that even though agricultural land assessments may fall, mill rates would be raised to cover necessary county expenses; thus, property tax liability for agricultural land may not change nearly as much as the change in assessments. However, there are additional rules that must be considered including that the county general levy and school capital outlay levy need to be equivalent across all classes of properties, and the school capital outlay levy cannot exceed $3.00 per $1,000 of assessed value. We worked with the South Dakota Department of Revenue (2019) to understand potential shifts in tax burden for each alternative policy in 11 selected counties throughout the state. The estimated percentage shifts in tax liability for the county general fund from agricultural classes to nonagricultural classes of property ranged from −8.9% in Aurora County to 37.8% in Tripp County if there were a switch to the MPU policy (Table 1). The negative values for Aurora, Brookings, and Brown Counties indicate that the tax burden for the general fund actually increased for owners of agricultural property, while the tax burden dramatically shifted to nonagricultural properties in Tripp County and in other counties with positive values. Alternatively, the tax burden always shifted to nonagricultural properties when switching to the AU method. Similar shifts were seen in the school capital outlay fund when switching to both methods. The magnitude of shifts depends on the amount of residential and commercial property in the counties and whether the mill levies were constrained by the $3.00 maximum levy per $1,000 assessed rule. For counties that hit the limit on the $3.00 per $1,000 assessed rule, it is expected that total funding for school capital outlay would fall. Additional sources of funding would need to be secured to maintain funding levels.
For more details on the data and model specifics, as well as a close view of maps on the HBU policy change impacts with background aerial imagery, see http://agland.sdstate.edu/HBU/. Data used in the model and assessments by soil map unit can be downloaded as a .csv file by county.
Our findings indicate that, even though NRCS soil ratings provide measures of soil productivity and capability, they are less accurate in predicting the MPU of agricultural land—particularly in western South Dakota. In addition, HBU based on NRCS soil ratings differ from methods defined by appraisal accreditation organizations. To improve HBU measures and better predict the MPU of agricultural land, we suggest using additional variables and updated methods consistent with the Appraisal Institute’s (2015) definitions of HBU and MPU and the Appraisal Standards Board’s (2018) standards for mass appraisal, which require the use of common data and a standard methodology that allows for statistical testing when valuing a universe of properties.
We further advise that, regardless of the impact to tax shifts, legislators need to ensure that the methods used to determine HBU meet the standards and definitions outlined by appraisal institutions. A sound HBU determination and assessment policy should be independent of discussions about how to fund county expenses and rural schools sufficiently. We also want to highlight that criticism of agricultural use-value assessments may be misdirected to elements of the formula, or the formula itself, when the prior HBU may not be appropriately determined. As we outlined here, alternative methods for HBU determination can have a large impact on agricultural land assessments and tax burden, regardless of whether a use-value formula is used.
One limitation of the MPU method is that it would be more difficult to explain than the simpler determination based on the NRCS LCC. In addition, the choice of variables to include in the model and model specification could affect assessment results in some areas. Thus, variable inclusion and modeling standards should potentially be more defined to ensure consistent decision tree assessments. Moreover, alternative levels of the analysis unit may need to be considered. For example, one variable that should possibly be included in the MPU model is the spatial relationship of cropping intensity between individual soil polygon and its surrounding soil polygons. For example, a soil map unit with a low cropping intensity may have an individual polygon surrounded by soil map units used intensely as cropland; compared to the entire soil map unit, the individual polygon would have a different probability of being utilized as cropland. Such an analysis was beyond the scope of this article.
An additional limitation to our research is that we only focused on two alternative policies. Many other potential policies could meet the guidelines outlined by appraisal institutions. Ultimately, HBU determinations involve a considerable amount of judgment, which should be made among a committee made up of stakeholders and appraisal experts to ensure equitable treatment of interest groups. Moreover, local adjustments are needed because of the vast number of assumptions associated with soil data from the NRCS, and the data we derived, that might not be consistent across the entire area of the soil map unit.
Anderson, J.E., and R.W. England. 2014. Use-Value Assessment of Rural Land in the United States. Cambridge, MA: Lincoln Institute of Land Policy.
Appraisal Standards Board. 2018. Uniform Standards of Professional Appraisal Practice, 2018–2019 edition. Washington, DC: Appraisal Foundation.
Appraisal Institute. 2015. The Dictionary of Real Estate Appraisal, 6th edition. Chicago, IL: Appraisal Institute.
Dotzour, M.G., T.V. Grissom, C.H. Liu, and T. Pearson. 1990. “Highest and Best Use: The Evolving Paradigm.” Journal of Real Estate Research 5: 17–32.
Justin, B.P. 2019. Valuing Rural America Foundations of Data Analysis. Glendale, CO: American Society of Farm Managers and Rural Appraisers.
Kansas Legislature. 2015. SB 178. Valuation of Agricultural Land.
Klingebiel, A.A. 1958. “Soil Survey Interpretation—Capability Groupings 1.” Soil Science Society of America Journal 22: 160–163.
Ohio Legislature. 2017. SB 36. Specify How Value of Agricultural Land Is Computed.
U.S. Department of Agriculture. Soil Survey Geographic (SSURGO) Database. Washington, DC: U.S. Department of Agriculture, Natural Resources Conservation Service. Available online: https://sdmdataaccess.sc.egov.usda.gov [Accessed 08 01, 2018].
Simkins, S. 2015. “Fall River County, AG Presentation.” Available online: www.sdlegislature.gov/docs/interim/2015/documents/ALA11-02-15FallRiverPowerPointPresentation.pdf.
South Dakota Department of Revenue 2019. Ag Land Pilot Study. Available online: http://sdlegislature.gov/docs/interim/2019/documents/DALA10242019-A.pdf.
U.S. Department of Agriculture. 2008–2017. USDA National Agricultural Statistics Service Cropland Data Layer. 2008–2017. Published Crop-Specific Data Layer [Online]. Washington, DC: U.S. Department of Agriculture, National Agricultural Statistics Service. Available online: https://nassgeodata.gmu.edu/CropScape/.
Wilson, D.C. 1995. “Highest and Best Use Analysis: Appraisal Heuristics versus Economic Theory.” Appraisal Journal 63: 11.

