The distribution of subsidy, conservation, and other payments from programs that are part of the ‘farm bill’ is of economic and political importance both to farmers and others in society. This includes agricultural land owners who may not be farmers but benefit from subsidies, politicians who create the policies, taxpayers who pay the costs, and other concerned citizens. Previous research has shown that the absolute amount of farm program payments are positively related to farm size and wealth (Roberts and Key, 2003), due in part to the fact that commodity-based payments are related to the number of acres or amount of production of subsidized commodities. It is also apparent that a majority of farm payments go to a relatively small percentage of farms. Since 1995, 10% of farms have received 75% of farm payments that totaled $292 billion (Environmental Working Group (EWG), 2013).
The modern era of farm legislation began with the Agricultural Act of 1949, which has been modified and reauthorized roughly every five years since then. This legislation has provided various kinds of payments to individuals engaged in agricultural production and marketing activities. Farm programs are complex and involve several types of commodity subsidies as well as payments related to soil and water conservation, other types of environmental stewardship, and crop insurance. Moreover, agriculture is highly diverse, and farmers and ranchers in different regions participate to varying degrees in these programs. These factors contribute to the difficulty in understanding their distributional impacts.
We utilize individual responses to the Agricultural Census to examine the distribution of the major types of farm program payments among four regions of the country—the Corn Belt, the Lake States, the Northern Plains, and the Pacific Northwest (PNW) east of the Cascade Mountains (we exclude the western side of the Cascades due to the diverse mix of specialty crops that have little connection to the farm bill provisions and because it has large metropolitan areas). The Corn Belt and Northern Plains regions illustrate the distribution of payments in regions where “program commodities” dominate the production systems, whereas the Lake States and PNW represent more diverse regions less dominated by those commodities. Despite large differences in the size and type of farms in these regions, our analysis shows some common patterns in the distribution of payments.
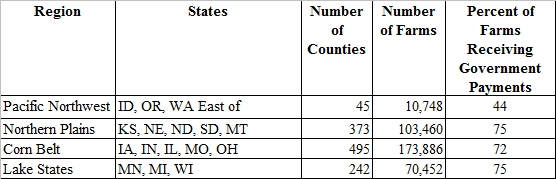
According to the 2007 U.S. Department of Agriculture (USDA) Census of Agriculture, 38% of entities defined as farms received some form of government payments. It is important to recognize that a household or other legal entity that would normally have $1,000 or more in sales is counted as a farm in the Census. In the Corn Belt, Northern Plains, and Lake States, 72%, 75%, and 75% of the farms received government payments, respectively, compared to 44% in the PNW (Table 1).
The vast majority of this money (61%) has gone toward commodity subsidies such as direct and counter-cyclical payments, average crop revenue (ACRE) program payments, price support, and loan deficiency payments (EWG, 2013). Within this category, $84 billion has been used to fund programs within the 10 states in the Northern Plains and Corn Belt regions, representing over 47% of all commodity payments. For comparison, the Northwest states—Idaho, Oregon, and Washington—and the Lake States—Minnesota, Michigan, and Wisconsin—received just 3% and 10%, respectively, of these subsidies.

Crop insurance premium subsidies made up the second largest portion of these payments (18%) followed by conservation programs (13 %) and disaster subsidies (8%). Figure 1 illustrates how subsidies in these four main categories have changed since 1995. The commodity subsidies have varied significantly over time. The spike in the 1990s occurred in response to a sharp decline in commodity prices and a resulting increase in price support payments due, in part, to increases in supply after the 1996 farm bill eliminated annual set-asides and most government storage programs (Ray, De La Torre Ugarte, and Tiller, 2003; and Zulauf, Roberts and Boorman, 2005). The decline since 2005 was the result of rising commodity prices which meant that price support payments were reduced. The portion of subsidies going towards conservation has remained relatively stable, between $1.5 and $3.0 billion per year. Disaster payments have consistently ranged between $0.1 and $3 billion, and crop insurance premium payments have been increasing, especially in the last few years.
Partly to reduce reliance on disaster assistance, farmers receiving commodity subsidies since 1996 have been required to participate in federally subsidized crop insurance programs or waive eligibility for federal disaster relief. The crop insurance programs provide premium subsidies that have been gradually increasing and, in 2011 and 2012, surpassed commodity subsidies. This steady increase in crop insurance subsidies is due to incentives that have been enacted throughout these years aimed at increasing participation (Risk Management Agency 2013). In 2000, premium subsidies were increased and, over the last few years, products that combine yield and price coverage were introduced. Government crop insurance spending is forecast to increase. According to the Congressional Research Service, over the next 10 years, federal spending on crop insurance is projected to outpace spending on traditional commodity programs by about one-third (Congressional Research Service, 2010). Proposed changes in farm legislation would further expand the size and scope of crop insurance premium subsidies.
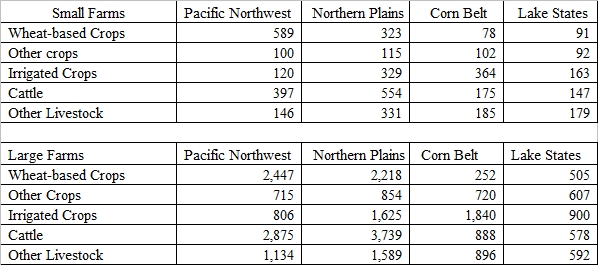
To examine who receives farm program payments, we analyzed 2007 Census of Agriculture data on the average payments per farm made to each type of farm receiving payments for the following programs: Direct Payments, Conservation Programs (primarily Conservation Reserve Program (CRP) and Wetlands Reserve Program (WRP)), other conservation programs (primarily the Environmental Quality Incentives Program (EQIP) and the Conservation Security Program (CSP)), and Market Assistance Loans and Loan Deficiency Payments. We did not include crop insurance premium subsidies because those data are not available in the Census, and we did not include insurance indemnity payments because they are only received when claims are made. We stratified the farms into five categories that represent the major systems in the region, and then separated these into large and small farms by their number of acres. We define large farms as those above the median size for the region, and small farms are those below the median for the region, with farms of less than 50 acres excluded (Table 2). This classification puts 70% to 80% of the value of production into the large farm group in these regions, reflecting the well-known fact that the larger farms produce most of the value of output in U.S. agriculture.
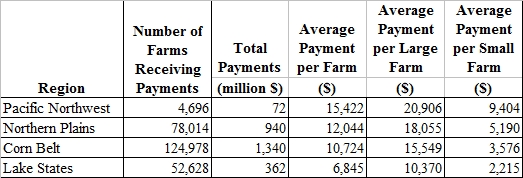
It is important to note that the relative importance of these types of farms varies substantially by region, with the Corn Belt states being by far the most homogeneous with crop production concentrated in rainfed corn and soybean production and livestock. The total farm payments for each region are presented in Table 3. Farms receiving payments in the PNW states received the largest average subsidy per farm of $15,422. The average of farm payments for the Northern Plains, Corn Belt, and Lake State regions were $12,044, $10,724, and $6,845 respectively.
In addition to the stratification by farm size and type, we considered the absolute level of payments as well as the payments relative to the amount of agricultural net returns earned from sales of crops and livestock.This relative measure of payments is motivated by the idea that recipients of payments care about how much they receive relative to the scale of their operation. Constructing this relative measure is complicated by the fact that many farms in these regions—on average about 36%—in the Census report negative returns (total sales less total farm expenses). To deal with this complication, we stratified farms into those with positive net returns and those with negative net returns. Here we present data for farms with positive returns; the corresponding data on farms with negative returns are available online at caep.oregonstate.edu.
As expected, the data show that large farms received on average two to five times more subsidies in total dollar amounts than small farms. The data also show a great diversity in the absolute and relative distribution of program payments across regions, farm sizes, and types. To illustrate this diversity, we present data from the PNW and the Corn Belt (Figures 2 and 3). Note, for example, that in the PNW the largest subsidies in total dollars go to wheat-based crop farms, whereas in the Corn Belt the largest subsidies per farm go to crop farms with irrigation. In addition, there are some notable patterns in the data.
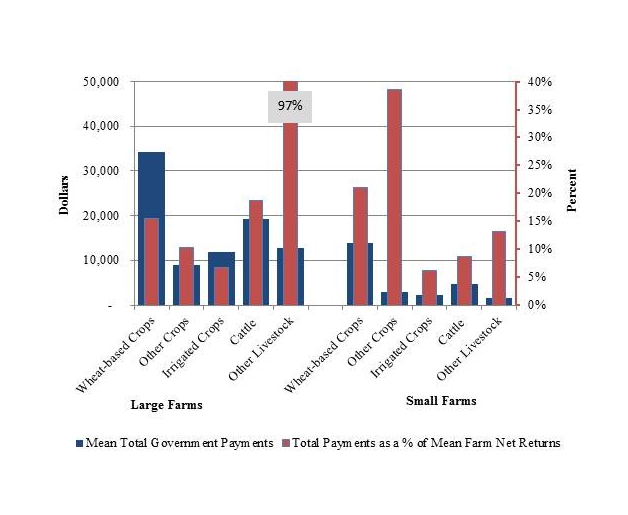
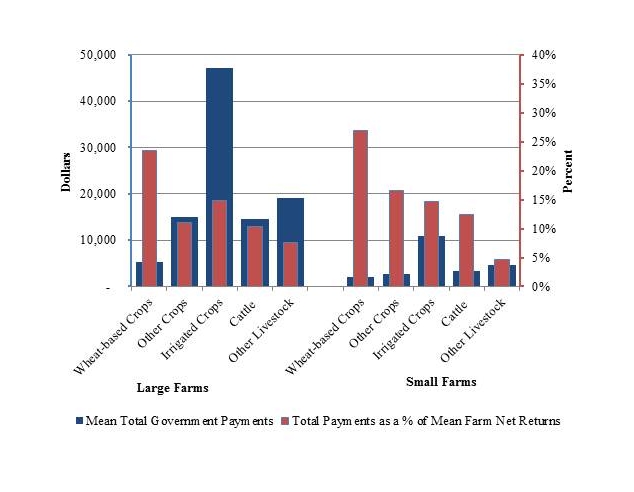
First, while it is clearly true that large farms receive the lion’s share of payments, some types of small farms receive as much or more than some types of large farms, both in absolute and in relative terms. For example, small, wheat-based farms in the PNW receive more subsidies than large, irrigated crop and other crop farms, both absolutely and relatively (Figure 2). Moreover, many types of small farms receive as much as or more than large farms in relative terms, as illustrated by large and small crop farms in the Corn Belt (Figure 3).
A second noteworthy fact is that many livestock-producing farms also receive substantial payments, in most cases representing 10% to 15% or more of net returns (and more than 95% for other livestock in the PNW). This fact is notable given that livestock producers are often described as not benefiting from farm subsidies. The data disaggregated by type of payment show that these farms, in fact, receive money from all payment categories, including substantial direct payments because some livestock farms grow commodity crops, and also participate in various conservation programs (Figures 4 and 5).
A third notable pattern emerges when examining the type of government payments that go to the different types of farms in these regions (Figures 4 and 5). The data show that direct payments are a significant portion of total mean government payments for all farm types—representing as much as 92% of total mean government payments for some large farm types—but are particularly dominant for farms with positive returns. Note, for example, that in Figure 4, direct payments represent 40% to 70% of government payments for most of the farm categories.
The same data for farms with negative returns indicate that direct payments represent as little as 10% of government payments for all categories. The data also show a general pattern across regions, with CRP and WRP payments tending to be more important for farms with negative returns, representing as much as 85% of total mean farm payments.This may reflect the fact that farmers who tend to have losses are older and approaching retirement, or in locations with poor soils and high climatic risk, both of which are more likely to mean lower returns and increased participation in conservation programs. In the PNW, for example, among large farms with negative net returns, all farm types—except wheat-based, rainfed farms—obtain a greater proportion of their government payments from conservation payments (ranging from 49% to 85%) than from direct payments (10% to 43%). By contrast, in the Corn Belt, for farms with negative net returns, the opposite is true; all large farm types except wheat-based, rainfed farms obtain a greater proportion of their government payments from direct payments (59% to 73%), rather than conservation payments (2% to 24%). Thus, we can see that there are substantial regional differences in the importance of the different types of programs, as well as among different farm sizes and types.


The Senate and the House both had their own versions of a 2013 farm bill (Congressional Research Service, 2013). The Senate’s version was approved in June 2013, followed by the House approving its version (minus the nutrition title) in July 2013. Subsequently the House adopted a resolution that combined a nutrition bill passed in September with the farm bill. As of this writing, the fate of the farm legislation was still uncertain, with versions of both the Senate and House bills being discussed by a conference committee.
The most recent statistics from the Food and Agricultural Policy Research Institute (FAPRI) estimate that proposed changes in the farm bill (excluding the Supplemental Nutrition Assistance Program (SNAP)) could reduce 10-year net budgetary outlays by $18.1 billion under the Senate bill and $12.6 billion under the House bill (FAPRI, 2013). Most of the savings would be achieved by eliminating the direct payments program and consolidating other programs, many of which are within the Commodity Programs, Conservation, and Nutrition Title of the 2008 legislation. Both versions would eliminate direct payments but substantially increase crop insurance subsidies. However, the high cost of crop insurance subsidies caused by the 2012 Midwestern drought has generated some opposition in Congress to increases in these subsidies. How crop insurance will be addressed in a new farm bill remains unclear. The new legislation may also add conservation compliance requirements to crop insurance, similar to those associated with commodity-based subsidies, most notably direct payments, a proposal supported by many policy analysts and environmental organizations.
Combined with the expected changes in farm bill programs, the analysis presented above of the payment distributions under current policy provide some insights into what changes could occur with a new farm bill.
First, those large farms producing subsidized grains and other traditional “program crops” that now receive a large share of farm subsidies—and also receive a relatively large share of their program payments from direct payments and conservation programs—are likely to see substantial reductions in payments. However, if crop insurance subsidies increase, the net impact on total payments will be offset to some degree, depending on the redesign of crop insurance programs. According to one analysis done last year, average payments to producers under the proposed insurance programs could be lower than payments under the previous programs by about $18 billion over the next 10 years (FAPRI, 2012). If conservation compliance requirements are added to crop insurance, this could have an impact on participation. However, farms that are receiving direct payments now and are farming environmentally vulnerable land should already be complying with conservation requirements so this effect should be minimal. Note, though, that substituting crop insurance subsidies for direct payments may not result in dollar-for-dollar benefits to producers because insurance payouts would vary with weather and other conditions affecting crop yields or revenues. Also, expansion of crop insurance subsidies to non-traditional commodities could broaden the distribution of program benefits. However, this could also lead to potentially larger budgetary costs over time for crop insurance. If this process then led Congress to impose caps on crop insurance, it could result in a net reduction in subsidy levels to producers of traditional commodities.
Second, this analysis shows that less-profitable farms depend more on conservation subsidies than direct payments. These farms would tend to lose from reductions and caps on conservation program payments. The increase in crop insurance subsidies would encourage farmers to move land from conservation reserves back into production, particularly if conservation compliance requirements are not imposed on subsidized crop insurance. These changes could offset reductions in direct payments and conservation programs but could also have detrimental environmental consequences.
Third, our analysis shows that although smaller farms tend to receive smaller absolute payments from farm programs, they often receive as much or more relative to the amount they earn from farm production. Moreover, the data show that farm program payments are distributed widely across various types of crop and livestock-producing farms. Thus, the cuts in farm subsidies will impact not only large, profitable, commercial crop farms, but they will also reduce incomes for various types and sizes of farms. In a relative sense, these cuts could have more impact on small farms than large farms, particularly those farms that are highly dependent on the program payments to remain in production. It appears likely that the cuts in farm programs could hasten the ongoing process of consolidation of land into larger operations, particularly from the loss of “agriculture in the middle,” i.e., the loss of mid- and small-size farms that have difficulty competing with larger-scale operations. These findings suggest that those organizations interested in building a constituency for changes in farm policy should consider the distributional implications of current and possible future farm policy.
Congressional Research Service. (2013, October 8) The 2013 Farm Bill: A Comparison of the Senate-Passed (S. 954) and House-Passed (H.R. 2642, H.R. 3102) Bills with Current Law. Congressional Research Service, Report for Congress. R43076: Ralph M. Chite, Coordinator Section Research Manager. Available online: http://www.fas.org/sgp/crs/misc/R43076.pdf
Congressional Research Service. (2010, December 13). Federal Crop Insurance: Background and Issues. Congressional Research Service, Report for Congress, R40532: Dennis A. Shields, Specialist in Agricultural Policy. Available online: http://adriansmith.house.gov/sites/adriansmith.house.gov/files/CRS%20-%20Crop%20Insurance.pdf
Environmental Working Group. (2013). 2013 Farm Subsidy Database. Available online: http://farm.ewg.org.
Food and Agriculture Policy Research Institute. (2013, October). Impacts of Selected Provisions of the House and Senate Farm Bills. FAPRI-MU Report #06-13. University of Missouri. Available online: http://www.fapri.missouri.edu/outreach/publications/2013/FAPRI_MU_Report_06_13.pdf
Food and Agriculture Policy Research Institute. (2012, May). Impacts of Selected Provisions of the “Agriculture Reform, Food and Jobs Act of 2012” FAPRI-MU Report #03-12. University of Missouri. Available online: http://www.fapri.missouri.edu/outreach/publications/2012/FAPRI_MU_Report_03_12.pdf
Ray, D., De La Torre Ugarte, D., and Tiller, K. (2003). Rethinking U.S. Agricultural Policy: Changing Course to Secure Farmer Livelihoods Worldwide. Agricultural Policy Analysis Center, The University of Tennessee. Available online: http://agpolicy.org/blueprint/APACReport8-20-03WITHCOVER.pdf
Risk Management Agency (2013). History of the Crop Insurance Program. Accessed September 2013. Available online: http://www.rma.usda.gov/aboutrma/what/history.html.
Roberts, M.J. and N. Key. (2003). Who Benefits from Government Farm Payments? Choices, Third Quarter.
Zulauf, C.R., Roberts, M.C., and Boor, A.G. (2005, January). Has Price Behavior of Major Farm Program Crops Changed Since FAIR? (working paper). Columbus OH: Ohio State University, Department of Agricultural, Environmental, and Development Economics, College of Food, Agricultural, and Environmental Sciences. Available online: http://ohioagmanager.osu.edu/wp-content/uploads/2010/07/PriceBehaviorBeforeandAfter1996FarmBill.pdf.

