Agricultural policy analysis can be improved with a systematic approach to assessing relative risks for agricultural production. For example, the climate variables used to predict agricultural production outcomes are often chosen haphazardly due to poor information and convenience. In some cases, explanatory variables are chosen based on statistical methods and pretesting, but these variables may not match well with on-the-ground experience. Focus groups can help choose explanatory variables, but they can be costly and time consuming.
To improve policy analysis, this article provides a roadmap for assessing relative risks for agricultural production. Specifically, we analyze data from the U.S. Department of Agriculture (USDA) Risk Management Agency from 1989–2017 to identify the top causes of crop loss—as captured by total indemnity payments—for insured crops in the United States (see Olen and Wu, 2017, for a glossary of crop insurance terms). To demonstrate how relative risks can be identified for a particular crop and location, we analyze the causes and timing of crop loss for wine grapes in the Pacific region, which includes California, Oregon, and Washington. The Pacific region has the most complex cropping and weather patterns of the ten farm production regions identified by the U.S. Department of Agriculture (2000). Each state in the Pacific region produces hundreds of crops and has countless microclimates. Wine grapes are one of the top ten agricultural sales commodities for each state in the Pacific region.
We find that weather causes the lion’s share of crop loss in every year and every region in the United States: 85% of crop loss overall. Other factors include economic factors (responsible for 10% of crop loss), natural disasters (2%), biotic factors (2%), and other causes (less than 1%). Economic causes of loss have been relatively significant since the late 1990s, when revenue insurance programs were introduced to the federally subsidized crop insurance program. An upward trend in crop loss likely reflects the upward trend in liability in the crop insurance program. Widespread drought caused crop loss to peak in 2012, 2008, and 2002. The top drivers of crop loss for Pacific region wine grapes were April frost, January/April/November freeze, summer heat, and cold, wet spring weather.
Policy analysts and others with little on-the-ground experience in agriculture would do well to learn about the intra-annual timing of crop loss. In 2016, 80% of indemnity payments for insured crops in the United States were the result of weather, particularly excess moisture (40% of indemnity payments) and drought (15%) (Rain and Hail Insurance Society, 2017). Olen and Wu (2014) find that weather accounted for 90% of losses for the Pacific region from 1989 to 2012. The most frequent causes of loss in the Pacific region were frost, freeze, heat, drought, and excess moisture. Smith and Katz (2013) use a factor approach to convert insured losses into total losses and find an increasing trend in both the annual frequency of weather events that cause billion-dollar economic losses and the annual aggregate value of loss from these events over the last 30 years. For the major crops (corn, soybeans, and wheat), they partially attribute the increasing trends in insured losses to an increasing trend in crop insurance liability rather than to climate variation and change. None of these studies analyze the intra-annual timing of crop loss.
Data on indemnity payments provide the best available representation of agricultural production risk because the federally subsidized crop insurance program is the primary farm safety net program in the United States. The data used for this analysis are the Cause of Loss Historical Data Files for Indemnities with Month of Loss for 1989–2017 (U.S. Department of Agriculture, 2018a). There are 2,944,987 data points for the United States, which provide information on the causes, year, month, county, state, commodity, coverage type, and indemnity payments for all reported losses in the federal crop insurance program. The data on month of loss are for the month in which the loss occurred, not the month in which the loss was reported. There are 68,304 data points for the Pacific region, with 3,932 data points for wine grapes.
Several factors should be considered when interpreting data on the causes and timing of indemnity payments. Indemnity payments are an underestimate of crop loss for two reasons: i) some insured crop losses are too low to trigger indemnity payments and ii) some crop losses are uninsured. The second point—indemnity payments can only be received by those who have purchased insurance—is a source of selection bias that would affect the generalizability of results on the amount of crop loss (Just, Calvin, and Quiggin, 1999). This selection bias would not be an issue where crop insurance is universal, such as the Corn Belt. However, the shape of the indemnity payments distributions for various causes of loss and months of the year are likely similar for insured and uninsured producers because they are exposed to similar risks, such as summer drought. One caveat is that the data do not allow multiple causes of loss to be claimed, so the data reflect producers’ perceptions about the most important factor that caused a particular crop loss. Lastly, with this national and regional analysis, bear in mind that within a region, different circumstances may exist.
Our analysis of the data proceeds in three steps:
In this analysis, we adjust all dollar values for inflation, using 1982–1984 as the base year.

Note: All dollar values are adjusted for inflation—1982–1984
base year.
Figure 1 reports the annual distribution of indemnity payments for weather, natural disasters, economic factors, and biotic factors in the United States. There is annual variation in indemnity payments for each category of loss, but weather is the dominant cause of crop loss in every year. Economic causes of loss have been relatively significant since the late 1990s, when revenue insurance programs were introduced to the federally subsidized crop insurance program. There is an upward trend in indemnity payments over time, which likely reflects the upward trend in liability in the federally subsidized crop insurance program (Smith and Katz, 2013). Widespread drought caused indemnity payments to peak in 2012, 2008, and 2002 (National Oceanic and Atmospheric Administration, 2018).
Table 1 reports the regional distribution of indemnity payments for weather, natural disasters, economic factors, and biotic factors for the ten USDA farm production regions. Weather is the dominant cause of crop loss in every region of the United States. Economic factors were the second highest cause of loss in the Corn Belt, Great Lakes, Mountain, Northern Plains, Southern Plains, and Pacific regions. Natural disasters were the second highest cause of loss in the Appalachia, Delta, and Southeast regions. Biotic factors were the second highest cause of loss in New England. For the entire United States, weather caused 85% of crop loss, economic factors caused 10%, natural disasters and biotic factors each caused 2%, and other causes caused less than 1%. The Corn Belt, Northern Plains, and Southern Plains regions represented 64% of total U.S. crop loss but only 42% of agricultural sales in 2016 (U.S. Department of Agriculture, 2018b). The Pacific region represented 5% of total U.S. crop loss but 17% of agricultural sales in 2016. The high crop loss relative to agricultural sales in America’s Heartland—the Corn Belt, Northern Plains, and Southern Plains regions—highlights its dependency on agricultural support programs (Blank, 2018).
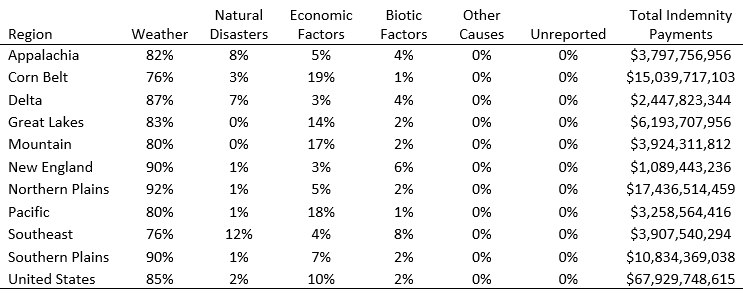
Note: All dollar values are adjusted for inflation—1982–1984 base year.
To assess relative risks for production of a specific crop, we report the distribution of indemnity payments for specific causes of crop loss and months of year for Pacific region wine grapes (Table 2). The top drivers of crop loss for Pacific region wine grapes were April frost, January/April/November freeze, summer heat, and cold, wet spring weather. Each of these monthly variables accounts for at least $5,000,000 in indemnity payments. For example, July heat accounts for $11,595,301 in indemnity payments ($40,812,990 × 28%). Indemnity payments for frost are tightly distributed, with 71% of indemnity payments occurring in April. Indemnity payments for heat are widely distributed, with 66% of indemnity payments in June, July, and August. Indemnity payments for cold, wet weather are widely distributed, with 73% of indemnity payments in April, May, and June. Indemnity payments for freeze are tightly distributed around three peaks in January, April, and November, each accounting for at least 22% of indemnity payments. These indemnity payment distributions provide insights about the probabilities of various causes of crop loss (i.e., relative risk).
These results were validated by a group of about 20 wine grape growers at the Southern Oregon Viticulture Technical Group Meeting in Jacksonville, Oregon, on June 5, 2018. Of particular interest was whether the results of the analysis for insured crop loss resonated with their experience, as only one grower had experience purchasing crop insurance for her grapes. Indeed, in southern Oregon, spring frosts cause significant damage to buds and flowers and cause fruit set failure. Freeze events that kill the entire vine are more common in eastern Washington. Heat is an on-going concern that induces water stress and sunburn in the summer. Cold, wet spring weather causes fruit set failure and disease issues. Wind machines are used to mitigate spring frost damage because surface water is not available early enough for frost protection. Surface water irrigation is used to mitigate summer heat damage. Growers were also concerned with emerging issues such as smoke taint from wildfires and red blotch disease.
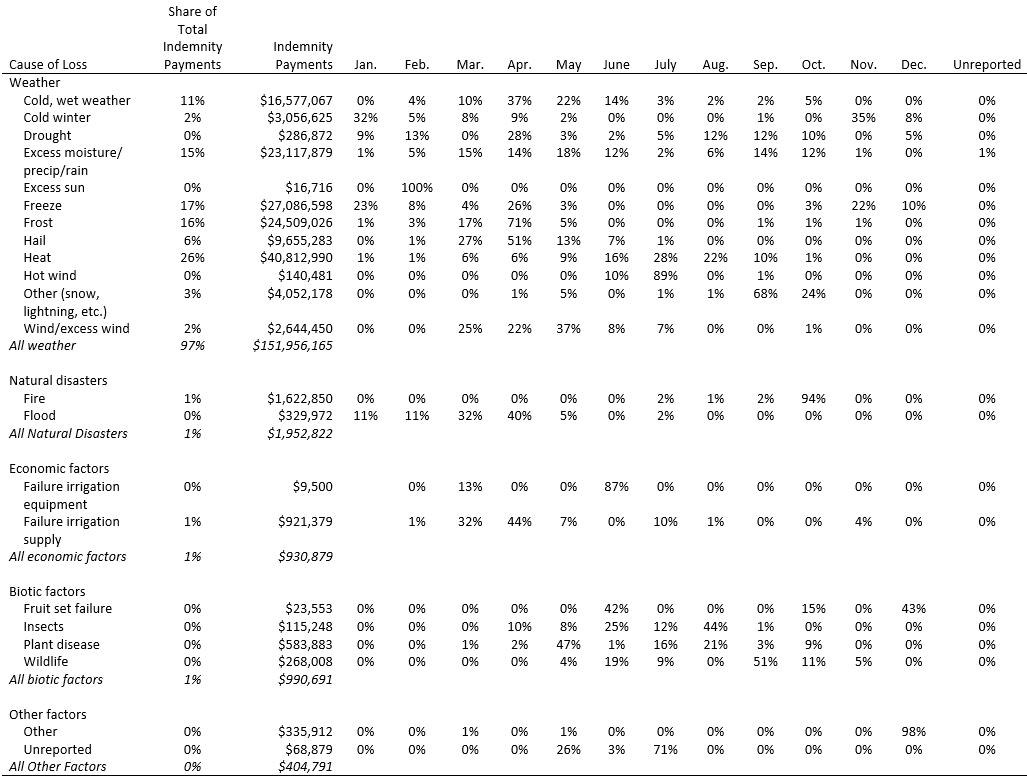
Note: All rows sum to 100%. All dollar values are adjusted for inflation—1982–1984 base year. Total indemnity payments are $156,235,348. Shares are rounded to nearest percent. Dollars are rounded to nearest dollar.
Information about relative risks in agricultural production, including the timing of those risks, is particularly useful for policy analysis in areas with complex cropping and weather patterns, where it is difficult to identify the most important weather variables affecting production. For example, Olen, Wu, and Langpap (2016) report that irrigation practices are adjusted to mitigate crop damage from frost, heat, and drought in the Pacific region, but this research did not provide insights about the timing of these adjustments. For example, did producers use irrigation to mitigate damage from spring frost or fall frost? This article provides an empirical approach for addressing this question and others regarding the most important weather variables affecting agricultural production. This approach can improve policy analysts’ ability to predict the impacts of weather on agricultural production. The Risk Management Agency’s Cause of Loss Historical Data Files for Indemnities with Month of Loss provide publicly available data to replicate the analysis in this article for any insured crop in the United States down to the county level.
Blank, S.C. 2018. "The Profit Problem of American Agriculture: What We Have Learned with the Perspective of Time." Choices 33(3): 1–7.
Just, R.E., L. Calvin, and J. Quiggin. 1999. “Adverse Selection in Crop Insurance: Actuarial and Asymmetric Information Incentives.” American Journal of Agricultural Economics 81(4):834–849.
National Oceanic and Atmospheric Administration. 2018. Billion-Dollar Weather and Climate Disasters: Table of Events. Available online: https://www.ncdc.noaa.gov/billions/events/US/1980-2018.
Olen, B., and J. Wu. 2014. “How Do Extreme Climate Events Affect Specialty Crops and Irrigation Management?” Corvallis, OR: Oregon State University, OreCal Issues Brief No. 012, February.
Olen, B., and J. Wu. 2017. "Tracking the Evolution and Recent Development in Whole Farm Insurance Programs." Choices 32(3):1–8.
Olen, B., J.J. Wu, and C. Langpap. 2016. “Irrigation Decisions for Major West Coast Crops: Water Scarcity and Climatic Determinants.” American Journal of Agricultural Economics 98(1):254–275.
Rain and Hail Insurance Society. 2017. 2017 Crop Insurance Update: Securing America’s Farmers.
Smith, A.B., and R.W. Katz. 2013. “US Billion-Dollar Weather and Climate Disasters: Data Sources, Trends, Accuracy and Biases.” Natural Hazards 67(2):387–410.
U.S. Department of Agriculture. 2000. “Farm Resource Regions.” Washington, DC: U.S. Department of Agriculture, Economic Research Service, Agricultural Information Bulletin 760, September.
U.S. Department of Agriculture. 2018a. Cause of Loss Historical Data Files. Washington, DC: U.S. Department of Agriculture, Risk Management Agency. Available online: http://www.rma.usda.gov/data/cause.html.
U.S. Department of Agriculture. 2018b. Data Files: U.S. and State-Level Farm Income and Wealth Statistics. Washington, DC: U.S. Department of Agriculture, Economic Research Service.

