Increasing the productivity of the agricultural industry remains at the forefront of minds across the public and private sectors. Advances in agricultural technologies, improved management practices, better crop genetics, and more have helped expand the per acre efficiency of U.S. crop production. For example, the amount of corn produced per harvested acre, or yield, in the United States grew from 38.2 to 152.6 bushels from 1950 to 2010. Combined with global advances in productivity, the consumer-inflation-adjusted cost of corn dropped by 66% over those 60 years.
Over the last decade, however, the rate of yield growth in crop production appears to have declined; with it, the real prices of the food we eat and feed to animals may have become more expensive than otherwise. Recognizing when patterns change is vital to the continued success of the industry. A potential technological slowdown in crop growth rates also further emphasizes the role of private and public resources in improving crop production. Understanding changes due to technological advancements helps producers make better crop choices, while consumers and storage holders can react better to changing market conditions with supply information. This study highlights how simple statistical tests can identify changes in trend yield growth more quickly than government forecasts offer. The techniques and results can be used to create more adaptable and better crop yield forecasts going forward.
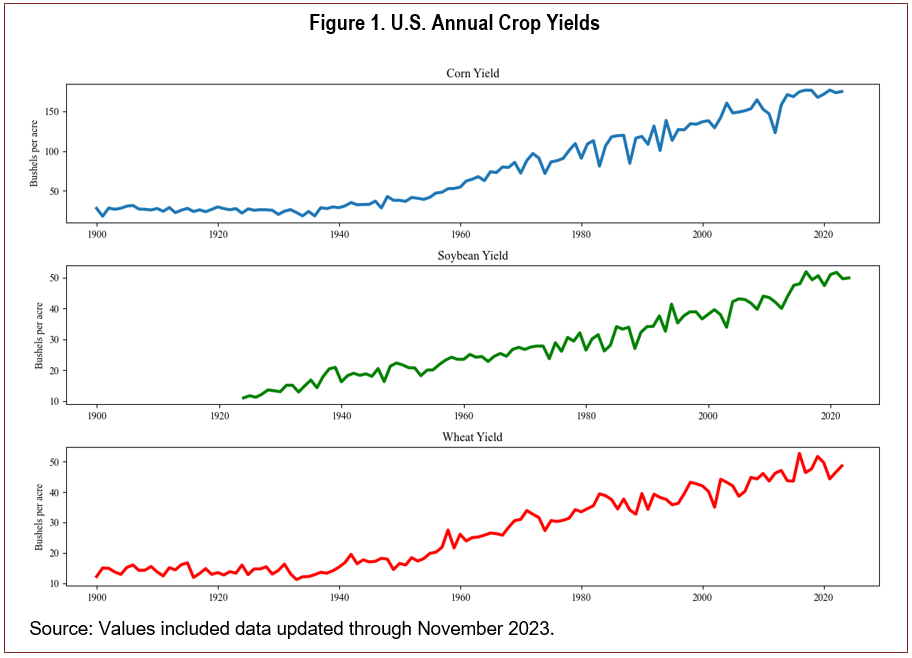
Figure 1 presents the number of bushels produced per harvested acre of corn, soybeans, and wheat since 1900, as reported by the U.S. Department of Agriculture (USDA) National Agricultural Statistics Service (NASS) through November 2023. National soybean yields are only available back to 1924. Corn, soybeans, and wheat are the three largest crops by harvested acreage in the United States, totaling 207.2 million acres in 2023. U.S. corn and wheat yield growth were relatively flat from 1900 through 1945. From 1946 to 2000, crop yields grew much faster, increasing annually at 1.9, 0.35, and 0.47more bushels per acre per year for corn, soybeans, and wheat, respectively. The trend yield growth for corn amounts to 108 pounds more production annually on every acre in the country.
While visualizations suggest trends, statistical models can be used to identify, measure, and forecast yields going forward. The simplest but often most effective method for quantifying yield growth trends is linear trend models, where the only explanatory variable is an annual step variable (e.g., 2010, 2011, 2012, ….). Linear trend models underpin those used by public sources, specifically the USDA’s yield forecasts for the start of each year in the World Agricultural Supply and Demand Estimates (WASDE) and the USDA’s Long-Term Agricultural Projections, as well as the Congressional Budget Office (CBO). The USDA’s public forecasts are frequently considered the standard barometer for future production estimates. Westcott and Jewison (2013) detail the methods behind the USDA’s corn yield trend forecasts. While Westcott and Jewison only explain the methods behind the U.S. corn yield forecasts, similar models can be inferred from the forecasts for other crops.
A potential slowdown in yield growth is hidden in these impressive long-run trends, depicted in Figure 1. One of the first tools in an econometrician or statistician’s toolbox when dealing with data recorded over time is to evaluate changes in trends through what are called structural break tests. These tests instruct the analyst which data to include in the estimation and which data to omit. In this instance, structural break tests evaluate how far back a linear trend should be estimated. Intuitively, including crop yields from 1900 will show different trend estimates than if we only include data back to 1945. Statistical tests formalize and remove some subjectiveness in selecting how far back in history we should look.
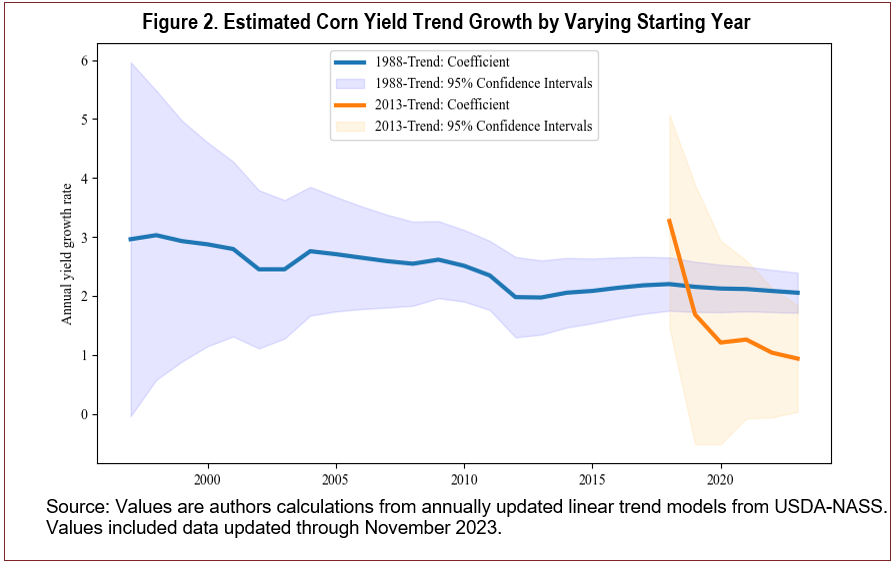
Figure 2 shows what amounts to a visualization of a structural break test for estimating trend corn yield over time. The concept of the figure is to examine how trend estimates compare when using different sample lengths and to mimic what learning looks like with the realization of new crop yield data each year. The figure below depicts the estimated annual trend growth using starting points of 1988 and 2013. Each observation along each line includes a new estimate for trend yield growth given another year of data. The figure shows that the 1988-trend and 2013-trend lines appear to be declining with each new observation, a sign of a decline in productivity growth, as each new data point lowers the average growth rate over the sample.
These two trend estimation samples were chosen based on that used by the USDA (1988-trend) and based on a Zivot–Andrews (2002) structural break test to define how far back we should look to estimate current trends. Figure 2 also shows that as far back as 2019, the 2013-trend was statistically lower (1.68 bushels/year) than the 1988-trend (2.15 bushels/year). After realizing yields in the last four crop years, the 2013-trend is becoming statistically more confident and divergent with each year of new data from the 1988-trend. With each passing year, the evidence grows for revising USDA yield forecasts to a model based on the 2013-trend.
Source: Values are author’s calculations based on
USDA-NASS data, which included data updated through
November 2023.
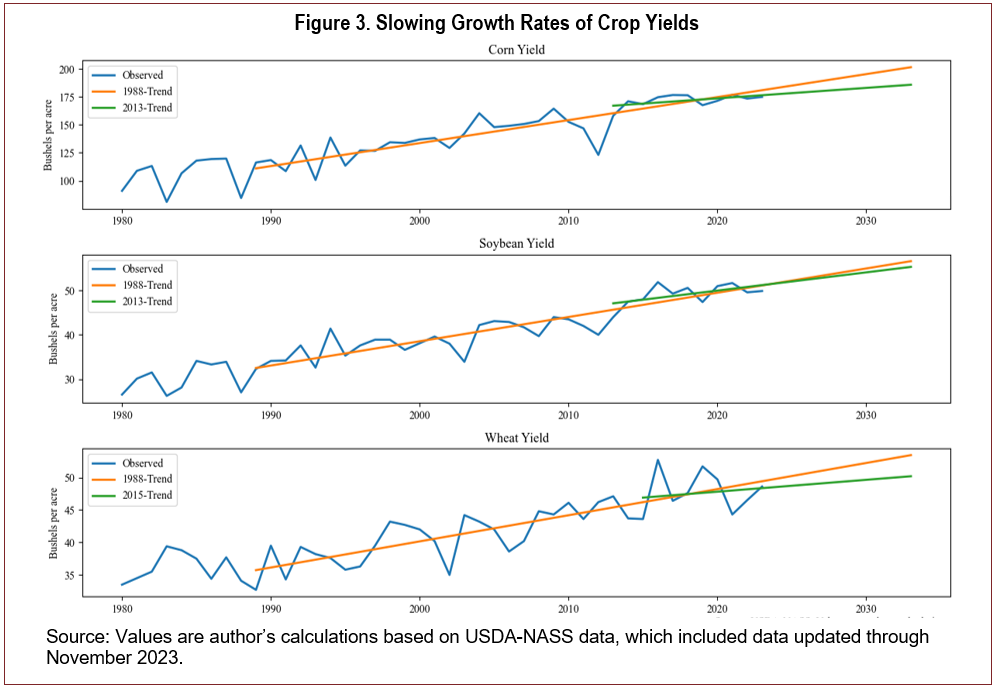
Figure 3 visualizes yield forecasts based on trends going back to 1988 and trends based on the result of structural break tests for U.S. corn, soybean, and wheat yields. Corn and soybean yield trend estimates include data from 2013 onward, while wheat yield estimates include data from 2015 onward. Each linear trend is extended 10 years into the future, as frequently done for budgetary reasons by the USDA and CBO projections. The difference in the forecast for 2033 corn, soybeans, and wheat yield is 7.8% (15.7 bushels), 2.3% (1.3 bushels), and 6.1% (3.3 bushels) lower, respectively than if the 1988 yield trend persisted. Translating the production declines to corn prices alone and assuming a generalizable elasticity of demand equal to -0.5, the reduction in growth rates will cause corn prices to be 15.5% higher than if the 1988-trend continued.
The linear estimates from 1988-trends effectively match the latest USDA forecasts (USDA, 2023). The USDA forecast for yield growth rates has stayed the same since at least 2019, as evidenced by comparing trend growth assumptions between the 2019 and 2023 projections (USDA-ERS, 2023). As shown in figure 3, if models were updated only to include data consistent with standard econometric procedures, yield forecast growth would be substantially reduced. For corn and wheat, the 2013-trend estimates reduce trend yield growth by over 50% relative to what the USDA predicts.
The statistical evidence of a productivity slowdown in crop yield growth builds each year. The linear yield growth trends since 2013 for corn, soybeans, and wheat are all statistically lower than one starting in 1988. Models, forecasts, market participants, and policy makers should consider that yields in the future will probably be lower than forecasted by the USDA and that extrapolating trends into the future without revision is problematic.
Eleven years of evidence might be preemptive to suggest U.S. yield productivity is no longer gaining at rates that go back to the post–World War II era. However, there could be many reasons for this decline in productivity growth; not all are necessarily bad. Farmers could be becoming more resource-efficient and applying relatively fewer inputs, as these would not be captured in basic per acre production totals. Fewer resource inputs with similar yields meet the ambitions of farmers and environmentalists alike. It could also be caused by changes in crop genetics toward greater drought tolerance (McFadden et al., 2019). Reduced year–year variability might come at the expense of average yield.
The slowdown in yield growth could also be due to changes in measurement at the USDA. The technologies to measure national and field-level yields have changed dramatically over the last 20 years. The difficulty in measuring national aggregate crop yields is deeply underestimated. Arslan and Colvin (2002) measured differences in average error in yield estimated between tractor-mounted yield sensors and scale-measured weights to be between 3.4% and 5.2%. Scaling that error rate to 180 bushels/acre production, the error range at the field level is between 6.12 and 9.36 bushels per acre. The average absolute yield change nationally from year to year for the last 20 years is 8.46, well within that error range. The variability of national yields from year to year is seemingly narrow compared to field-level measurement errors. Large national samples can help reduce the error in the national estimate, assuming errors are mean 0 and uncorrelated nationally. However, the factors influencing bias at the field level (moisture) are also frequently correlated across farms. Add in the challenge of measurement error of production across over 89 million harvested acres for corn alone, and it becomes a challenging question that statisticians must continually adapt to.
Unfortunately, the decline in productivity could also be a long time coming. This is because when we look at national yields, we miss out on the underlying trends at the producer level. This is something that macroeconomists can attest to. For instance, if some farmers adopt yield-boosting technology before others, national yields will appear to increase gradually every year when, in reality, the benefit is dichotomous. This may make it seem like there is a slow but steady growth in productivity rather than a clear distinction between those who have and have yet to adopt new technology. As fewer and fewer producers can adopt the now-old technology, the rate of productivity increase slows down. Yields might be tapped out because the underlying cause of yield growth occurred years ago. We could just be realizing this scenario now in aggregate data. Climate change is another possible reason for yield productivity growth to have slowed down, as noted by Kang, Khan, and Ma (2009). Whatever its causes, the consequences of a reduction in productivity growth are higher prices going forward. However, by updating our forecasting models to this new trend, we can better plan and adapt to market outcomes as events unfold over time.

