Jim Barksdale, former Netscape CEO, recently said, “If we have data, let’s look at data. If all we have are opinions, let’s go with mine.” And so, “big data” comes of age. Increasingly, businesses are using data for precision marketing, politicians are using data to shape campaigns, and government agencies are using data to remain effective in the face of budget reductions.
The Natural Resources Conservation Service (NRCS) has a long history of collecting data and assessing the impact of conservation practices and land use on the environment in an effort to maximize, to the extent practical, the beneficial effects of conservation programs—given policy, political, and funding limitations. That tradition of letting data help drive program policy is being enhanced by changes in the National Resources Inventory (NRI) program and the roll-out of data and analyses from the Conservation Effects Assessment Project (CEAP).
The critical issue is gathering that data that has validity for the purposes at hand. In the past, data have been gathered for a range of purposes. Sometimes this has been to justify past programs and current expenditure. Primary needs today include the setting of conservation goals, improving program design, targeting program funding, assessing program performance, and enabling adaptive management. Another critical issue is the choice of metric for such data, because we respond to what we measure. This paper assesses the importance of committing funds to continue natural resource data collection, as well as its analysis, in order to inform program policy making and to assess program performance. It also argues that as conservation program budgets shrink, policy makers must increase their use of data and analyses to help create more effective programs.
From its inception, the NRCS, and its predecessor, the Soil Conservation Service (SCS), have collected natural resource data to plan conservation work at scales from the individual farm conservation plan to the strategic plan for the agency. Inventorying and analysis to support policies, planning, and operations has evolved over time in response to the technology available and methodological advances allowing such data collection.
Hugh Hammond Bennett, founder of NRCS, made observations and inventories that influenced both law and policy. As an employee of the Bureau of Soils in USDA, he began including information about soil erosion in his soil surveys. In the later part of the 1920s, he had an opportunity to make a survey of soil erosion problem areas. This information was used to select locations for soil erosion experiment stations that were authorized in the 1929 USDA appropriations and soon afterward it was used to select watersheds for erosion control demonstration projects.
In the fall of 1934, the Soil Erosion Service carried out a two-month national reconnaissance erosion survey in which 115 specialists visited every county in the United States. The resulting maps and data were used to select additional demonstration project areas. The reconnaissance survey established the national extent of the problem and the need to make the infant soil conservation program a permanent part of government assistance to farmers.
Studies conducted during World War II led to the publication of the Soil and Water Conservation Needs Estimates for the United States in 1945. These studies were undertaken to help the SCS establish priorities for the conservation work by the diminished field staff during the war. The document was also helpful for post-war planning and allocation of SCS resources. The experience of the first post-war decade was that there was more demand for conservation assistance than SCS could meet. The 1945 study tabulated, by state, the acreage of land in each land capability class. Furthermore, it enumerated, by state, the conservation practices that needed to be installed.
The succeeding Conservation Needs Inventories issued by SCS in 1958 and 1967 differed most significantly from the 1945 inventory in that they, and future inventories, were based on statistically sampled plots. They also began to include more about the resource base and the data collected included land capability class and subclass, and land use as well as conservation treatments needed and locations needing assistance from the Watershed and Flood Prevention Act.
The inventorying trend continued with the Rural Development Act of 1972. Rather than concentrating on the conservation treatments needed, SCS was now directed to inventory and monitor changes in erosion and sediment damage, land use changes and trends, and other degradation of the environment resulting from improper use of soil, water, and related resources.
National Resources Inventory (NRI) data were used in the studies directed by the Soil and Water Resources Conservation Act of 1977 to formulate conservation programs. Indeed, the availability of the inventory data and resulting analysis impacted the farm bills of 1981 and 1985. The 1981 farm bill included some emphasis on targeting resources to problem areas, although the program was never fully implemented. The inventories identified soil erosion as a priority which had a profound influence on the Food Security Act of 1985 with the inclusion of the conservation compliance provision. This provision was part of the farm bill debate for 2013.
The NRI provides updated information on the status, condition, and trends of land, soil, water, and related resources on the Nation’s non-Federal lands. Inventories have been conducted in 1977, 1982, 1987, 1992, 1997, 2002, 2007 and 2012. The NRI survey framework has been used to conduct special-issue inventories for high profile issues such as wetland conversion and the attrition of structural conservation practices such as terraces, waterways, and buffer strips. For the last decade, the NRI sampling framework has been used in CEAP’s national and regional assessments. Information from the NRI has been used by NRCS to strengthen its strategic planning and accountability efforts; to provide input into farm bill policy development; and to support the 1999 National Hypoxia Assessment carried out by the National Oceanic and Atmospheric Administration.
As the public investment in the suite of USDA conservation programs increased in the 1990, 1996, and 2002 farm bills, the interest in justifying these expenditures as well as improving the management of that investment in order to achieve the greatest environmental benefit also increased. Reflecting this interest, the Managers Report for the 2002 Farm Bill directed the Secretary of Agriculture to commit $10 million per year to assess conservation programs. This directive resulted in the implementation of CEAP. The project was designed to have three major components. The first is an assessment of the current state of science related to the environmental benefits of conservation practices at the field and watershed scales. Second, CEAP includes 39 watershed assessment studies that employ monitoring to evaluate the effectiveness of conservation practices. Third, CEAP is continuing to undertake national and regional assessments, in part to estimate the regional and national effects of conservation practices and, in part, to estimate conservation needs. The national and regional assessments focused on four areas: cropland, wetlands, grazing land, and wildlife habitat. Although a number of USDA and other agencies were involved, the effort was led by USDA’s NRCS; USDA’s Agricultural Research Service; and USDA’s National Institute of Food and Agriculture (formerly known as the Cooperative State Research, Education, and Extension Service).
CEAP was designed to integrate monitoring, data collection, and modeling. In addition, it was designed to leverage the power of the NRI sampling framework to collect data for the national and regional assessments. CEAP is expanding NRI data collection to include detailed data related to production and conservation on cropland and grazing land as well as data related to wetlands and wildlife habitat health. Data collected on wetlands, for example, will be used to model the functions and values of specific wetlands over time. This will give policy makers, program managers, field staff, and producers a sense of not only the changing scope of wetland acreage, but also changes in the inherent value of wetlands. Shortly after CEAP began, USDA engaged a Blue Ribbon Panel to review CEAP. The report of the panel resulted in some reorientation of the CEAP objectives and efforts so that it would be more forward looking with more emphasis on solving problems rather than estimating effects. In addition, the panel recommended that CEAP place greater emphasis on monitoring to get valid data for simulation or extrapolation and have more emphasis on the role of CEAP to inform strategic resource management (CEAP Blue Ribbon Panel, 2006).
The cropland assessment is the most advanced of the four regional and national assessments to date. Data collected from 2003 to 2006 on the production and conservation practices employed by farmers has been processed through an edge-of-field model that uses actual weather data and detailed soils data to simulate crop growth, on a daily time step, and estimate a wide range of environmental impacts including soil loss, nutrient loss, pesticide loss, and soil carbon changes. The edge-of-field model output is processed through small watershed and river basin scale models that are calibrated to fall within the confidence limits of stream gauge data.
In June 2010, the Upper Mississippi River Basin regional cropland assessment was released and it is being used to help set goals for the Mississippi River Basin Initiative. Since the Upper Mississippi River Basin CEAP cropland report was released, regional assessments for the Ohio-Tennessee River Basin, the Missouri River Basin, the Great Lakes Water Resource Region, and the Chesapeake Bay have been released. Preliminary results for the entire country were used extensively in the development of the Resource Conservation Act Appraisal, which was transmitted to Congress in 2011.
During the development of the 2008 farm bill, NRI data were used to inform the decision to reduce the Conservation Reserve Program (CRP) acreage cap. The NRI data showed that there were millions of acres enrolled in CRP that were classified as highly productive cropland and with the adoption of targeted conservation practices could be farmed with limited environmental impact. This has resulted in a more informed discussion of the appropriate size of the CRP and the decision to reduce its size to some extent.
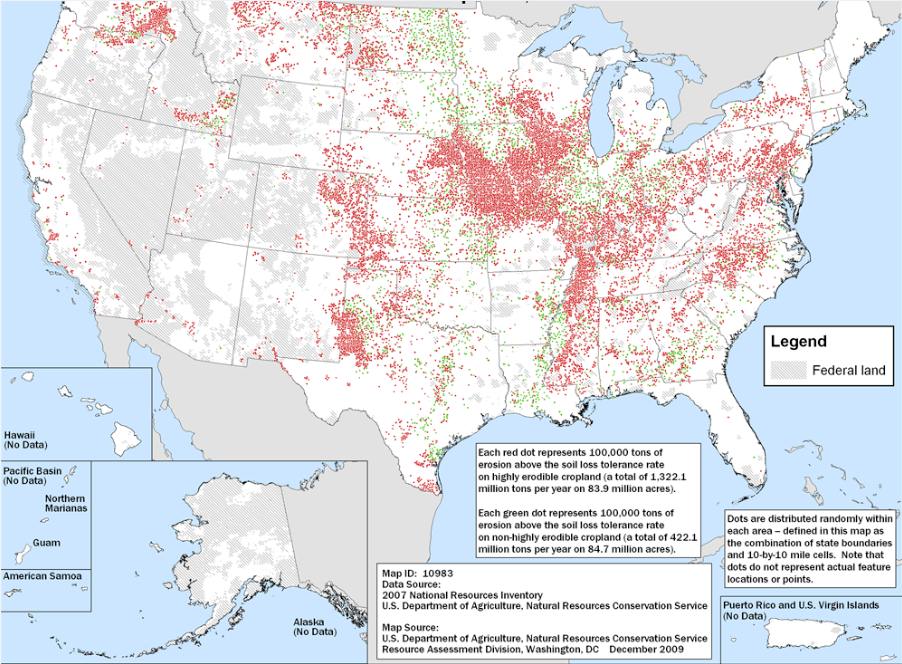
Arguably one of the most important environmental indicators related to cropland is the erosion rate. The NRI now provides, among other things, detailed erosion information from 1982 through 2007 (the 2012 NRI results will be released in late 2013). NRI is unique because it is a longitudinal dataset that resamples the same sample points over a five-year cycle. Figures 1 and 2, generated with NRI data, indicate that, since 1982, the extent of acres with erosion rates that exceed their “allowable” rate has dropped significantly.
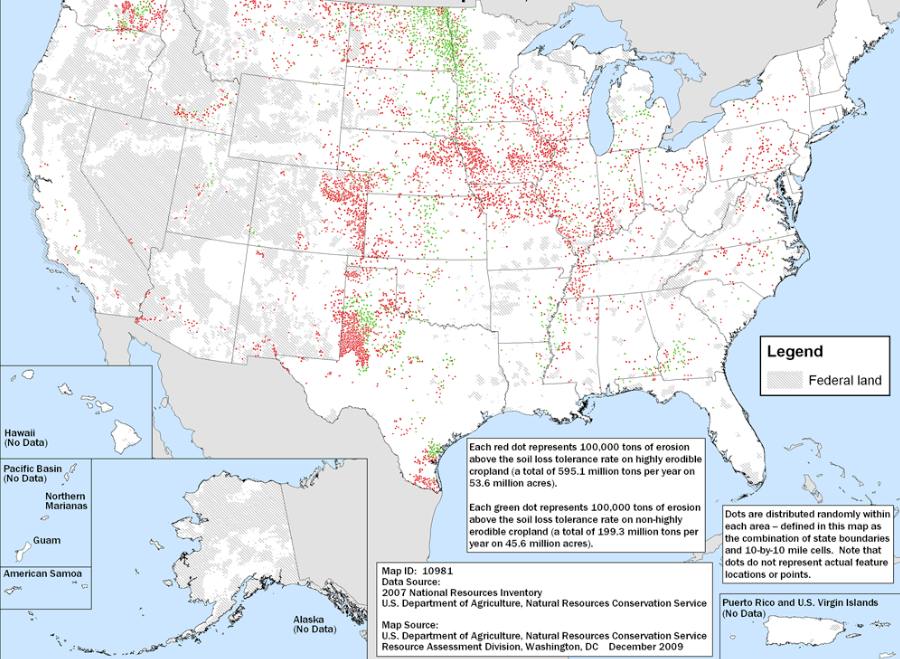
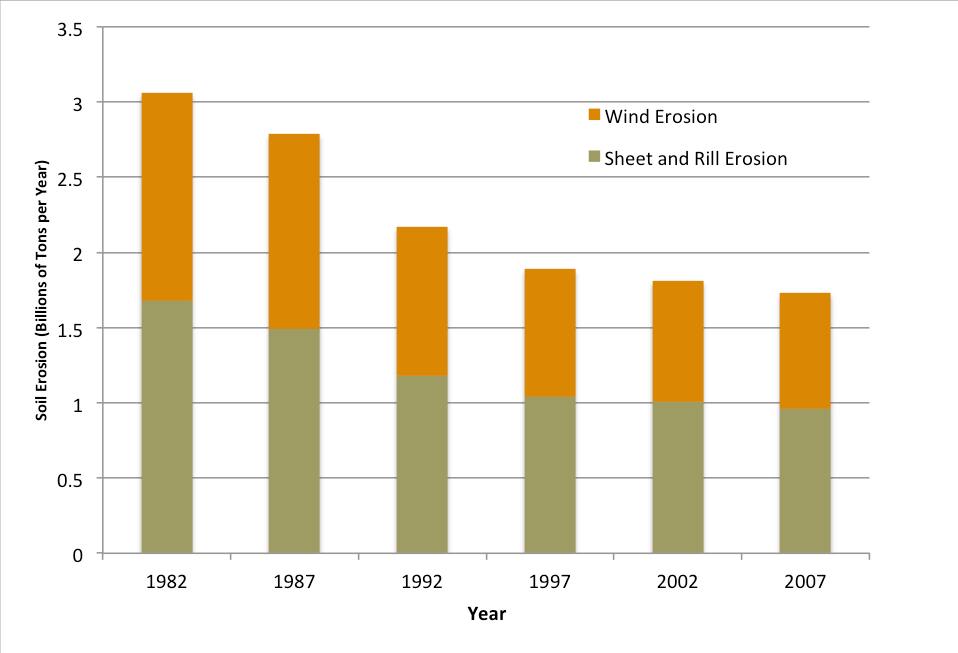
Figure 3 is a graph of the average erosion rate on cropland, over time, and provides evidence of how well the conservation compliance provision of the 1985 Farm Bill incentivized farmers to reduce erosion rates. The total wind and water erosion on US cropland has dropped from 3.06 Billion tons per year in 1982 to 1.73 billion tons per year in 2007, a 44% reduction. This success, as demonstrated with NRI data, is one reason that conservation organizations have recently motivated a discussion about extending conservation compliance to crop insurance in the 2013 Farm Bill.
The NRI data also reveal where additional effort should be targeted to achieve further reductions in erosion rates. For example, there are over 50 million acres of highly erodible land that exceed the allowable erosion rate. Focusing on the highly erodible land that exceeds the allowable erosion rate could reduce annual erosion on cropland by 600 million tons. Not only would targeting these lands reduce sediment loads, it would also reduce the surface run-off of agricultural chemicals. As the CEAP cropland models gain wider use, it should be possible to enrich targeting by assessing the potential off-site effects of agricultural run-off.
What the CEAP results add are specificity and focus to the NRI data to make them much more useful. CEAP is also enhancing our understanding of agricultural run-off through the watershed projects, which are providing long-term, specific watershed data.
Perhaps the best example of CEAP helping to inform decision making is the CEAP cropland assessment of the Chesapeake Bay. Released in early 2011, the assessment provided input to help target NRCS conservation program funding. Interest in the assessment was strong enough to have NRCS invest in a second survey of farming and conservation practices that was completed in 2012. The data collected will be used in the suite of CEAP cropland models to develop a second assessment that will be used by policy makers to further increase the effectiveness of NRCS and other agency conservation programs.
Metrics in data collection and use remain thorny issues. We respond to what we measure and we do what we measure. One truth is that there is seldom a single “correct” metric for a complex problem and most of the conservation problems we face are highly complex, involving many concerns, stakeholders, and disciplines. A good example of the metrics problem relates to the Chesapeake Bay. A recent study looked at the costs and benefits of reducing excess nitrogen flows into the bay using two metrics--tons of nutrients, on the one hand, and dollars, on the other (Birch et al., 2011). If the metric was tons of nitrogen, efforts might best be continued to further restrict non-point nitrogen coming off the land surrounding the bay. If the metric was dollars, atmospheric nitrogen reduction would be less costly and have a much higher dollar payback in terms of increased health benefits. The “answer” to this dilemma is not which metric is “best,” but to recognize that different metrics serve different purposes, and decision-makers in such situations need to look at more than one metric.
In the era of big data, the collection, analysis, and use of natural resource data is becoming more important, especially in light of the increased complexity of natural resource problems faced by farmers and the current budget climate. NRI and CEAP have made progress in providing data that are critical to both backward- and forward-looking assessments. However, data collection is not an end in and of itself. Good data depend on the willingness to do the monitoring necessary for their collection and validation. Only then are the data useful for assessment and as an input to modeling. For data collection to be sustained (and thus be more useful), the data must have interested users who support the resources necessary for their collection. Expansion of NRI data users is, in part, dependent on NRCS developing new ways to share NRI data while ensuring that the data are not misused and the sample point locations are not disclosed. In addition, there are real tensions in large data collection efforts. For example, in the collection of soil erosion data, one deals with both the need to have the “right” data for local program management and assessment as well as the national need for data to support the design of a national program and the need to gain political support for that program.
With environmental and natural resources data, we are dealing with biophysical processes where there can be long lags in cause and effect observations. Assignment of causality is much more difficult which is why the long-term CEAP watershed studies are critical compliments to a more dispersed database like the NRI. This underscores the need for data collection for environmental and natural resource concerns to be an ongoing, long-term effort.
Looking forward, conservation will have to incorporate long-term, adaptive management efforts. This will be especially critical for agriculture and forestry as climate change impacts continue whatever course they take. It will be impossible to engage in adaptive management without data collection. We also have to determine the nature of the critical data that must continue to be collected and what the several appropriate metrics should be.
Birch, M.B., Gramig, B. M., Moomaw, W. R., Doering, O.C., and Reeling, C. J. (2011). Why metrics matter: Evaluating policy choices for reactive nitrogen in the Chesapeake Bay watershed. Environmental Science and Technology, 45(1), 168-174.
CEAP Blue Ribbon Panel. (2006). Final Report from the blue ribbon panel conducting an external review of the U.S. Department of Agriculture Conservation Effects Assessment Project. Ankeny, IA: Soil and Water Conservation Society. Available online: http://www.swcs.org/en/publications/blue_ribbon_panel_conducting _a_review_of_ceap/
Duriancik, L. F., Dobrowolski, J., P., Drews, T., Eckles, S. D., Jolley, L., Kellogg, R. L., Lund, D., Makuch, J. R., O’Neill, M. P., Rewa, C. A., Walbridge, M. R., Parry, R., and Weltz, M. A. (2008). The first five years of the Conservation Effects Assessment Project. Journal of Soil and Water Conservation, 63(6), 185A-197A. Available online: http://www.nrcs.usda.gov/Internet/FSE_DOCUMENTS/nrcs143_013343.pdf.
Goebel, J. J. (1998). The National Resources Inventory and its role in U.S. agriculture. Proceedings: An International Conference on Agricultural Statistics. 181-192. Available online: http://www.nass.usda.gov/as2000/proceedings/page-181.pdf.
U.S. Department of Agriculture. (2011). RCA Appraisal: Soil and water resources conservation act. Available online: http://www.nrcs.usda.gov/Internet/FSE_DOCUMENTS/stelprdb1044939.pdf.

