Nitrogen fertilizer is a critical input into crop production and, hence, food supply systems. The United States uses approximately 12 million tons of nitrogen fertilizer, 4 million tons of phosphate, and 4 million tons of potash annually (Dutkowsky, Brester, and Smith, 2014). Corn, wheat, cotton, and soybean production represent 60% of all fertilizer use, with corn accounting for 50% of all nitrogen use.
In the late 2000s, the U.S. nitrogen fertilizer industry began expanding capacity after four decades of contraction as increased fertilizer demand and low natural gas prices increased nitrogen fertilizer production profitability. Ammonia is the basic building block of all nitrogen fertilizer products. An additional 12 ammonia plants have been built since 2008—the year in which the historically lowest number of plants were in operation. Between 2013 and 2018 alone, six plants came online and seven plants expanded, representing 3.14 million metric tons of new nitrogen fertilizer production capacity (Brown, 2018). This resurgence characterizes a classic example of firms responding to profit opportunities and entry into commodity markets.
However, despite this growth, the realized expansion was only a portion of total announced construction. Between 2013 and 2018, a total of 31 new or expanded plants with 6.9 million metric tons of additional capacity were announced with much fanfare and publicity. Yet only 13 projects were realized and less than half of the announced new capacity added. While these additions are still substantial, perplexing questions remain: Why were such grandiose plans made public and why were so few actually completed?
The answers are not immediately clear, not in small part because the U.S. fertilizer industry has become relatively concentrated. This has restricted data availability and firm information for assessing industry dynamics. However, the industry structure provides some clues as to why announced capacity expansions may not have been realized. Understanding why large firms within a concentrated industry make capacity expansion announcement—which are often not acted upon—is important for recognizing the future path of the U.S. fertilizer production sector and the supply-side component of domestic nitrogen fertilizer production.
Indications of capacity expansion are made in a number of forms, but all are publicly available. In the past decade, nearly half of all expansions were “announced” through Environmental Protection Agency air permit forms and through the Securities and Exchange Commission’s 10-K financial performance forms (Brown, 2018). Other announcements are made in firms’ annual report presentations and publications, company press releases and news reports, and air quality reports (Brown, 2018).
Table 1 shows actual and announced capacity of the U.S. nitrogen fertilizer industry for the periods 2013–2018 and 2019–2024. For the 2013–2018 period, the table shows the number of ammonia plants operating in 2013 (as well as the total nitrogen fertilizer production capacity of those plants), the number and production capacity of announced and completed new facilities or expansions of existing facilities during the period, and the number and capacity of new and expansion projects that were announced but eventually rescinded. A total of 31 capacity expansion announcements were made during 2013–2018; if all had been completed, these plants would have increased total nitrogen fertilizer production capacity by 6.9 million metric tons (a 95% increase). However, less than half of the capacity announcements were realized. Of the 31 announcements, 68% were announced by established firms.
| Operational, 2013 | Completed Projects, 2013-2018 | Announced but Failed Projects, 2013-2018 | |||
| New Facilities | Expansions | New Firms | Existing Firms | ||
| Number of plants | 28 | 6 | 7 | 11 | 7 |
| New potential capacity | - | 1,490,913 | 1,651,958 | 1,934,249 | 1,825,864 |
| Total and potential U.S. capacity | 7,282,343 | 10,425,214 | 14,185,327 | ||
| Operational, 2018 | Announced Expansions, 2019-2024 | Announced New Facilities, 2019-2024 | |||
| New Firms | Existing Firms | ||||
| Number of plants | 34 | 2 | 14 | 2 | |
| New potential capacity | - | 132,299 | 4,178,567 | 896,213 | |
| Total and potential U.S. capacity | 10,425,214 | 10,557,513 | 15,632,293 | ||
Additionally, during the 2013–2018 period, the median plant expansion capacity totaled 294,165 metric tons. Of the completed expansion projects, nearly 54% was by the largest four firms (CF Industries, DynoNobel, PotashCorp, and Koch Industries), which represented approximately 75% of total capacity in 2013 (Table 2). For plants that were announced and not constructed, the average capacity was 90,138 metric tons, and 13 of the 18 failed projects were by firms that had no U.S. market share in 2013. Given the degree of market consolidation between 1970 and 2010, expansion dynamics may have been influenced by the consolidated market structure. That is, firms following through on expansion announcements were those that were more likely able to facilitate the construction of larger facilities and those that already had substantial market shares.
| Company | Number of Plants | Annual Production Capacity (tons ammonia) | Percentage of U.S. Production |
| CF | 5 | 7,793,070 | 44.52% |
| Koch | 4 | 2,088,620 | 11.93% |
| PotashCorp | 3 | 2,160,574 | 12.34% |
| DynoNobel | 3 | 1,219,946 | 7.00% |
| Total Top 4 | 15 | 13,262,210 | 75.79% |
| Total U.S. | 28 | 17,503,281 | 100.00% |
Table 1 also shows expansion and new ammonia facility announcements for 2019–2024. Most expansion announcements—17 of 19—are in the form of new facilities. This suggests that a different set of factors may have influenced expansion in the 2019–2024 period relative to the 2013–2018 period. The data in Table 1 suggest that existing brownfield ammonia and nitrogen fertilizer production infrastructure in the United States has likely reached its upper bound, limiting the extent to which existing plants can expand. Rather, new capacity would probably be the result of greenfield facility construction.
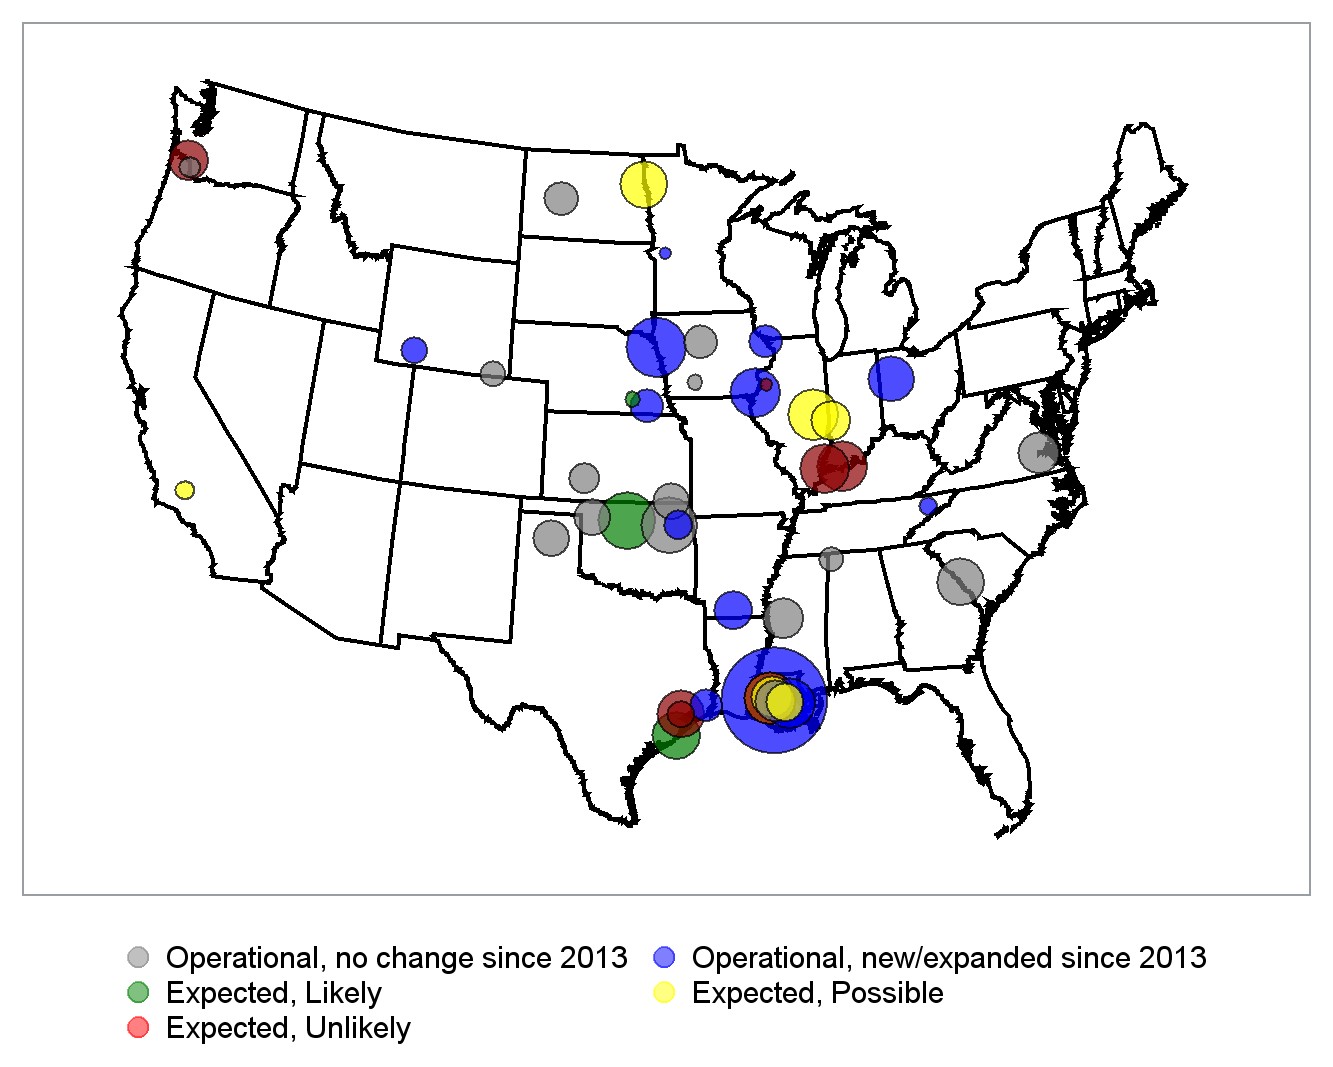
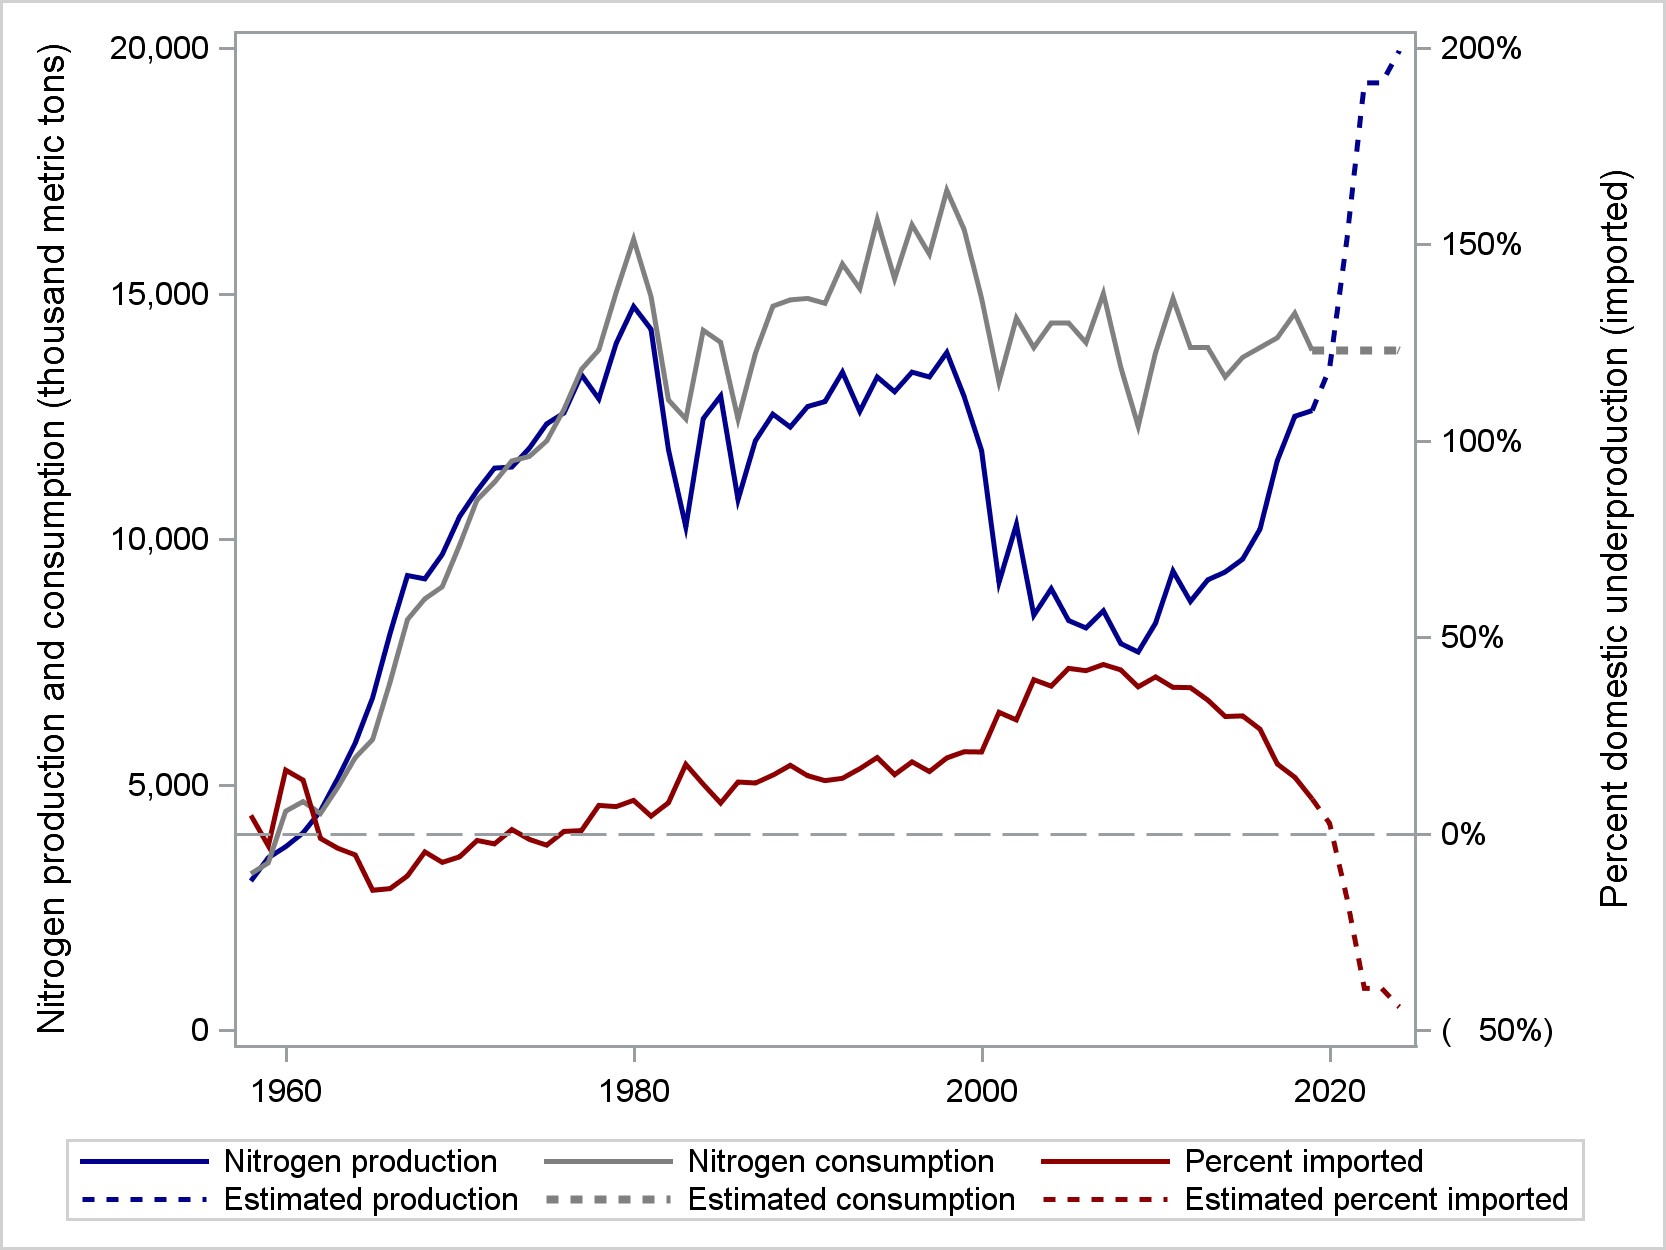
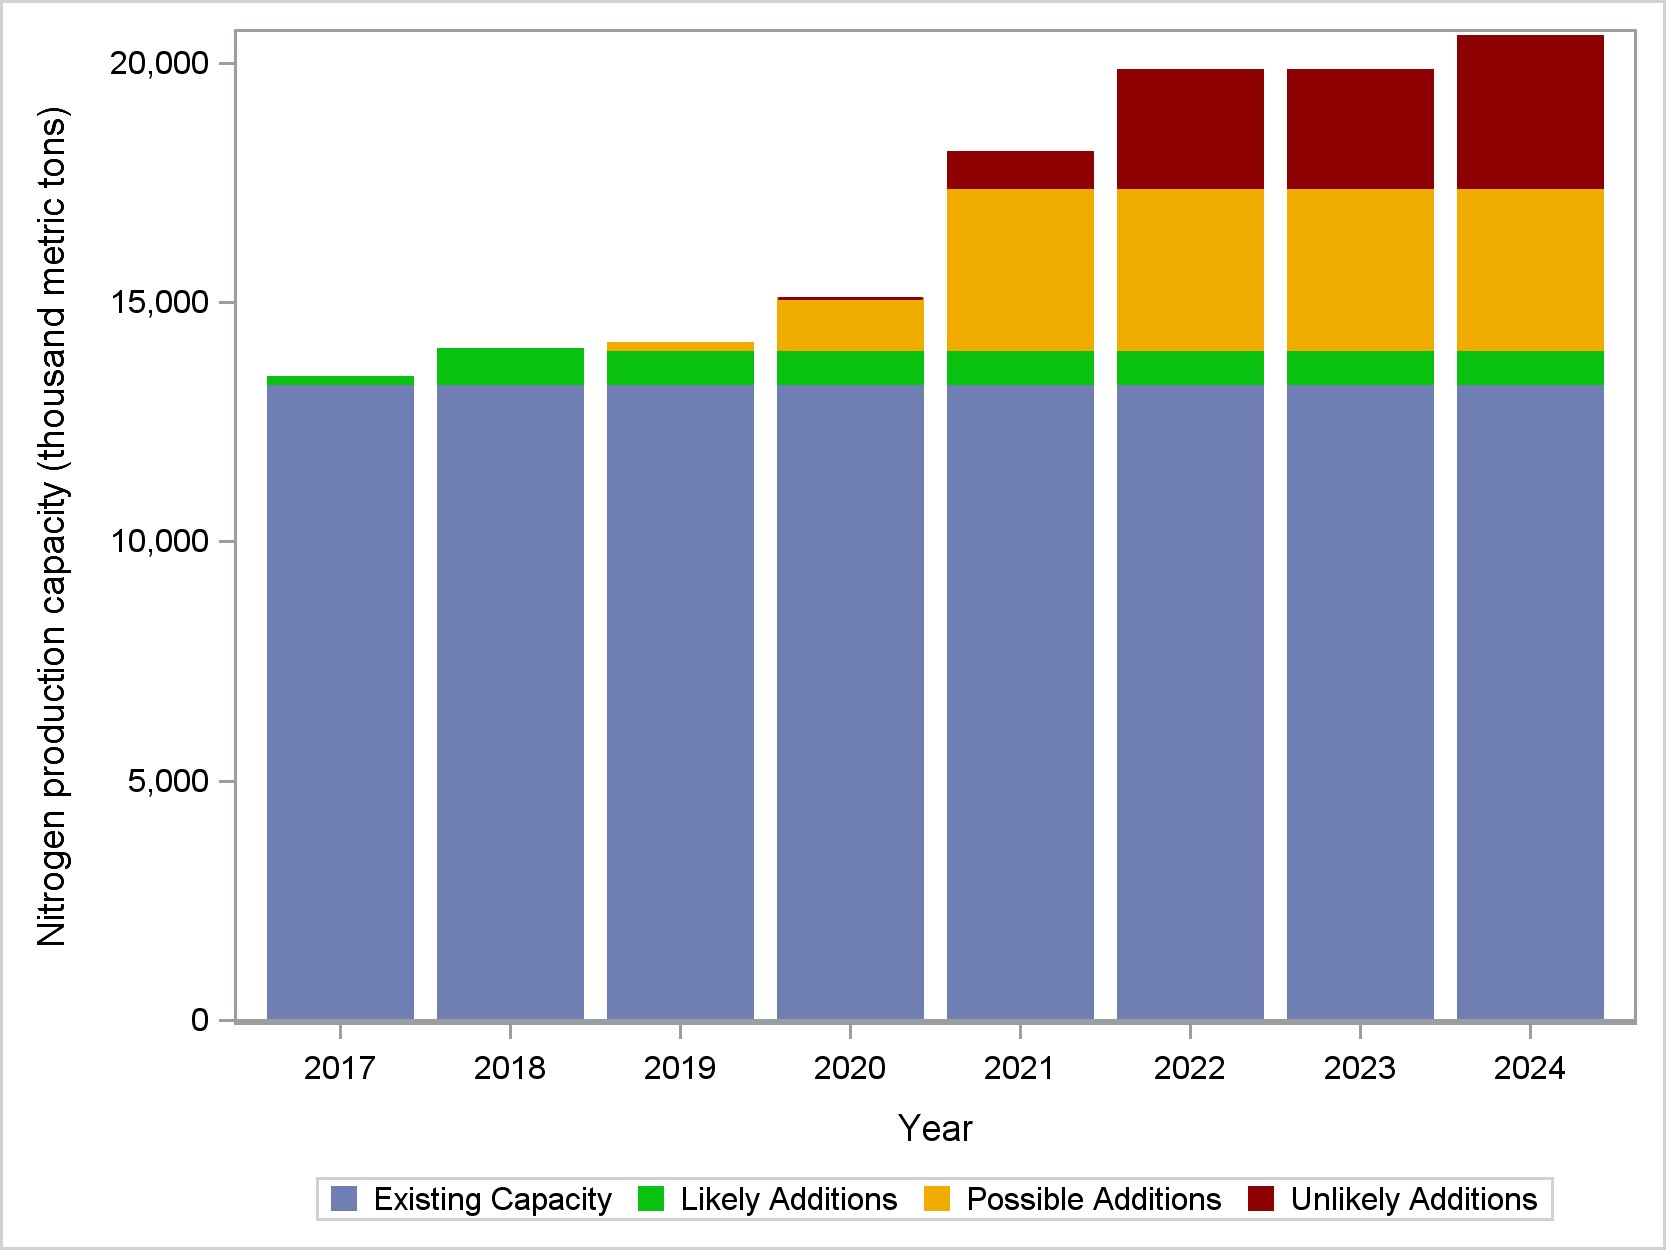
Figure 1 shows the geographic distribution of existing ammonia facilities in North America, completed new and expanded facilities between 2013 and 2018, and announced new facilities and expansions during the 2019–2024 period. Each circle indicates the location of a facility, with the size of each representing production capacity and color representing the status of each plant (i.e., existing, completed new or expansion project, and announced project by likelihood). Most of the completed and announced expansion capacities occur in areas with existing infrastructure, such as near Gulf of Mexico ports and along the Missouri and Mississippi Rivers—all of which are near major natural gas deposits or pipelines and provide for accessible water-based transportation. Many announced expansions are also located at or near these locations, although several clusters of new plants are along the Ohio River, in the Pacific Northwest, and in California.
The data in Table 1 and Figure 2 indicate that, U.S. nitrogen production capacity would expand by nearly 70% between 2019 and 2024 if all announced expansions and new facilities were realized. This would represent a 142% increase relative to production capacity in 2013. Figure 2 shows how this expansion would change the U.S. nitrogen fertilizer industry. The dashed lines for U.S. nitrogen consumption, production, and net imports represent the projected levels of these three variables between 2019 and 2024. The projected consumption data represent average annual domestic nitrogen fertilizer consumption between 2009 and 2018, projected domestic production represents the annual additional U.S. nitrogen output based on announcements, and projected net imports are the difference between projected consumption and production. The figure shows that if all of the announced expansions and new facilities were completed, the United States would become a major nitrogen fertilizer exporter, exporting nearly 50% of its annual production by 2024.
While such large additional expansions could certainly occur, a number of factors place the credibility of this happening in question. First, there may not be sufficient global capacity or demand for large additional exports from the United States. Global consumption of nitrogen fertilizer has remained relatively stable, with net trade ranging between 10 million and 16 million metric tons since the mid-1980s (U.S. Geological Survey, 2019). Adding 5–7 million metric tons to the global market in the next five years may simply be infeasible without a substantial reduction in export sales prices that would enable the capturing of existing markets.
Second, recent history suggests that many of the announcements are not likely to be realized. Figure 1 shows that only 2 of the 18 announced U.S. projects between 2019 and 2024 are categorized as likely to be completed (Brown, 2018). Furthermore, Figure 3 shows that only a small percentage (14.4%) of the announced increased capacity is likely to be added over the next five years. Approximately 33% of the announced capacity increases are listed as possible and the majority—52.6%—are unlikely to be constructed.
Hence, given the uncertainty of market demand, relatively low historical success rates, and knowledge about the barriers to entry into a highly concentrated commodity industry, it is curious that firms continue to announce intentions to construct new facilities and/or expand capacity. Of course, numerous reasons could be conjured. It could be that new entrants make announcements to gauge interest from regional economic development agencies or potential investors. When neither appears, plans are scrapped. Firms may also face environmental and other unexpected regulatory constraints that may cause a potential site to be deemed unviable. Furthermore, it could be that some companies consider multiple sites (hence, make multiple announcements) to provide more options regarding regulatory issues or evaluate the profitability of alternate sites. Or companies may simply miscalculate startup or operations costs or misjudge the availability of markets.
While such miscalculations may contribute to some announced projects being abandoned, they may not be the primary reason. That is, the U.S. nitrogen fertilizer industry is well-established with large multinational firms that have the resources to gather information and accurately assess the various aspects of its input and consumer markets. In such an industry, it seems unlikely that firms would so grossly misjudge or simply ignore market and regulatory information as to renege on announcements about multimillion (and often billion) dollar expansion projects.
An alternative explanation is that expansion announcements may represent an effort to send signals to competitors that could cause the latter to reconsider their own entry into the market. That is, firms may announce plans for expansion or entry, but the credibility of those announcements is uncertain because a large proportion of those stated intentions may only be strategic maneuvering that gives other industry participants pause when considering their own capacity expansions or market entry. The U.S. nitrogen fertilizer industry is highly concentrated, with most firms privately owned. This oligopoly structure matches that of several other major U.S. agricultural industries (e.g., ethanol production, grain exporting, cattle and hog processing). Given that a high proportion of fertilizer capacity announcements did not materialize and that other highly concentrated industries also engage in similar signaling behavior, it may well be the case that many ammonia facility expansion announcements made during the 2013–2024 period represent strategic maneuvering.
The strategic signaling behavior possibly observed in the U.S. nitrogen fertilizer industry through capacity expansion announcements may be a classic example of a Stackelberg leadership strategy. Stackelberg leadership occurs when an industry leader signals its intentions to other firms in an industry, and the signaling and industry responses are made sequentially (Stackelberg, 2011). For example, capacity expansion intentions may be such a signal and an effort to dissuade others from expanding capacity or entering the market. Stackelberg leadership behaviors have been documented in the pharmaceutical, cable television, and wireless phone service industries (e.g., Morgan, Bathula, and Moon, 2020).
We propose that the Stackelberg model may be particularly useful in characterizing the U.S. nitrogen fertilizer production, which is an oligopolistic market producing an undifferentiated product within which large market shares and high capacity usage are required to maintain low average costs. In addition, few entry barriers exist and announcements about possible changes in capacity are easily disseminated across the industry.
Firms may engage in Stackelberg competition if a firm or firms have first-mover advantages (such as the ability to quickly commit to expansions), have the technological knowledge to allow for expansion, or possess adequate financial assets. The four well-established, privately owned firms that account for 76% of total U.S. nitrogen fertilizer capacity have many of these characteristics. For these firms, capacity expansion announcements may be an effective strategy for maintaining profits and market shares in this oligopolistic market.
Table 2 shows that CF Industries has the largest capacity share of the U.S. fertilizer market. However, the next three largest firms are similarly sized, well-established, and understand the market and technologies given their longevity and scale. It is likely that any one of these firm’s capacity expansion announcements may actually be signals to other existing and potential new entrants designed to discourage others to expand. In fact, all three firms have made capacity expansion announcements that were not realized.
Because of relatively high investment costs for expanding or building new ammonia and nitrogen production facilities, even the threat that a large competitor might expand and drive profits toward zero may be sufficient to keep smaller or new firms from expansion or entry. Therefore, a firm can simply make an announcement of expansion and, if it is perceived to be sufficiently credible, limit expansion or entry activities of its competitors. Once these competitors abandon their own projects, the firm could simply maintain the market status quo by withdrawing their announced plans or pursue projects that maximize their own profits. And because most firms in the U.S. nitrogen fertilizer industry are privately owned, the consequences of such “announce-then-abandon” strategies may be small relative to the potential impact on publicly owned firms whose shareholders may react negatively (i.e., lower stock prices) to such bait-and-switch behavior.
Strategic signaling may be especially relevant for the U.S. fertilizer industry because the United States continues to import fertilizer—although, as shown in Figure 2, at lower levels than a decade ago. Domestic fertilizer prices, therefore, are highly influenced by world prices. However, domestic fertilizer suppliers avoid the costs of transporting fertilizer from foreign countries to U.S. ports and can, therefore, have higher profit margins by pricing their products at, but not above, world prices plus transportation costs. If the U.S. fertilizer industry actually expanded to the point where it became a net exporter, then those exports would be priced at the world level less transportation costs to other countries. This would reduce fertilizer prices for not only the exported products but for domestic products as well. As such, domestic firms with large market shares have an incentive to limit entry and expansion domestically to maintain production asymptotically close to fully meeting U.S. demand.
The U.S. domestic nitrogen fertilizer industry has expanded in recent years, prompted by increased fertilizer demand, low natural gas prices, and the nature of commodity markets. Nonetheless, far more expansion plans have been announced than have actually been completed. The industry is relatively concentrated, produces a largely undifferentiated product, and most firms are privately owned. Consequently, because there is not a “stock market price boost” explanation for making capacity plans public, it could be the case that such plans are the result of a Stackelberg leadership strategy. That is, capacity expansion announcements may be a strategic attempt—perhaps well characterized by the moniker “#FakeNews”—by industry leaders to dissuade entry by either new or existing competitors. If a Stackelberg leadership strategy represents U.S. fertilizer producers’ behavior observed over the past decade, and if this type of behavior continues to be successful, U.S. agricultural producers who are major users of nitrogen fertilizer may not see further price reduction benefits that had initially been anticipated in response to domestic fertilizer capacity expansion announcements.
Bekkerman, A., T. Gumbley, and G.W. Brester. 2020. "The Impacts of the Renewable Fuel Standards on Spatial and Vertical Price Relationships in the U.S. Fertilizer Industry." Applied Economic Perspectives and Policy. Forthcoming.
Brown, T., ed. 2018. Ammonia Capacity in North America. Ammonia Industry. Available online: https://ammoniaindustry.com/ [Accessed April 24, 2018].
Dutkowsky, M., G.W. Brester, and V.H. Smith. 2014. International Agricultural Fertilizer Trade. . Bozeman, MT: Montana State University, Department of Agricultural Economics and Econonmics, Agricultural Marketing Policy Center, Briefing No. 109. September. Available online: http://www.ampc.montana.edu/briefing.html.
Morgan, G., H.S. Bathula, and S. Moon. 2020. “Pricing of Pharmaceuticals Is Becoming a Major Challenge for Health Systems.” BMJ 368: l4627.
Stackelberg, H. von. 2011. Market Structure and Equilibrium: 1st Edition Translation into English, Bazin, Urch & Hill, Springer 2011, XIV, 134 p., ISBN 978-3-642-12585-0
U.S. Geological Survey. 2019. “Nitrogen (Fixed)—Ammonia.” In Mineral Commodity Summaries. Multiple years. Available online: https://www.usgs.gov/centers/nmic/nitrogen-statistics-and-information [Accessed May 22, 2019].

