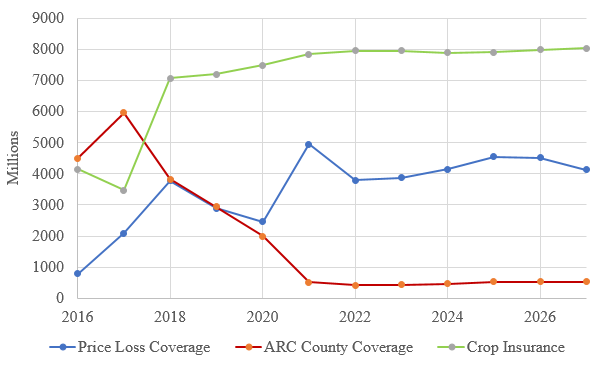
Crop insurance has become the backbone of risk management protection afforded to crop farmers by the U.S, Department of Agriculture (USDA). This is evidenced by decreases in Title I of the 2014 Farm Bill and increase in Title XI funding (Shields, 2015). Figure 1 illustrates the August 2017 CBO baseline estimates of annual cost of crop insurance, the price loss coverage program, and agricultural risk coverage (ARC). The projected cost of ARC is declining rapidly, while the crop insurance program is expected to cost approximately $8 billion per year for the foreseeable future. With the prominence of crop insurance, the debate on renewing the Farm Bill in 2018 will likely focus on the crop insurance program.
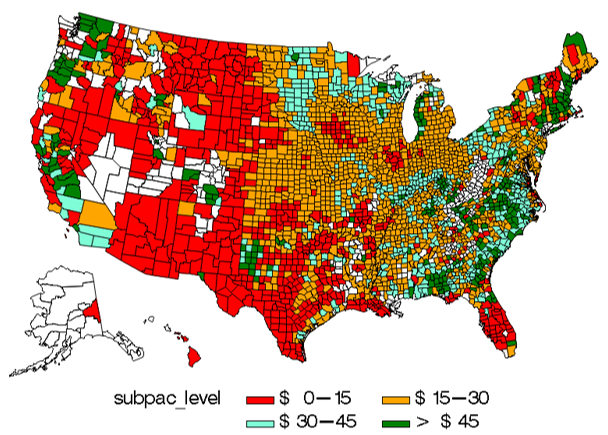
In fact, a commonly proposed cut to crop insurance is a cap on crop insurance subsidies per recipient per year. For example, the President’s budget proposal for 2019 includes a $500,000 adjusted gross income crop insurance subsidy cap. The implication of an effective premium cap would be to fully subsidize small farms while subsidizing larger farms up to a point, after which all premiums would be unsubsidized. Since subsidy is a function of risk, coverage levels, unit structure, and insurance plan chosen, subsidies per acre across all crops vary (Figure 2). Some have suggested that capping subsidies may either cause producers to evade the cap or that a cap will cause large producers to leave the crop insurance program. A further assertion is that larger farms are potentially less risky. For example, an industry website (cropinsuranceinamerica.org) states:
As support limits increase the cost of crop insurance, farmers will buy less crop insurance or not buy it at all. The impact would be largest for lower risk farmers, crops and regions. That would change the composition of the “risk pool,” which in turn would increase the premiums for every farmer in that risk pool. (By statute, the premiums should be adequate to pay out the expected losses.)
To our knowledge, little research has addressed whether large farms are less risky than smaller farms. This research tests whether large farms constitute a less risky sub-population in the insurance pool. We test this hypothesis for corn and soybeans while controlling for factors such as irrigated versus dryland production and regional effects.
However, before we conduct the analysis, the problem merits careful definition. First, it is well documented in the literature that aggregating fields into larger insured units almost assuredly reduces risk. Numerous studies have shown that aggregated data will likely be less than perfectly positively correlated and some diversification of risk occurs (Cooper et al., 2012, and Knight et al., 2010). Coble et al. (2010) describe how RMA rates various unit structures and sizes of units. Second, the U.S. crop insurance program insures entire acreage in a county (enterprise units) or smaller basic or optional units. In many cases, a large farm may have 10 or more insured units. Thus, the question relevant for the risk pool issue is best posed as follows: Does an insured unit, all else being equal, have a lower expected indemnity if it is a unit in a large farm versus in a small farm?
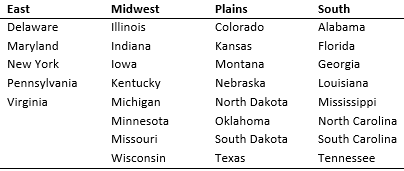
The data are 10-year farm-level yield histories from 1999 to 2008 that were used to establish Actual Production History (APH )yields for 2009 purchasers of unit-level yield and revenue insurance policies, obtained from the USDA Risk Management Agency (RMA). These records reflect data for either basic or optional units actually insured by RMA in 2009. We retained the records where there were 10 years of actual yields reported for the unit. All transition yields or other proxy yields were omitted and duplicate records were removed, resulting in 109,423 corn and 127,096 soybean insured units found in 29 states in the Midwest, South, Eastern, and Plains regions of the United States. Table 1 lists the states included in each region.
Yields were linearly de-trended to adjust for changes in yield expectations over time due to improved technology and production practices. For each unit, yield insurance indemnities were then simulated for each of the 10 years using an assumed price of $4.00 per bushel for corn and $8.00 per bushel for soybeans. Various coverage levels were assumed to test the robustness of the results, but the results shown here assume a 75% coverage level – the most common corn and soybean coverage level chosen by producers. Given the 75% coverage level, average indemnities per acre for the unit were computed over 10 years. Irrigation versus dryland practices were identified from flags in the data set for each unit as well.
A key explanatory variable was constructed by aggregating acres from the insured unit level to the policy level. This subsumes all units for the crop in the policy. So if a policy had four corn units each with 200 insured acres, then the policy-level acreage would be 800 acres. Thus, the regression data include average yield insurance indemnity over 10 years as a dependent variable, with a variable reflecting percentage of irrigated versus dryland acreage and regional dummy variables reflecting the region of the United States in which the policyholder is located.
We estimated impact that region, percentage of acres under the policy that were irrigated, and a change in the total acreage under the insurance policy would have on the percentage change in the average yield indemnity for a policy holder over a 10-year period. A double-log specification is used for the relationship between indemnity per acre and total policy acres.[1] As a measure of risk, we used indemnity per acre, which reflects insurance risk, rather than loss ratio, which measures indemnities relative to premiums. All results discussed are statistically significant at the 1% level. Midwestern states had the lowest average yield indemnities compared to other regions, while indemnities also declined rapidly as the percentage of irrigated acres under the policy increased, suggesting that Midwestern states tend to have less yield variability than other regions. Not surprisingly, irrigation also proves to be an effective tool for risk mitigations, a result that is widely supported by the literature.
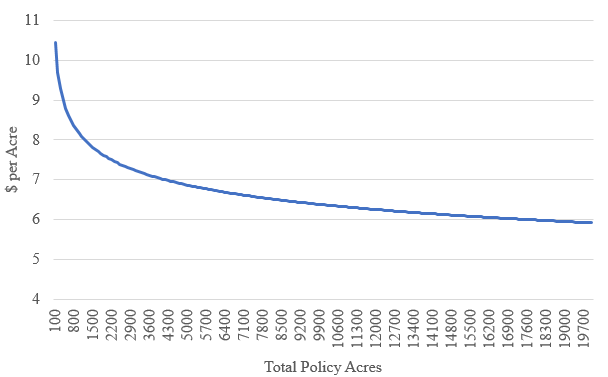
Results from our estimation show that the average per acre yield indemnity declines exponentially from very small corn farms up until around 4,000 acres and continues to gradually decline for very large farms as farm size increases (Figure 3). Mean estimated indemnities for corn with a 75% coverage level yield insurance policy decline from $10.44/acre for farms with policies consisting of 100 acres to less than $7.00/acre for farms with over 4,000 acres of corn in the policy.
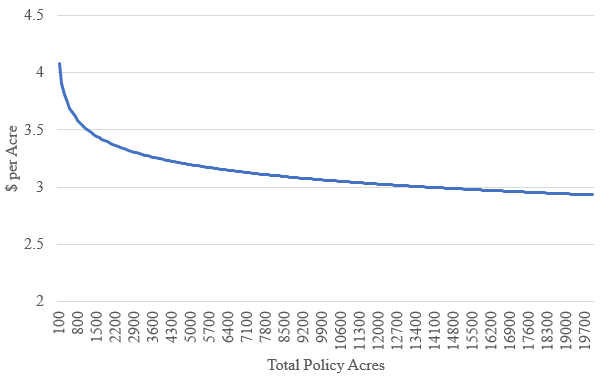
Similarly, the average per acre yield indemnity over 10 years declines rapidly for very small soybean farms up to around 4,000 acres before leveling off and slowly declining as farm size continues to grow (Figure 4). Mean estimated indemnities start at just over $4.00/acre for policies on 100 acres and declines to less than $3.25/acre for policies covering more than 4,000 acres.
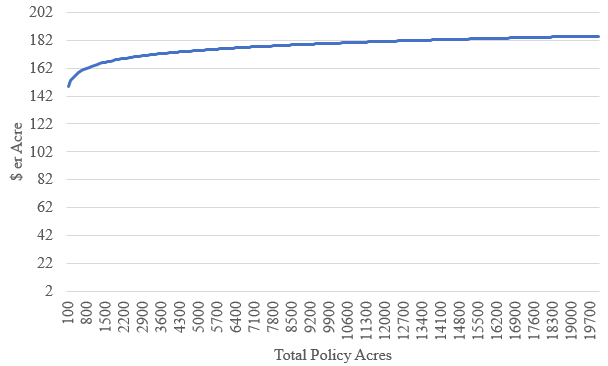
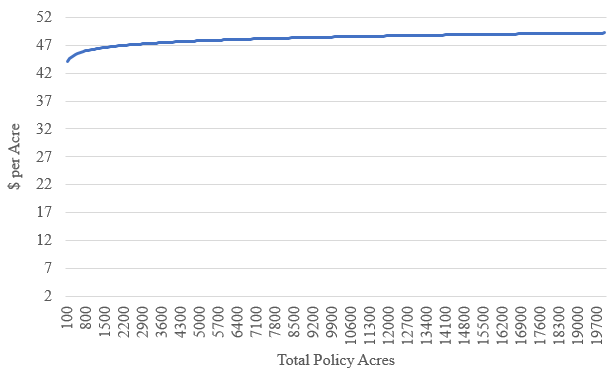
It is also relevant to ask if large farms are higher yielding than smaller farms. To address this issue, we ran a similar regression model with the natural log of the mean APH yield for the insured unit as the dependent variable (all explanatory variables remained the same). For both corn and soybeans, the relationship is positive (Figures 5 and 6). The clear implication is that larger farms tend to also have higher mean yields. This matters from an insurance standpoint because the current USDA crop insurance rating system adjusts rates within a county such that higher-than-average APH units receive a lower rate than the county reference rate. Conversely, farms with APH below the county reference yield receive a rate higher than the county reference rate. This suggests that the rating system already recognizes some of the difference in yield risk across farms of differing sizes. To the extent that this adjustment is accurate, removing large farms from the pool would have less effect.
As discussion about the federal budget continues and debate over the next farm bill heats up, the future of crop insurance subsidies will be widely discussed. For the foreseeable future, the cost of crop insurance programs is approximately $8 billion per year, which means that crop insurance is going to be the primary focus for potential farm program cuts.
However, many in the industry have argued that capping crop insurance subsidies could push some of the largest producers out of crop insurance programs. While this is possible, it only becomes a problem if the larger producers who may exit the crop insurance programs are less risky than those who remain. A related possibility may be a more serious issue in less-dense cropping regions, where the exit of some large farms may leave a less viable delivery system. The objective of this study was to test whether the large farms that might exit the programs as the result of a subsidy cap do indeed constitute a less risky sub-population in the insurance pool. The results of this study confirm the hypothesis that large farms are a less risky sub-population in the insurance pool. Average per acre indemnities decline rapidly for both corn and soybean acres as the size of the insurance policy increases.
A recent study by Taylor and Barnaby (2017) suggests that it will take 1,500–2,500 acres to reach the proposed $40,000 subsidy cap, depending on the state and the crop grown. Small and medium-sized farms make up the vast majority of farms in the United States and will not be impacted, but in 2016, 46% of total crop insurance indemnities and 36% of harvested cropland was paid out to or under control of large or very large family farms. (U.S. Department of Agriculture, 2016). Many of these farms would be impacted by the proposed cap, suggesting that a significant portion of insured cropland in the United States would fall under the proposed subsidy cap.
However, the behavior of large farms under a cap is not entirely clear. Presumably, a portion of their premiums would be subsidized if they remained in the program. Would they selectively insure some crops and leave others exposed? Related to this question is the degree to which large farms can be reconstituted to avoid payment limits. A second question is what would large farms do if they left the program? Would they simply self-insure or would they perhaps seek private insurance that meets their needs? Another question is whether that protection would be supplied by the private sector. If so what would it constitute? Recent events following hurricane disasters in Florida in 2017 and in a broader swath of the Southeast in 2017 suggest that producers will likely ask for ad hoc assistance in the event of a severe yield loss.
A caveat of this analysis is that we modeled yield insurance to investigate differences across all farm sizes. However, because the price risk component in crop insurance is based on futures markets, it would apply to all farm sizes equally. As most crop insurance sold in the United States is revenue-based, the differences in revenue indemnities would be dampened relative to these results. We also note that these results do not prove that rates for either large farms or small farms are actuarially unsound. While the attribute investigated in this paper is not directly used in rating, it may be indirectly captured through other variables such as mean yields.
Finally, what we do not answer in this paper is why large farms are found to be less risky. Given these suggestive results, that is a worthwhile topic for further research. Short of further analysis, we can only speculate that larger farms use superior production practices, have more productive soils, or that farm risk management is correlated with farm size.
Barnaby, G.A., and L.A. Russell. 2016. “Crop Insurance Will Be at the Center of the 2019 Farm Bill Debate.” Choices 31(3):1–11.
Coble, K.H., T.O. Knight, B.K. Goodwin, M.F. Miller, R.M. Rejesus, and G. Duffield. 2010. A Comprehensive Review of the RMA APH and Combo Rating Methodology: Final Report. Washington, DC: U.S. Department of Agriculture, Risk Management Agency. Available online: https://www.rma.usda.gov/pubs/2009/comprehensivereview.pdf
Cooper, J., C. Zulauf, M. Langemeier, and G. Schnitkey. 2012. “Implications of Within County Yield Heterogeneity for Modeling Crop Insurance Premiums.” Agricultural Finance Review 72(1):134–155.
https://cropinsuranceinamerica.org/what-would-means-testing-do-to-americas-crop-insurance-system/
Knight, T.O., K.H. Coble, B.K. Goodwin, R.M. Rejesus, and S. Seo. 2010. “Developing Variable Unit-Structure Premium Rate Differentials in Crop Insurance.” American Journal of Agricultural Economics 92(1):141–151.
Shields, D.A. 2015. Federal Crop Insurance: Background. Washington DC: Congressional Research Service, Report 7-5700.
Taylor, M., and G.A. Barnaby Jr. 2017. Impact of Subsidy and Income Limits on Farm Size Measured at the State, County, and Farm Level. Manhattan, KS: Kansas State University Department of Agricultural Economics Extension Publication. Available online: http://www.agmanager.info/crop-insurance/crop-insurance-papers-and-information/impact-subsidy-and-income-limits-farm-size
U.S. Department of Agriculture. 2017. America’s Diverse Family Farms, 2017 Edition. Washington, DC: U.S. Department of Agriculture, Economic Research Service, Economic Information Bulletin 185, December.
[1] We also estimated linear models. There model specifications had similar signs and significance.

