Determining the optimum mature cow weight or cow size is a complex problem faced by producers. While larger cows wean larger calves than smaller cows, the smaller cow weans a larger percentage of her body weight (Dhuyvetter, 2009). In addition, while the smaller cow has a reduced feed efficiency, the larger cow requires more nutrients for maintenance (Hersom, 2009). Further, smaller cull cows bring less money per head on sale day than larger cows. Given a set of fixed resources, a greater number of smaller cows can be maintained relative to a smaller number of larger cows (Mathis and Sawyer, 2000).
Doye and Lalman (2011) found that moderate-sized cows (1,100 lb) were more profitable than big cows (1,400 lb) on two different forage bases in Oklahoma while accounting for both biological and economic efficiency differences between the cow sizes. Bir et al. (2018) used historical data from 1988–2009 to evaluate the relationship between cow weight and calf weaning weight. They simulated 15 years of cattle price data and determined the net present value (NPV) of cows weighing between 950 and 1,800 lb in 50-lb increments across two different resource bases typical of the Southern Plains. They found the 950-lb cow resulted in the highest NPV per acre on the two different resources bases and concluded that larger cattle may be more profitable in a feedlot but were likely less profitable at the cow–calf industry level.
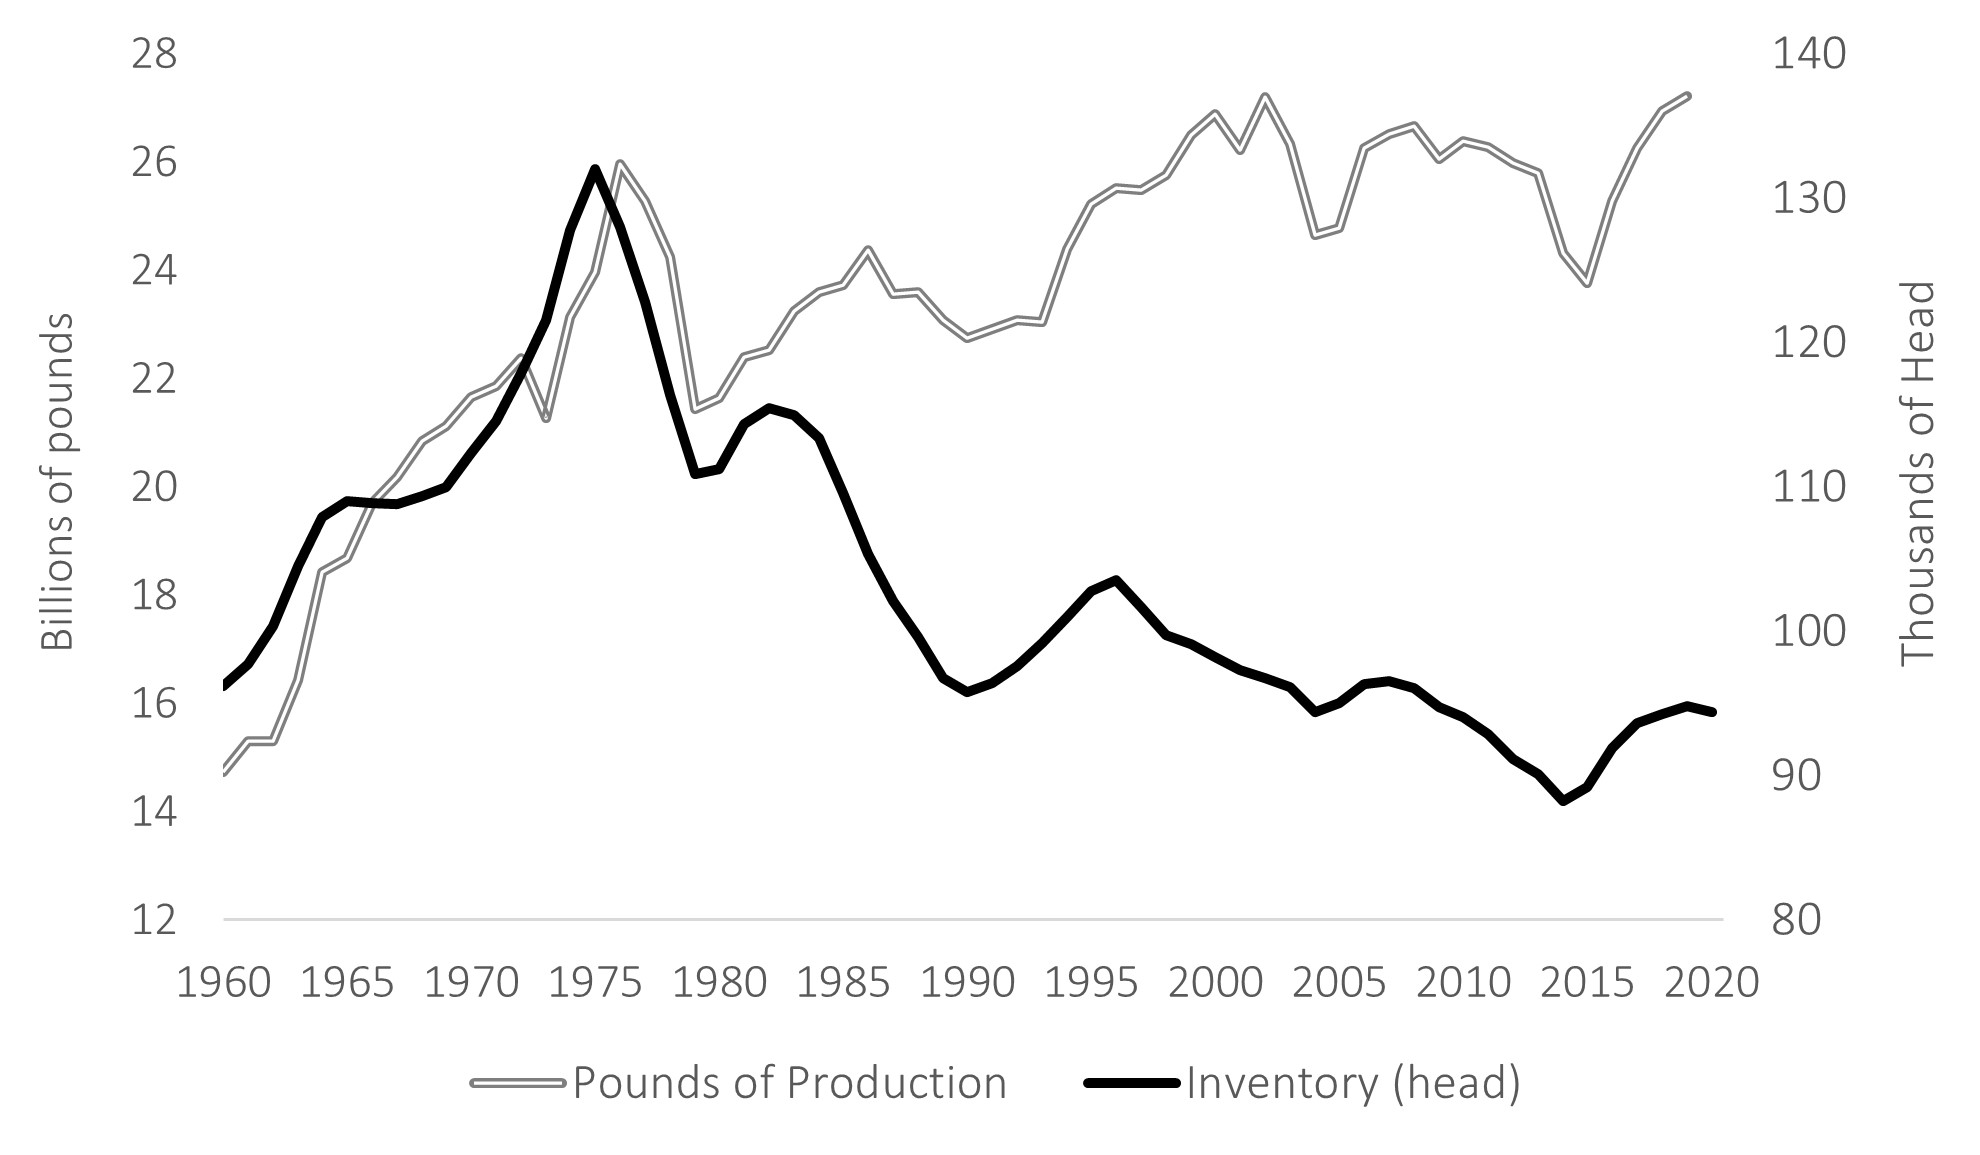
Source: Livestock Marketing Information Center, Monthly Beef
Spread data from USDA (ERS); USDA, NASS Beef, Slaughter-
Production Measured in lb (2020a).
Mature cow size does impact slaughter cattle weights and—ultimately—beef production. In 1975–1979, mature cows averaged 978 lb; by 2015–2019, the average weight of a mature cow had increased to 1,285 lb—a 31% increase, or about 7.5 pounds per year. Average fed steer carcass weights increased from 687 lb in 1975–1979 to 884 lb in 2015–2019—a 29% increase, or about 5 pounds per year (Livestock Market Information Center, 2020). This has allowed producers to increase overall production of beef (in pounds) while simultaneously decreasing the total cattle inventory (see Figure 1). From an economic viewpoint, is this positive for cattle producers? Is it positive for the cattle industry? Feuz (2005) illustrated that heavier fed cattle weights often lead to increased returns per head for an individual pen of feedlot cattle. However, when considering the elasticity of demand for slaughter cattle (-0.4 to -0.7), heavier weights lead to a decrease in profitability for the overall fed cattle sector and ultimately the cattle industry.
Cattle producers, especially in the western states, rely heavily on the grazing resources made available through public land grazing. The Taylor Grazing Act of 1934 (U.S. Congress, 1934) was the first real attempt at the federal level to regulate and charge for public land grazing. Those regulations defined one cow with a calf at her side or five ewes with lambs as an animal unit. The strictest definition of an animal unit is the amount of energy in kilocalories needed to sustain a 1,000-lb animal, with the following formula being used to determine animal unit equivalents (AUE) for animals of other weights: AUE = Weight.75/1,00075 (Lewis et al., 1956). The frequently cited Nutrient Requirements of Beef Cattle (National Research Council, 1996) handbook defines an animal unit as a 1,000-lb cow with or without a calf by her side. The Bureau of Land Management (BLM) and the U.S. Forest Service (USFS) both define an animal unit as a cow with a calf at her side and make no reference to weight, at least in allocating and charging for grazing permits.
In 1934, the average cow weight was likely close to 900 pounds (U.S. Department of Agriculture, 2020b), with a calf averaging 225 lb during the grazing season, or about 1.25 true animal units. By 1979, mature cow weight had increased to 1,000 lb and average calf weight was 250 lb, or about 1.35 animal units—an 8% increase. Perhaps in part due to the larger cow size, which truly does require more forage, many BLM and USFS range allotments were overgrazed and poorly managed. The U.S. Congress passed the Public Rangeland Improvement Act of 1978 (U.S. Congress, 1978) in an attempt to give BLM and USFS more direction to reassess the number of permits assigned to a grazing allotment (for example, to adjust animal units to more closely match the forage produced). However, both the BLM and the USFS continue to provide permits and establish fees on essentially a per head basis and not on a true AUE basis. In the just over 40 years since the 1978 legislation was passed, average cow size has increased to 1,285 lb and the average calf weight during summer grazing has increased to 300 lb, or a true animal unit equivalent of 1.61, which is a 19.4% increase since 1979.
The objectives of this paper are to identify the economically optimum cow size (1,000, 1,200, or 1,400 lb) for three ranch types, or resource bases, common in the Intermountain West, an area that relies heavily on BLM and USFS grazing, and determine whether the BLM and USFS practice of charging for public range grazing on a per head basis rather than on a true animal unit basis affects the optimal cow size and, by extension, has contributed to overgrazing.
We first assume an inventory to establish the number of cattle of each type (cows, first-calf heifers, replacement heifers, and bulls) and the replacement rates for each type needed to maintain a constant cow herd on a fixed set of resources. Second, we balance rations for each type of cattle based on the resources available and on the nutrient requirements for each weight and class of animal. Third, we create a production budget using the data obtained from the inventories and rations. Finally, we develop an optimization model using price data, feed requirements, and production data. We determine the optimal cow size that maximizes producer profits for each ranch type (resource base). In determining the optimal cow size, grazing fees on BLM and USFS are initially charged on a true AUE basis rather than a per head or per cow basis. Then, to determine whether federal grazing policy impacts the optimal cow size and address objective 2, we again determine the optimal cow size within the optimization model after allowing grazing fees to be charged on a per cow or per cow–calf pair basis according to existing federal grazing policy. We then compare the optimal cow size results for each resource base.
The optimization models are constrained by a fixed number of animal unit months (AUMs) of federal grazing. When existing federal policy is used to only count the cow–calf pair as an animal unit, then 500 head of cows plus the associated replacement heifers and bulls can be maintained on all resource bases regardless of cow size. However, cow size still impacts the amount of private grazing needed and winter feed required. If federal grazing permits are allocated on a true (AUE) basis, then there are sufficient permits for 574 1,000-lb cows, 500 1,200-lb cows, and 446 1,400-lb cows with the associated replacement heifers and bulls. The optimization model selected cows within these three weight groups (small: 1,000 lb, moderate: 1,200 lb, and large: 1,400 lb) to maximize producer net return.
Three ranch types are used in the analysis with three separate resource bases. The three resource bases allow for 1) no hay winter-feeding, 2) three months of hay feeding, and 3) six months of hay feeding, respectively. The number of months that cattle are grazing on federal rangelands are 10, 6.5, and 4 for resource bases 1, 2, and 3, respectively. When the cattle are not being fed hay and are not grazing on federal rangeland, they are assumed to be grazing on private range or pastureland. The cow herd inventories, feed rations, and budgets are created for each of the three resource bases, but for the purpose of brevity, most of the discussion will focus on resource base 2. Similar procedures were also applied for resource bases 1 and 3.
The typical ranch on resource base 2 is created such that the resources meet the needs of 500 mother cows weighing 1,200 lb and the replacement heifers and bulls that would be needed to maintain this cow herd. We use production benchmarks to develop an inventory that is representative of the cattle industry. CHAPS 2000 (2013) benchmark Standardized Production Analysis (SPA) data were gathered from 2008 to 2012 from 91,414 cows exposed to bulls and processed. CHAPS shows a pregnancy rate of 93.6%, a weaning rate of 90%, a replacement rate of 15% (which also includes the cow diagnosed as open), and a death loss of 1% for mature cows. This leaves the ranch with 420 good pregnant cows, 75 to sell, and 5 dead. The operation would then need to provide 80 pregnant cows or replacement heifers to replace those sold and lost. A similar process is used to develop the inventory for replacement heifers and first-calf heifers.
In the Intermountain West, most cows are bred through natural service. Thus, a number of bulls are required. Holmgren (2014) shows a bull to cow ratio of 1:25. All the cows on the ranch must have a good opportunity to breed, requiring 28 bulls. The inventory for each resource base runs from November 1 to October 31, at which point all cattle are transferred to their respective herd inventory categories or sold.
The next step is to balance rations for all the animals on each ranch. We develop twelve total rations: one for each of four groups of animals on three resource bases. These groups of animals are mature cows, first-calf heifers, replacement heifers, and bulls. This is the normal manner for dividing the animals to ensure proper nutrition and keep feed costs down. These rations are needed to determine hay and supplement requirements as well as ensure that cattle gain or maintain an appropriate body condition score.
We balance the cows’ rations using the Oklahoma State University Cowculator (1997), which balances a diet based on cow weight, milking ability, breed, and stage of production. The diets for the remainder of the cattle (first-calf heifers, replacement heifers, and bulls) are balanced using Cowbytes (Alberta Agriculture, Food and Rural Development, 1999). The diets balanced through Cowbytes use the same criteria for energy, protein, dry matter intake, and average daily gain or body condition score. To see further details for the completed balanced rations for each of the four groups of cattle across the three resource bases along with additional information used in creating the rations, see Russell (2014).
Creating a production budget is the next step in the process of determining the optimal cow size. The inventory provides the production data, bull-to-cow ratio, death loss, and replacement rates. Once the percentages of cattle and calves to be sold are determined, prices received are gathered. The rations establish the amounts of feeds (hays and dried distillers grains (DDGs)) needed for each weight and class of animal. The grazing plans and the AUE equation previously discussed are used to determine the AUEs required for each weight and class of animal for each pasture or range type.
| First Class of Cattle | Head | Unit | Unit of Measure |
Price / Unit | Total Value |
| Heifer calves | 166 | 535 | lb | $1.23 | $109,499.52 |
| Steer calves | 266 | 565 | lb | $1.33 | $200,186.28 |
| Cull cows | 70 | 1,200 | lb | $0.61 | $50,869.70 |
| Cull first calf heifers | 10 | 1,122 | lb | $0.81 | $8,731.48 |
| Cull yearling heifers | 6 | 933 | lb | $1.15 | $6,460.26 |
| Annual sales | 518 | $375,747.24 |
Market prices for the cattle sold are obtained from the Livestock Marketing Information Center (2014) and Cattle Fax (2014). The values used are five-year averages of October and November prices (2009–2013) to account for any year-to-year market fluctuations. The months of October and November are used since cattle are normally processed, weaned, and culled during that period. The price of culled first-calf heifers is based on the cull cow price plus $20/hundredweight. The body weights of the first-calf heifers and the replacement heifers are projected by the ration-balancing program (Cowbytes) as diets are balanced. Table 1 shows the projected cattle sales of the base ranch when 1,200-lb cows are used.
The value of grazed forages is taken from the regional budget created by Holmgren (2014), which we chose for this analysis as it was recently published at the time of this analysis and fit the production environment of the intermountain west region (a region heavily utilizing public land grazing). Holmgren showed typical private pasture valued at $30/AUM and both BLM and USFS permits priced at $1.35/AUM. Five-year average prices for the feed are gathered from the Livestock Marketing Information Center (2014). Included in the price of the DDG is a transportation cost of $50/ton. Reproduction and health costs are also accounted for and charged on a per head basis. These costs are also taken from the Holmgren (2014) budget.
The annual cow cost is a cost that is accrued on a per head basis and not affected by body weight and is estimated at $141.17, $158.42, and $136.00 for cows, first-calf heifers, and replacement heifers, respectively. The annual cow cost includes labor, the bull cost as a percentage of each cow, salt/minerals, veterinarian services, pregnancy test, medicine and supplements, cow vaccinations, and calf vaccinations.
The initial solution from the optimization model for resource base 2 selected only lightweight cattle (1,000-lb cows), which indicates the 1,000-lb cows are the most profitable. Further, resource base 2 is able to carry 74 more 1,000-lb cows than the 500 head of 1,200-lb cows that the resource base supports. The results also show 115 heifer calves retained for replacements and 106 first-calf heifers, so the ranch could maintain a herd size of 574 mother cows. The number of cattle sold is 306 steers weighing 500 lb each, 191 heifers weighing 470 lb each, 6 open replacement heifers weighing 800 lb each, 11 open first-calf heifers weighing 923 lb each, and 80 (1,000 lb) cull cows.
The optimal solution for resource base 2 generated a net return of $34,886 with total costs of $365,026 and a total revenue of $399,912. Total costs are broken down into fixed cow costs of $113,340, grazing costs of $123,931, and feed costs of $127,755. Total revenue is broken down to $336,947 in sales revenue from calves and $62,965 in sales revenue from cull animals.
| Resource Base 1 | Resource Base 2 | Resource Base 3 | |
| Optimal size selection | 1,000 lb | 1,000 lb | 1,000 lb |
| Total revenue | $399,911.68 | $399,911.68 | $399,911.68 |
| Total costs | $307,773.81 | $365,025.83 | $411,447.60 |
| Net return | $92,137.86 | $34,885.84 | $(11,535.93) |
| Reproducing cows | 680 | 680 | 680 |
The 1,000-lb cows are also the profit-maximizing selection for resource bases 1 and 3. The optimal solution for resource base 1 generated a net return of $92,138, a $57,252 increase in net returns over the resource base 2 model. This is primarily due to decreased reliance on harvested winter feeds. For the resource base 3 scenario, the net return is expected to be negative for any of the three possible cow size selections. This is primarily the result of the high winter feed cost of feeding harvested feeds for six months of the year. However, the 1,000-lb cow generates the greatest (least negative) net return. Table 2 compares the optimal solutions for each of the three resource bases.
To determine the impact on optimal mature cow weights of charging on a per cow or cow-calf pair for the grazing fee on BLM and USFS lands, we update the optimization model to hold constant the federal grazing fees charged to the various cow sizes in accordance with existing policy. The optimal size under each resource base scenario is then determined again and the results are compared with the previous results when cattle were charged a grazing fee on a true AUM or AUE basis.
The optimum cow size for resource bases 1 and 2 is the 1,400-lb cow. The net return for resource base 1 is $104,852, which is $12,714 more than when more 1,000-lb cows are run under the true AUE scenario. This result is quite intuitive when one considers that under this resource base cattle graze 10 months per year on federal lands. If the producer is charged the same amount to graze a 1,400-lb cow as a 1,000-lb cow, then clearly there is an incentive to run a larger cow, wean a bigger calf, and receive greater revenue.
With resource base 2, cattle utilize federal grazing lands for 6.5 months of a year. The 1,400-lb cow size is also optimal for this base. However, net returns only increase from $34,886 (with more head of lighter-weight cows under the true AUE model) to $35,966 when federal grazing is charged on a per cow basis. On 500 cows, that is only about $2 per cow difference in the models. While producers are incentivized to run larger cows on the federal grazing allotments, they bear the higher costs of feeding those larger animals for 5.5 months of the year.
Under the conditions of resource base 3, a negative net return occurs, indicating that it would be more profitable to sell the cows and sell or lease the forage and pasture resources of the ranch. However, if cows are maintained on the ranch, then the smaller 1,000-lb cow is the optimal cow size. Under this scenario, the costs of feeding cattle hay for six months and the true cost of grazing on private pasture outweigh the revenue from heavier cattle. The “subsidy” for heavier cattle grazing on federal range for only four months does not offset the higher costs of feeding heavier cattle eight months of the year.
| Resource Base 1 | Resource Base 2 | Resource Base 3 | |
| Optimal size selection | 1,400 lb | 1,400 lb | 1,000 lb |
| Total revenue | $407,010.15 | $407,010.15 | $348,466.78 |
| Total costs | $302,158.25 | $371,044.53 | $359,046.80 |
| Net return | $104,851.90 | $35,965.62 | $(10,580.02) |
| Reproducing cows | 592 | 592 | 592 |
Table 3 compares the financial outcomes for the optimal solutions for each resource base when public grazing is charged on a per head basis. These results indicate that the current public grazing fee policy does affect the optimal size of cattle, particularly for operations that utilize federal grazing for over half of a year.
Cow–calf producers are generally considered price takers, as each producer has little control over market price and produces a fairly homogeneous commodity, “calf”. These conditions result in tough competition within the industry. This competitive environment drives the need for efficiency and continual improvements. One such opportunity is for producers to select the most efficient cow size for their operation. The results of this research demonstrate that when all grazing fees are charged on a true AUE basis, smaller cows generate the greatest net returns on each of the three resource bases. All three resource bases are able to carry 74 more small cows than medium cows and 128 more small cows than large cows. Even though revenue per cow is lower for the smaller cow, costs are also lower per head on each of the resource bases. Being able to run additional smaller cows, combined with their reduced costs per head, more than offset the lower revenue per head from selling lighter-weight calves.
When grazing fees for public grazing permits are charged on a per head basis (the current federal grazing policy), the large cows generate the greatest net returns on resource bases 1 and 2. However, the smaller cow generates the greatest (least negative) net returns on resource base 3. When public grazing fees are charged in this manner, the increase in revenue from selling heavier calves from large cows is greater than the increase in the feed cost.
This research indicates that the current method of charging for federal grazing permits does have an impact on the cow size selected by producers on certain resource bases and is expected to push public land grazing producers toward heavier average mature cow weights. This only further exacerbates the push felt in the industry as a whole to increase average cow weight.
The results strongly suggest that if producers are charged for grazing public lands on an AUE basis that a smaller, 1,000-lb cow would generate the greatest return on all three resource bases. In reality, producers are charged on a per head basis for grazing their cattle on public lands. Under this current policy, from the perspective of profit maximization, the 1,400-lb cow is the optimal size for resource bases 1 and 2. This suggests that the current policy does play a part in the cow size selected by producers on these two resource bases.
As the cattle industry has been trending toward larger cow sizes, there have been many concerns noted. Chief among the concerns is the potential for over-grazing public ranges. Body weight certainly effects dry matter consumption—as cow weight increases so too does consumption. By charging grazing fees on a per head basis, this increased consumption is not properly accounted for and public lands are in danger of being overgrazed. This is a classic case of the “tragedy of the commons,” a situation in which users of a shared resource system each independently seeking to maximize their self-interest behave contrary to the common good of all users by exhausting the shared resource through their combined actions (Hardin, 1968). Cattle producers often shoulder the blame for overgrazed public lands. Yet the results of this paper suggest that profit-maximizing producers would tend to favor smaller cows with less potential to overgraze public lands if the public grazing fee was charged on an AUE basis. Charging on an AUE basis better accounts for forage removed from public ranges and could possibly have a positive effect on range condition if implemented.
Yet another concern with increases in average cow weight is the possible effects on consumer preferences. As cow size increases, carcass size also increases. With larger carcasses, average steak size has increased, while retailers have tended to decrease the average thickness marketed in order to hit certain price points to satisfy consumer demand. Yet Maples, Lusk, and Peel (2018) found that consumers prefer thicker steaks with smaller surface area and that over the past forty-year increase in average carcass weight, approximately $8.6 billion has been lost annually in consumer welfare resulting from changing steak size. Again, while this loss could be attributed to producers favoring larger cow sizes, they are only following profit incentives. Grazing fee policy charging on a per head basis affects the profit incentives that producers follow and pushes the industry toward heavier cattle sizes.
Consumer welfare loss and increased potential for overgrazing of public lands are just two of the negative externalities resulting in part from the current grazing fee policy. Charging on a true AUE basis may be a difficult task. This research demonstrates, however, that efforts to restructure the current policy to better account for increased feed needs that accompany heavier cattle may be worthwhile and should be given consideration by policy makers.
Alberta Agriculture, Food and Rural Development. 1999. Cowbytes v4.6.8.
Bir, C., E.A. DeVuyst, M. Rolf, and D. Lalman. 2018. “Optimal Beef Cow Weight in the U.S. Southern Plains.” Journal of Agricultural and Resource Economics 43(1): 103–117.
Cattle Fax. 2014. Available online: http://www.cattlefax.com [Accessed April 2014].
CHAPS 2000. 2013. Benchmarks. Available online: http://www.chaps2000.com/benchmarks.htm [Accessed February 2014].
Dhuyvetter, J. 2009. Focusing on Cows in a High Cost World. Minot, ND: North Dakota State University, North Central Research Extension Center. Available online: http://www.ag.ndsu.edu/northcentralrec/livestock-extention/pps/Focusing on Cows in a High Cost World.pdf/view.
Doye, D., and D. Lalman. 2011. “Moderate versus Big Cows: Do Big Cows Carry Their Weight on the Ranch?” Paper presented at the annual meeting of the Southern Agricultural Economics Association, Corpus Christi, Texas, February 5–8.
Feuz, D.M. 2005. “The Economics of Carcass Weight: A Weighty Matter for the Beef Industry.” Paper presented at the annual meeting of the Western Agricultural Economics Association, San Francisco, California, July 6–8.
Hardin, G. 1968. “The Tragedy of the Commons.” Science 162 (3859): 1243–1248.
Hersom, M. 2009. Relationship of Cow Size to Nutrient Requirements and Production Management Issues. Gainesville, FL: University of Florida Extension. Available online: https://animal.ifas.ufl.edu/beef_extension/bcsc/2009/pdf/hersom_cow_size.pdf.
Holmgren, L. 2014. 2014 Costs and Returns for a 200 Cow, Cow-Calf Operation. Logan, UT: Utah State University Extension.
Lewis, J.K., G.M. Van Dyne, L.R. Albee, and F.W. Whetzal. 1956. Intensity of Grazing – Its Effect on Livestock and Forage Production. Brookings, SD: South Dakota Experiment Station, Bulletin 459.
Livestock Marketing Information Center. 2014. http://lmic.info/ [Accessed March 2014].
Livestock Marketing Information Center. 2020a. “Monthly Beef Spread data from USDA (ERS).” Available online: https://www.lmic.info/members-only/Spreadsheets/Meat/RedMeat [Accessed July 2020].
Livestock Marketing Information Center. 2020b. “Livestock Slaughter Monthly from USDA-NASS.” Available online: https://www.lmic.info/members-only/Spreadsheets/Cattle/InventorySlaughter [Accessed August 2020].
Maples, J., J. Lusk, and D.S. Peel. 2018. “Unintended Consequences of the Quest for Increased Efficiency in Beef Cattle: When Bigger Isn’t Better.” Food Policy 74: 65–73.
Mathis, C.P., and J.E. Sawyer. 2000. Beef Cow Efficiency in the Southwest. Las Cruces, NM: New Mexico State University, Cooperative Extension Service.
National Research Council. 1996. “Appendix Tables.” In Nutrient Requirements of Beef Cattle, 7th ed. Washington, DC: National Academies Press, pp. 149–228.
OSU Cowculator. 1997. OSU Cowculator v2.0 Beef Cow Nutrition Evaluation Software. Stillwater, OK: Oklahoma State University Extension.
Patterson, D.J., R.C. Perry, G.H. Kiracofe, R.A. Bellows, R.B. Staigmiller, and L.R. Corah. 1992. “Management Considerations in Heifer Development and Puberty.” Journal of Animal Science 70(12): 4018–4035.
Russell, J. 2014. “The Optimal Cow Size for Intermountain Cow-Calf Operations: The Impact of Public Grazing Fees on the Optimal Cow Size.” Master’s Thesis, Utah State University.
Spitzer, J.C., D.G. Morrison, R.P. Wettemann, and L.C. Faulkner. 1995. “Reproductive Responses and Calf Birth and Weaning Weights as Affected by Body Condition at Parturition and Postpartum Weight Gain in Primiparous Beef Cows.” Journal of Animal Science 73(5): 1251–1257.
Summers, A.F., T.L. Meyer, S.P. Weber, and R.N. Funston. 2013. “Effect of Beef Heifer Development System on ADG, Reproduction, and Feed Efficiency During First Pregnancy.” Lincoln, NE: University of Nebraska-Lincoln, Nebraska Beef Cattle Report.
U.S. Congress. 1934. USC 43, Chapter 8a. Available online: https://uscode.house.gov/view.xhtml?path=/prelim@title43/chapter8A&edition=prelim.
U.S. Congress. 1978. USC 43, Chapter 8a. Available online: https://www.congress.gov/bill/95th-congress/house-bill/10587
U.S. Department of Agriculture. 2020a. “Beef, Slaughter- Production, Measured in Lb.” In Quick Stats. Washington, DC: U.S. Department of Agriculture, National Agricultural Statistics Service. Available online: https://quickstats.nass.usda.gov/ [Accessed July 2020].
U.S. Department of Agirculture. 2020b. “Cattle, GE 500 lbs, Slaughter, Commercial, NFI - Slaughtered Measured in lb/head, Live Basis.” In Quick Stats. Washington, DC: U.S. Department of Agriculture, National Agricultural Statistics Service. Available online: https://quickstats.nass.usda.gov/ [Accessed July 2020)].

