Election results are in: USDA reports that producers chose to enroll most of their corn, soybean, and wheat base acres in the new Agricultural Risk Coverage (ARC) program and most of their base acres for other program crops in the new Price Loss Coverage (PLC) program. These program elections will have important implications for risk management strategies, federal budgetary outlays, and even world trade negotiations.
FAPRI-MU maintains a set of economic models that are used each year to develop ten-year baseline projections of agricultural markets, farm program budgetary costs, and other indicators (Gerlt and Westhoff, 2011). A preliminary version of the baseline used here was developed in November of 2014 and reviewed by government, academic, and industry experts at a workshop in December. The published baseline (FAPRI, 2015) incorporates review comments and other information which became available in January of 2015. Finally, this baseline was updated to reflect actual ARC-PLC program elections that were released by USDA in June of 2015 (Gerlt and Westhoff, 2015).
To estimate expected payments under the new farm bill, it is important to recognize the inherent uncertainty of agricultural markets. FAPRI-MU allows random effects in some key equations. The Monte Carlo simulation is done using 500 iterations with a process that ensures quick convergence and that proper error relations are maintained. The result is a distribution of ten-year projections for production, prices, payments, budgetary costs, and other indicators. This makes it possible to look at a wide range of possible future market outcomes.
The payments reported here are the mean of the iterations. For example, the average projected soybean price for the 2015 crop year is $9.29 per bushel, well above the $8.40 reference price for soybeans that triggers PLC payments. However, in some of the 500 outcomes, the price is less than $8.40 per bushel, and PLC payments occur. The average PLC payments reported here would consider both the majority of cases where the estimated payments are zero and the small number of cases where payments occur.
The Agricultural Act of 2014—the new farm bill—eliminated a number of programs for crop producers, including direct and counter-cyclical payments (DCP) and the average crop revenue election (ACRE) program. As described in previous Choices articles (Campiche, Outlaw, and Bryant, 2014; Babcock, 2014; Goodwin and Smith, 2014), the new farm bill replaces those programs with new programs that make payments when national average prices (PLC program) or per-acre revenues (ARC program) fall below trigger levels. Producers were required to make a one-time election between PLC and a county version of ARC (ARC-CO) for each crop on each farm, or they could instead elect an individual version of ARC (ARC-IC) for all the crops on each farm. Producers are bound by those elections for the life of the farm bill, which is intended to cover the 2014-2018 crop years.
A wide range of factors may have influenced producer program elections, but their final choices appear largely consistent with the hypothesis that most producers would select the program that was expected to provide them the most government payments over the five-year life of the farm bill. In March 2015, the Food and Agricultural Policy Research Institute at the University of Missouri (FAPRI-MU) estimated national average payment rates for the 2014-2018 crop years. The estimates project agricultural market data into the future and take into account information available at that time and the inherent uncertainty and volatility of the markets (see Box). These national average projections would not represent the payments expected by individual producers, which could differ greatly because of unique characteristics of particular farms.
For seven of eight major program crops, the program elections are consistent with the choices that would have been predicted based on FAPRI-MU estimates of national average payment rates (Table 1). For corn, soybeans, and oats, projected average ARC payments exceeded projected PLC payments and most producers elected ARC. For sorghum, barley, rice, and peanuts, projected PLC payments were greater and most producers elected PLC. The one major exception to the rule is wheat, where FAPRI-MU projected PLC payments were slightly greater than projected ARC payments, but 58% of wheat base acres went to ARC. Even in the case of wheat, the election outcome may in part reflect different producer expectations about future market conditions than in the FAPRI-MU estimates, as a slightly more bullish outlook for wheat prices could have tilted the balance in favor of ARC. Nearly all producers choosing ARC selected the county version, consistent with estimates that ARC-CO payments would generally exceed those for ARC-IC.
| Projected Payments | Program Election | |||
| (annual average per acre, 2014-2018) | (share of base area) | |||
| ARC | PLC | ARC | PLC | |
| Corn | $27 | $20 | 93% | 7% |
| Soybeans | $17 | $10 | 97% | 3% |
| Wheat | $11 | $14 | 58% | 42% |
| Sorghum | $11 | $21 | 34% | 66% |
| Barley | $10 | $22 | 25% | 75% |
| Oats | $2 | $1 | 68% | 32% |
| All rice | $4 | $66 | 5% | 95% |
| Peanuts | $45 | $138 | 0% | 100% |
It is striking how many corn producers elected ARC, given the fairly narrow difference between projected ARC and PLC payments in the FAPRI-MU estimates. One reason may be that producers were making their 2014-2018 elections when they already had a lot of information about the 2014 crop. For corn producers in much of the upper Midwest, it was clear that ARC would yield very large payments for the 2014 crop, at the same time expected PLC payments for 2014 crop corn were small or even zero. Thus, some corn producers may have chosen the program that would clearly provide more benefits in the first year, given great uncertainty about what might happen in the future. This was not true everywhere. For example, because of a different yield history, expected 2014 corn ARC payments in many Missouri counties were small or zero, and it is therefore not surprising that Missouri had a more even split of ARC and PLC elections for corn.
Given the program elections and projected prices and revenues, future program payments can be estimated (Figure 1). Over the six-year life of the 2008 farm bill, actual DCP and ACRE payments averaged a little over $5 billion per year. Given all of the assumptions of the FAPRI-MU baseline, projected ARC and PLC payments also average slightly over $5 billion per year for the 2014-2018 period.
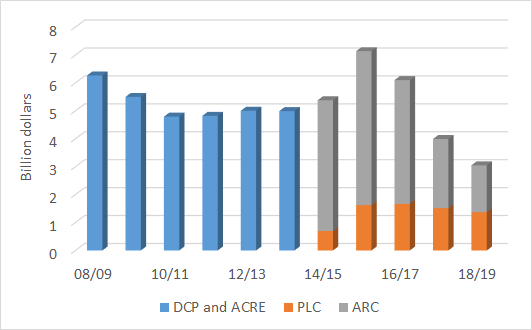
The path of projected payments shows an increase for the 2015 crop year, but then a sharp decline in subsequent years. This can be explained in part by a slight increase in projected average prices for several commodities after 2015, but primarily it is because of an important feature of the ARC program. The revenue benchmark that triggers ARC payments depends on a moving average of past prices and yields. For most grains and oilseeds, prices currently are far below the levels of 2010 to 2012. That makes ARC payments for corn and some other crops especially likely in 2014 and 2015. By 2017, the moving averages no longer incorporate the high-price years earlier in this decade, so projected revenue benchmarks and payments also decline.
Under the 2008 farm bill, federal spending under the direct payment program was very predictable. Payment rates were fixed in law and did not depend on market conditions. Counter-cyclical and ACRE payments could have been large in extreme circumstances, but in practice were very small between 2008 and 2013. In contrast, spending under the ARC and PLC payments is very sensitive to market conditions. If prices and market revenues are high, payments will be small or even zero; if they are low, payments can increase by billions of dollars. If prices are persistently low, the moving averages used to determine ARC benchmark revenues will adjust over time and payments will decline, but PLC payments will not because reference prices are fixed in law.
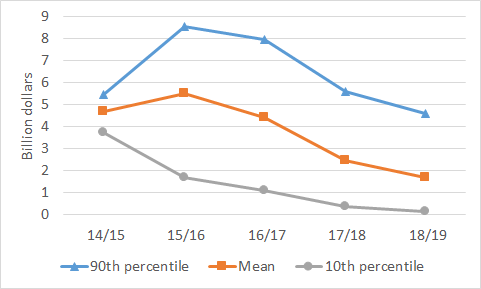
Across the simulations, average ARC payments for the 2015 crop year are about $5.5 billion. These estimates incorporate the actual program elections by producers, but depend on the estimated prices and yields from the 2015 FAPRI-MU baseline. In 10% of those 500 outcomes, those payments exceed $8.5 billion, and in 10% they are less than $1.7 billion (Figure 2). By 2018, the average level of projected ARC payments is expected to decline to $1.7 billion, with 10% exceeding $4.6 billion, and 10% less than $132 million.
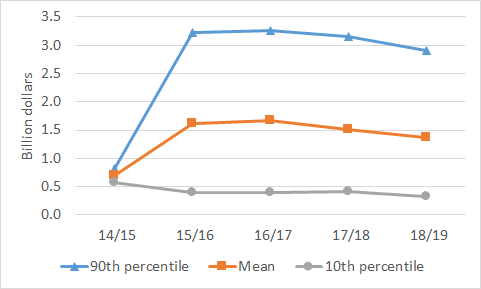
PLC participation is much lower than ARC participation overall—corn, soybeans and wheat account for far more acres than the crops where producers primarily elected PLC. Even though projected PLC payment rates per acre are large for several crops, total projected PLC payments are far smaller than projected ARC payments. For the 2015 crop year, projected average PLC payments are $1.6 billion, with 10% of outcomes exceeding $3.2 billion and 10% with PLC payments of less than $392 million. Because the reference prices for PLC are fixed across time, PLC payments do not show the same sharply declining trend as did ARC payments (Figure 3).
Moreover, ARC payments per eligible acre can never exceed 10% of the benchmark revenue, which puts a cap on possible ARC spending in any given year. Even in the most extreme of the 500 stochastic outcomes for 2015, for example, ARC payments are not much greater than the 90th percentile value shown in Figure 2. In contrast, potential PLC payments are only bounded by the difference between reference prices and loan rates and by the payment limitation rules of $125,000 per producer. That means that in a very low price year, PLC payments could be much larger than potential ARC payments.
The new farm bill could have important implications for trade disputes and negotiations (Glauber and Westhoff, 2015; Carter, 2014; Zulauf and Orden, 2015). Under the current Uruguay Round Agreement on Agriculture (URAA), countries have agreed to limit certain types of support to producers. Domestic subsidy programs are categorized into colored boxes based on the degree to which they are trade-distorting. Programs in the green box have minimal impacts on production and trade and are exempt from reduction commitments while amber box programs are judged to have larger trade-distorting effects, and are capped under the URAA. In addition, trade distorting programs may be placed in the blue box and be exempt from reduction if those programs require farmers to limit production. The United States, for example, has committed to limiting a measure of trade-distorting amber box support to no more than $19.1 billion each year. The total current aggregate measurement of support (AMS) includes crop insurance premium subsidies, marketing loan benefits, and a measure of the value to producers of the sugar price support program. In addition to these product-specific supports, non-product specific subsidies are also considered. The World Trade Organization’s (WTO) so-called de minimis rules exclude trade-distorting subsidies from the AMS if their value is less than 5% of the value of production.
Each WTO member must decide how to notify the World Trade Organization (WTO) of its internal support measures. In the past, the United States reported crop insurance subsidies as non-product specific support, but recently decided to report them as product-specific. How the new farm bill programs will be reported is uncertain. We assume here that both PLC and ARC payments will generally be reported as non-product specific support, similar to how counter-cyclical payments were notified in the past. A partial exception is that we expect that payments made on generic base acres—former cotton base acres— will be reported as product-specific support, since payments on those acres are tied to current production decisions on the farm, not just on historical base acreage (Glauber and Westhoff, 2015).
| 2014 | 2015 | 2016 | 2017 | 2018 | |
| Million Dollars | |||||
| Product-specific current AMS | 7,081 | 5,285 | 5,507 | 5,301 | 5,309 |
| Non-product specific | 5,299 | 6,931 | 5,940 | 3,939 | 3,059 |
| Total Current AMS | 7,081 | 5,285 | 5,507 | 5,301 | 5,309 |
| U.S. current AMS commitment | 19,103 | 19,103 | 19,103 | 19,103 | 19,103 |
| Share of outcomes exceeding the U.S. commitment | |||||
| 0% | 0% | 0% | 0% | 0% | |
Given these assumptions, we project that the product-specific current AMS will average a little over $5 billion per year for 2015-2018 (Table 2). On average, non-product specific support—primarily ARC and PLC payments—peaks at $6.9 billion in 2015-2016 and then declines to $3.1 billion in 2018-2019. However, these payments are not included in the total current AMS, because they do not exceed 5% of the value of all U.S. agricultural production. Thus, the reported average levels of the total current AMS are far below the current Uruguay Round Agreement on Agriculture (URAA) commitments.
As shown previously, actual ARC and PLC payments may differ greatly from the average in any given year. However, in none of the 500 outcomes are they ever large enough that their value exceeds the de minimis level. While there is some uncertainty regarding crop insurance subsidies, marketing loan benefits, and other product-specific subsidies, their combined value is projected far below the $19.1 billion AMS commitment. In any given year of 2014-2018, 95% of the simulated outcomes are less than $10 billion. In none of the 500 simulated outcomes does the total annual AMS exceed $19.1 billion over the life of the farm bill.
The limits, or so-called disciplines, on domestic support proposed under the Doha Development Agenda (DDA) would be far more constraining than under the current URAA. The DDA proposals, as laid out in December 2008, would reduce the U.S. AMS limit to $7.6 billion, reduce the threshold for de minimis outlays for developed countries from 5.0% to 2.5%, and establish a cap on U.S. blue box program expenditures of $4.8 billion. In addition, the proposed texts would establish individual commodity caps for amber and blue box outlays. The Doha Round proposals also include the establishment of a measure of “overall trade distorting support” (OTDS) that would also be capped. The annual OTDS would be measured as the sum of the current year’s AMS support, blue box support, and de minimis support. Under the proposed DDA text of December 2008, U.S. OTDS levels would be capped at $14.5 billion.
| 2014 | 2015 | 2016 | 2017 | 2018 | |
| Million Dollars | |||||
| Product-specific current AMS | 7,081 | 5,285 | 8,103 | 8,144 | 8,354 |
| Non-product specific | 5,299 | 6,931 | 309 | 309 | 309 |
| Total current AMS | 7,081 | 5,285 | 8,103 | 8,144 | 8,354 |
| Blue box support | n.a. | n.a. | 5,631 | 3,630 | 2,749 |
| De minimis support | 10,179 | 10,657 | 1,307 | 1,316 | 1,307 |
| Overall trade-distorting support | n.a. | n.a. | 15,040 | 13,090 | 12,410 |
| Proposed U.S. Commitments | |||||
| Total current AMS | 19,103 | 19,103 | 7,641 | 7,641 | 7,641 |
| Blue box support | n.a. | n.a. | 4,773 | 4,773 | 4,773 |
| Overall trade-distorting support | n.a. | n.a. | 14,467 | 14,467 | 14,467 |
| Share of Outcomes Exceeding | |||||
| Total current AMS limit | 0% | 0% | 62% | 65% | 70% |
| Blue box support limit | n.a. | n.a. | 53% | 29% | 18% |
| OTDS limit | n.a. | n.a. | 52% | 27% | 20% |
With a lower de minimis threshold, almost all product specific support would be reported as part of the AMS. As a result, AMS levels are estimated to average about $7.4 billion annually over 2014-2018, well below the URAA AMS limit for the United States of $19.1 billion, but very close to the proposed $7.6 billion AMS cap under the DDA (Table 3). Under the model results, almost 70% of the simulated AMS outcomes would exceed the DDA cap in 2018.
Similarly, if ARC and PLC payments were to be notified as blue box payments, the aggregate blue box cap would likely be binding under low price scenarios. In the simulated outcomes, about 53% of the estimated annual expenditures exceeded blue box caps on supports in 2016. As ARC guarantees fall in subsequent years, the percent of simulated outcomes exceeding the blue box cap falls to less than 20% by 2018.
The total level of trade distorting support is estimated to average about $13.5 billion over 2014-2018, below the $14.8 billion OTDS cap. However, the average again belies the proportion of outcomes where the OTDS exceeds the cap. The proportion of outcomes where the OTDS exceeds the cap in 2016 is over 50% in 2016, but declines to about 20% in 2018 as ARC outlays fall with lower guarantees.
Because of the shift to a much more extensive reliance on amber box subsidies and other less direct forms of income transfers to farmers the 2014 farm bill has complicated trade negotiations by making compliance issues more problematic, especially in the context of the 2008 DDA proposals for substantially lower limits on farm subsidies. Moreover, the domestic support programs embedded in the current farm bill are likely to receive considerably more scrutiny by trading partners if farm program outlays increase significantly. For example, in a prolonged period of relatively low crop prices, increased levels of amber support could be perceived by many other WTO member countries as insulating U.S. producers from market signals that would otherwise imply lower levels of domestic agricultural domestic production. The new farm bill programs such as ARC and PLC would therefore be viewed as distorting domestic production and arguably make the United States more vulnerable to potential WTO subsidy challenges.
We will not know the final budgetary cost of the 2014 farm bill until after the last payments are made in 2019. Markets conditions change, often in ways that are hard to anticipate, and even small changes in prices can generate large changes in government outlays. The estimates reported here are based on projections developed in early 2015. Since then, much has happened, including major swings in oil prices, exchange rates, and more. So far, there has not been a large fundamental change in the market outlook—early September expectations for corn, soybean, and wheat prices were not all that different than they were in March. However, it is certain that the estimates reported here will prove to be too high or too low.
Likewise, it is difficult to predict with confidence the implications of the new farm bill for trade disputes and negotiations. The results suggest that the United States is unlikely to exceed its current WTO commitments to limit farm support measures, but U.S. programs could be challenged on other grounds. If there were a new WTO agreement, it could create a new set of issues if domestic support disciplines were more binding than current ones.
Babcock, B. 2014. “Welfare Effects of PLC, ARC and SCO.” Choices 3rd Quarter. Available online: http://www.choicesmagazine.org/choices-magazine/theme-articles/3rd-quarter-2014/welfare-effects-of-plc-arc-and-sco.
Campiche, J., J. Outlaw, and H. Bryant. 2014. “Agricultural Act of 2014: Commodity Programs.” Choices. 2nd Quarter. Available online: http://www.choicesmagazine.org/choices-magazine/theme-articles/deciphering-key-provisions-of-the-agricultural-act-of-2014/agricultural-act-of-2014-commodity-programs.
Carter, C.A. 2014. “Some Trade Implications of the 2014 Agricultural Act.” Choices 3rd Quarter. Available online: http://www.choicesmagazine.org/choices-magazine/theme-articles/3rd-quarter-2014/some-trade-implications-of-the-2014-agricultural-act.
Food and Agricultural Policy Research Institute (FAPRI). 2015. U.S. Baseline Briefing Book. FAPRI-MU Report. Available online: http://www.fapri.missouri.edu/publication/2015-u-s-baseline-briefing-book/.
Gerlt, S., and P. Westhoff. 2011. FAPRI-MU Stochastic U.S. Crop Model Documentation. FAPRI-MU Report. Available online: http://www.fapri.missouri.edu/wp-content/uploads/2015/02/FAPRI-MU-Report-09-11.pdf.
Gerlt, S., and P. Westhoff. 2015. U.S. Crop Program Fiscal Costs: Revised Estimates with Updated Participation Information. FAPRI-MU Report. Available online: http://www.fapri.missouri.edu/wp-content/uploads/2015/06/FAPRI_MU_Report_02-15.pdf.
Glauber, J., and P. Westhoff. 2015. “The 2014 Farm Bill and the WTO.” American Journal of Agricultural Economics. Available online: http://ajae.oxfordjournals.org/content/early/2015/05/09/ajae.aav023.full.pdf+html.
Goodwin, B., and V. Smith. 2014. “Theme Overview: The 2014 Farm Bill - An Economic Welfare Disaster or Triumph?” Choices 3rd Quarter. Available online: http://www.choicesmagazine.org/choices-magazine/theme-articles/3rd-quarter-2014/theme-overview-the-2014-farm-billan-economic-welfare-disaster-or-triumph.
Zulauf, C., and D. Orden. 2015. “2014 Farm Bill and 2015 Doha Round Negotiations.” Farmdoc Daily (5):147, Department of Agricultural and Consumer Economics, University of Illinois at Urbana-Champaign. Available online: http://farmdocdaily.illinois.edu/2015/08/2014-farm-bill-and-2015-wto-doha-round.html

