This article is part of a series of Policy Issues articles on the 2012 Farm Bill. You can also find articles on The Environment of the Next Farm Bill Debate, External Factors That Will Drive the Next Farm Bill Debate, Farm Bill Stakeholders: Competitors or Collaborators?, and Trade Issues in the 2012 Farm Bill as part of this theme.
A recent commentary on remarks by Senator Debbie Stabenow of Michigan at the 2011 USDA Agricultural Outlook Conference summarizes what might be the overall charge for those participating in the policy process surrounding the development of new farm legislation. Sen. Stabenow’s remarks were reported as a plea to not look at the 2012 Farm Bill through a prism defined by budget cuts or specific programs but rather what is needed to create the best programs to meet the objectives of the legislation (Stabenow, 2011). In order to follow that advice it is necessary to first understand the broad landscape that is affected by farm bill programs. From that vantage point, this paper will focus specifically on policies directed at food and nutrition issues and the current state of the environment that will influence their development.
| Major Program Areas | Fiscal Year 2010 Spending $ Millions |
| SNAP | 68,310.0 |
| National School Lunch Program | 10,875.0 |
| WIC | 6,704.0 |
| Child and Adult Care Food Program | 2,641.0 |
| School Breakfast Program | 2,858.0 |
| Sub Total | 91,388.0 |
| Selected Additional Program Areas | |
| Nutrition Assistance for Puerto Rico | 2,001.0 |
| Entitlement Commodity Obligations for Child Nutrition | 1,304.0 |
| Elderly Nutrition Program (HHS Program) | 658.0 |
| Summer Food Service Program | 359.0 |
| The Emergency Food Assistance Program (TEFAP) | 606.0 |
| State Administrative Expenses for Child Nutritione | 146.3 |
| Emergency Food and Shelter National Board Program | 140.1 |
| Commodity Supplemental Food Program | 100.4 |
| Food Distribution Program on Indian Reservations | 112.8 |
| Fresh Fruit and Vegetable Program (FFVP) | 65.0 |
| Food Distritbution to American Indians (FDPIR) | 75.0 |
| Senior Farmers’ Market Nutrition Program | 22.5 |
| Special Milk Program | 11.9 |
| WIC Farmers’ Market Nutrition Program | 20.0 |
| Sub-Total | 4,218.0 |
| Total | 95,606.0 |
Source: USDA, Food and Nutrition Service, Program Information Report, December 2010.
SNAP total amount includes Nutrition Assistance Programs for American Samoa and the Northern Mariana Islands, as well as funding for SNAP Outreach and Participation Grants and Food and Nutrition Service Disaster Assistance.
As U.S. agricultural policy is debated in the run-up to the 2012 Farm Bill, it is time to reconsider whether our existing programs and related legislation are the right mix to accomplish the desired objectives. The starting point in this journey is clear, but often painfully overlooked is a definition of those objectives we as a nation wish to accomplish. Agricultural policy was initially designed to help deal with a number of problems related to production agriculture, including the markets for those products and the plight of rural residents. Historically agricultural policies have been justified by their contributions to food security, food affordability, nutrition, competitiveness in international trade, and as a contributor to prosperity and income growth in rural areas (Sumner and Gardner, 2007).
Over time farm legislation has evolved to include programs and policies that address a much wider array of issues than production agriculture and related markets. Indeed the majority of federal money allocated to agriculture programs is now directed toward food and nutrition programs. In Fiscal 2011 it is estimated that about 70% of USDA’s budget is to be directed to such programs, primarily the supplemental food and nutrition assistance program (SNAP), school lunch and breakfast programs; and the women, infant and children (WIC) program (USDA, OPBA, 2010). Across the federal government approximately $62.5 billion was spent in fiscal year 2008 on the 18 most prominent domestic food and nutrition programs operated by USDA and other agencies including the Department of Health and Human Services and the Department of Homeland Security (USGAO, April 2010). Most recently the major programs for the USDA have had a combined spending of $95.6 billion (Table 1). Given the predominance of federal expenditures on food and nutrition programs through USDA, a principal objective of farm policy as it exists today is to accomplish food and nutrition goals. If that is correct, there is a need to examine the main forces that will influence how those policies develop within the 2012 farm bill debate.
To gain insight regarding the forces of influence on future policies and programs it has been useful in the past to examine the current state of food insecurity in the United States; including the prevalence of nutrition/dietary problems, such as the current focus on obesity; trends in spending on food assistance; and the effectiveness of existing programs.
One of the most important elements, or at least what arguably should be, of the environment that will influence how food and nutrition assistance programs develop in the next farm bill is the current prevalence of food insecurity in the United States. How many households are having difficulty meeting basic food needs?
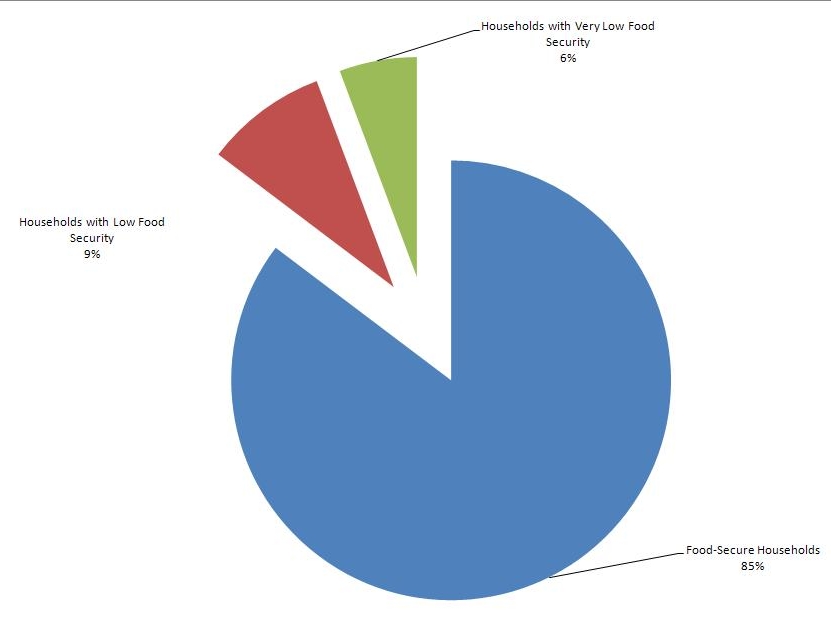
An operational measure of food security status is provided by USDA/ERS analysis of Current Population Survey Food Security Supplement data. For 2009, ERS reports that while 85.3% of U.S. households were food secure, 14.7% of U.S. households were food insecure at some time during 2009; virtually unchanged from 2008 (Figure 1; USDA-ERS, 2010). In other words, 17.4 million households in the United States experience food insecurity, involving 50.2 million people including 17.2 million children. With a population of around 308 million, about 16% of the population falls into this category. Accordingly, those elements of current USDA food assistance programs contained in the farm bill would appear to have little or no reason to be less important than they were during the debate surrounding the previous farm bill.
Food and nutrition programs in the United States are also linked to diet and chronic disease, most clearly in relation to obesity. The Centers for Disease Control and Prevention (CDC) has identified health consequences associated with obesity to include: coronary heart disease, type 2-diabetes, certain cancers, hypertension, stroke, liver and gallbladder disease, sleep apnea and osteoarthritis. The CDC reports that one third of the U.S. adult population, more than 72 million people and 17% of U.S. children are obese (CDC, 2011). During the past several decades, obesity rates for all groups have increased. In addition, the CDC reports the cost of medical care related to obesity was estimated to be $147 billion in 2008. By all accounts nutrition and dietary choices contribute to obesity, and that obesity is among the most serious health concerns in the U.S. To the extent that federal programs are justified to address public goods issues, assistance in the promotion of improved nutrition and more healthy dietary choices for those at risk would seem to qualify. In addition, it would also appear that evidence suggests a need exists in relation to food insecurity related concerns as well.
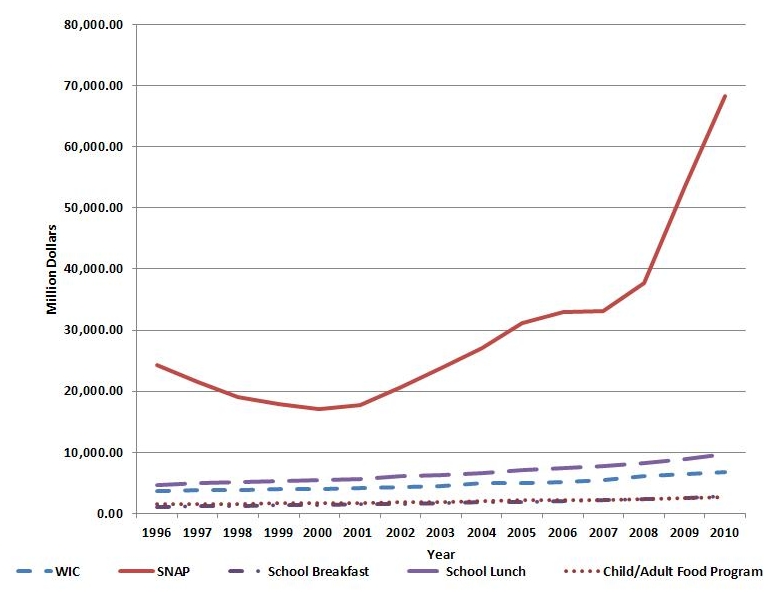
The existing programs administered by USDA have changed over time however, the five largest food assistance programs account for the majority of the funding. In fiscal year 2010 SNAP, the National School Lunch Program, WIC, the Child and Adult Food Program and the School Breakfast Program accounted for 96% of total spending on the 19 most prominent programs (USDA, December, 2010). Funding for most of these programs has remained relatively stable in nominal terms for the past 15 years, except for SNAP (Figure 2). Participation in these programs is relatively high and all but WIC are entitlement programs that require eligible beneficiaries must be served.
In the last two years, funding increases for the SNAP program largely reflected the increased need for assistance associated with the high level of unemployment. The 2009 American Recovery and Reinvestment Act provided a funding boost. But, the current budget climate seems to suggest this funding trend may be short-lived.
If current budgetary pressure continues to create a need to prioritize funding among programs, it is useful to understand how existing food and nutrition programs have performed relative to their stated goals. The first question in such an evaluation could be whether the programs are being used. The most recent reports indicate that the monthly participation in SNAP averaged 40.3 million up from 28.2 million just two years ago. On a typical school day about 31.3 million children participated in the National School Lunch Program and 11.1 million took part in the School Breakfast Program. WIC was reported to have served 9.1 million people each month. The USDA’s Food and Nutrition Service reports 3.2 million children and 112,000 adults receive assistance from the Child and Adult Care Food Program. In summary, ERS reports that at some point in the year one in four Americans participated in at least one of the USDA’s food and nutrition assistance programs. The data supports the need for, and use of, these programs by a large segment of the population. But, does participation also demonstrate that these programs are achieving their goals and objectives?
Since 1998, USDA’s Economic Research service has studied and evaluated domestic food and nutrition assistance programs and provided an annual review of their activities (USDA, 2011). ERS work sheds light on food and nutrition issues. A report by Ratcliffe and McKernan (2010) measured SNAP’s effectiveness in reducing food insecurity. Their results based on simple models show that SNAP receipts are associated with higher food insecurity. However, the results also found that SNAP receipt reduces the likelihood of being food insecure by roughly 30% and reduces the likelihood of being very food insecure by 20%. These findings provide one piece of evidence that SNAP is meeting its key goal of reducing food-related hardship.
If the obesity problem in the United States is going to be addressed, it is likely that providing healthy and nutritious diets through programs for children would be a key to success. Two separate farm bill food and nutrition programs have a unique opportunity to accomplish such a goal, the School Lunch and Breakfast programs. A study by Cole and Fox (2008) examined the diet quality of American school age children by school lunch participation status from survey data over the period 1999 -2004. The study, not designed to isolate the effects of the program, found that children that did participate in the National School Lunch Program (NSLP) had diets that were better in some ways than those who did not participate, but worse in other ways. They emphasized that these children are the prime audience for nutritional education efforts. A recent study by Fox, et al (2010) provided information on the relationship between school meal programs and diet quality of children. By using a modified version of the Healthy Eating Index (HEI -2005) the overall diet quality of participants in these programs and nonparticipants was evaluated. While researchers found no significant overall difference among the groups, once again participation in the programs were associated with positive dietary components but participants scored significantly lower than nonparticipants in other areas. At the present time it appears that there is some evidence that these programs with best of intentions have mixed results.
Is SNAP having a positive effect on curbing obesity? The USDA ERS summarized ten years of research on various aspects of food and nutrition assistance policy (USDA, ERS, 2007). In regard to SNAP and obesity, the evidence suggests that while SNAP increases expenditures for food, there remains some question whether this increase in food expenditures leads to overconsumption of calories and obesity. These concerns were based on a positive relation between food stamps and overweight and obesity in women that was observed in the late 1980s and 1990s. During the same period however it was reported that men who received food stamps tended to be lighter than either eligible nonparticipants or higher income men. More recently estimates based on 1999-2002 data show a weakening relationship between food stamp receipt and weight status (Ver Ploeg, 2006). The study revealed that among women, food stamp participants were not getting relatively heavier over time. Rather relative obesity as measured by the Body Mass Index (BMI) was reported to have grown at a more rapid rate among eligible nonparticipants—as well as women with higher incomes— and now exceeds that of food stamp participants.
Although the latest evidence seems to suggest there is no difference in obesity rates between food stamp participants and others, more research is needed to understand what factors drive obesity and to better understand what roles food assistance programs may play. Policy changes not based on sound evidence can lead to unexpected outcomes. For example, it would seem natural to make changes in SNAP policy by restricting purchases to “healthy foods”, however some suggest this may lead to unintended consequences (Alston, et al., 2009). In their research, the authors find that while program participants would likely increase their consumption of healthy food the overall impact on the purchase of unhealthy food is not clear. The increase in SNAP participant purchases of healthy food would have created upward pressure on healthy food prices and downward pressure on prices for unhealthy food. Such changes in relative prices would be expected to feed back into the purchasing patterns of participants and non-participants alike, having possible negative dietary effects. Also, the authors suggest more restrictive rules on the use of SNAP funds may discourage participation. In summary, this research suggests that changing the composition of allowable food purchases under SNAP would likely be an inefficient and ineffective targeted policy response to reduce obesity among its participants.
At the present time concerns about the budget that will be available for spending on farm programs underline most discussions about the nature of future farm bill programs. Most reports suggest that all programs and policies will be on the table for possible cutbacks. In perhaps a foreshadowing of what is to come, increased funding for SNAP is to be effectively rolled back after 2014 due to cost savings tied to legislation to save teacher and public sector jobs and shore up state Medicaid budgets (Cornfield, 2010). In this case the $26 billion in expenditures is partially offset by what would be a $12 billion rollback in SNAP funding increases. The future of SNAP funding was also called into question again when it was targeted to offset costs for the Senate Healthy, Hunger-Free Kids Act of 2010 that borrows $1.3 billion from SNAP beginning in 2013 (U.S. Government Printing Office, 2010). Most recently, President Obama’s 2012 proposed budget calls for restoring those cuts from SNAP. It assumes that all aspects of the safety net contained in the current farm bill, even the social safety net for the poor and food insecure, really are on the budgetary chopping block.
The environment within which new farm bill legislation will be debated is going to be dominated by the desire to provide a safety net for American agriculture and maintain the provision of effective food assistance programs in the face of stable to declining budgetary authority to do so. Already emerging are early signs of division among ranks regarding willingness to trade social safety net programs to preserve traditional commodity based supports, which raises questions about the future support for farm legislation. Traditionally, it has been in part the marriage between the desire to maintain food and nutrition assistance among urban legislators and the additional desire on the part of farm district legislators to maintain an effective safety net for production agriculture that has provided the support needed to pass previous farm bills. In the House of Representatives it takes 218 votes to pass a farm bill. It has been suggested that within the house there are only 50 congresspersons with sufficient rural constituency to be effectively influenced by farm interests. Some rural states, North and South Dakota; Wyoming; Montana; Vermont; and Alaska have only one congressman (Knutson, Lyons and Meilke, 1995). If it takes 218 votes to pass a farm bill, the other 168 need to come from areas with less direct connections to the interest of agriculture. If that coalition is forced to consider either/or decisions due to funding limitations, it is uncertain how long it will survive.
It may be necessary to develop alternative programs and policies that do not contain such a comingling of goals. Perhaps objectives focused on achieving specific health and nutrition targets are better achieved by delivering programs through different agencies. Other programs looking to achieve price and income security for specific industry sector participants may be better served by an agency that is more narrowly focused. As the core constituency for continued support for any specific group declines, so does its ability to maintain that support in the absence of coalition partnerships. Particularly in the face of diminishing resources and increasingly growing conflicting demands on those limited resources. It would appear the debate surrounding the next farm bill will be robust in the intensity of commitment by supporters and the diversity of the voices of distracters of the status quo in the area of food and nutrition assistance programs.
Alston, J M., Mullally, C., Sumner, D.A., Townsend, M. and Vosti, S A. (2009). Likely effects on obesity from proposed changes to the US food stamp program, Food Policy, Volume No. 34, pp 176-184.
Alston, J M (2007). Implications of a “healthier” U.S. Food Stamp Program, Presentation, International Health Economics Association, 6th World Congress: Explorations in Health, Copenhagen, Denmark.
Center for Disease Control and Prevention (2011). Obesity: halting the epidemic by making health easier, at a glance 2010, Atlanta, Georgia. http://www.cdc.gov/chronicdisease/resources/publications/AAG/obesity.htm
Cole, N., and Fox, M.K. (2008). Diet quality of American school-age children by school lunch participation status: data from the national health and nutrition examination survey, 1999-2004, Abt Associates, Inc. Nutrition Assistance Program Report Series, Report No. CN-08-NH, USDA, Food and Nutrition Service.
Cornfield, J. (2010). Food stamps help Congress pay for FMAP bill, Heraldnet, Everett, Washington, August 9, 2010.
Fox, M., Clark, M., Condon, E., and Wilson, A. (2010). Diet quality of school-age children in the U.S. and association with participation in the school meal programs, Contractor and Cooperator Report No. 59, USDA, ERS.
Edwards, C. (2009). Food subsidies, CATO Institute.
Knutson, R. D., Lyons, R.M.A. ,and Meilke, K. (1995). Proceedings of the first Canada/U.S. agricultural and food policy systems information workshop understanding Canada/United States Grain Disputes, University of Manitoba..
Ratcliffe, C. and McKernan S-M. (2010). How much does SNAP reduce food insecurity?, The Urban Institute, Washington, D. C. , March, 2010.
Stabenow, D. (2011). Focus on Principles, Not Programs in Writing 2012 Farm Bill.
Press Release, United States Senate, Washington, D.C., February 24, 2011.
Sumner, D.A., and Gardner, B. L. (2007). U.S. agricultural policy reform in 2007 and beyond American Enterprise Institute for Public Policy Research. July-August Newsletter.
United States Department of Agriculture (2007) Economic Research Service. Informing Food and Nutrition Assistance Policy: 10 Years of Research at ERS, Miscellaneous Publication No. 158.
United States Department of Agriculture U.S.D.A. (2010). Economic Research Service. Household Food Security in the United States, 2009, ERR-108.
United States Department of Agriculture U.S.D.A. (2011), Economic Research Service. The food assistance landscape,” FY 2010 Annual Report, EIB No. 6 -8.
United States Department of Agriculture U.S.D.A. (2011), Food and Nutrition Service, Child and Adult Care Food Program.http://www.fns.usda.gov/cnd/Care/
United States Department of Agriculture U.S.D.A. (2010). Food and Nutrition Service. program information report, Program Reports, Analysis Branch, December.
United States Department of Agriculture U.S.D.A. (2010). Office of Budget and Program Analysis. FY 2011 budget summary and annual performance plan.
United States Government Accountability Office (2010). Domestic food assistance: complex systems benefits millions, but additional efforts could address potential inefficiency and overlap among smaller programs, GAO-10-346.
United States Government Printing Office (2010). Public law 111-296 healthy, hunger free kids act of 2010, December, 13, 2010. http://www.gpo.gov/fdsys/pkg/PLAW-111publ296/pdf/PLAW-111publ296.pdf
Ver Ploeg, S. (2006). Food Stamps and Obesity: Ironic Twist or Complex Puzzle? Amber Waves, Vol. 4, Issue 1, USDA, ERS.

