Policymakers are typically aware of the discrepancy in broadband availability and adoption between rural and urban areas. The latest data from the National Broadband Map (NBM) suggests that while 100% of urban residents have access to at least one wired broadband provider, only 78% of rural residents do (National Telecommunications and Information Association (NTIA), 2014). This has significant implications for rural households and businesses, and the issue has received attention in the form of federal broadband grants and loans for rural populations (Kruger and Gilroy, 2013). However, one piece of the puzzle has been notably missing from discussions regarding rural broadband and future economic growth: the importance of fast, reliable internet access for growth in agricultural productivity. The rise of “precision agriculture” combined with increasing interest in the use of “telematics” and “big data” for agriculture, raises the question of how available broadband connectivity is for U.S. farms.
Broadband: A high-speed internet connection. Currently defined by the Federal Communication Commission (FCC) as 4 Megabytes per second (Mbps) download/1 Mbps upload, though thresholds have changed over time.
Wired Broadband: A broadband connection through some type of wireline provider (cable, Digital Subscriber Line, fiber). Some wired household or business connections are then routed wirelessly throughout the premise; these are still counted as wired connections.
Dial-up: Connection to the internet via a modem and telephone line; limited to 56 Kbps connection speed (and thus not broadband).
Satellite internet: Internet access through communications satellites. Speeds can reach broadband thresholds but connections sometimes have issues with latency and interference.
Mobile broadband (or wireless internet): Wireless internet access through mobile devices such as cell phones. Broadband speeds are possible depending on the cellular network used.
Cellular networks: Wireless network composed of base stations, towers, and transceivers—mobile phones. Third Generation (3G) and 4G networks are capable of delivering broadband speeds to mobile devices.
Precision agriculture: Information technology applied to agriculture. A set of spatial technologies including harvester yield monitors, GPS-enabled automated guidance, controller-driven variable rate applicators, remote sensing that provide greater control over the management of the farming operation.
Big data: A popular term used to describe the exponential growth, availability and use of information, both structured and unstructured, arising out of non-traditional analytics. Ultimately, regardless of the factors involved, the term Big Data is relative to the volume, velocity, variability, veracity, and complexity of the data utilized (Meta Group, 2001). In agriculture, usually assumed to be synonymously with “precision agriculture data”, additional distinctions can be made with respect to analytics and broader sources of data.
Telematics: Transmitting of data through wireless communication links between the home base and in field units (Heacox, 2008).
Information-intensive: strategies that depend on farm and field level data to make decisions about input application and cropping practices; and additional skills are required by the decision maker. That data may be collected manually or electronically including variable rate soil fertility management, yield monitor, and other sensor data. Integrated pest management (IPM) has been the classic example since additional crop pests information allowed managers with higher abilities to make better decisions.
Embodied knowledge: The information is purchased in the form of an input and the decision maker requires minimal or no additional skills. Automated steering and automated swatch controls are examples where the equipment operator requires less skill than without the technology. When Round-up Ready soybeans were introduced in the U.S. in the 1990s, the skill needed to successfully apply this new technology was relatively small compared to conventional production practices. The technological packages are ‘self-contained’, requiring no new equipment purchases, or additional cultivating skills.
The U.S. Department of Agriculture's (USDA) 2012 Census of Agriculture indicates that 70% of all farms have internet access, up from 57% in 2007 (USDA, 2009; and USDA, 2014a). However, a significant number of those connections were via technologies that may not be adequate when it comes to accessing and delivering the large quantities of data that are associated with some precision agriculture processes. In particular, many farmers use dial-up (7%), satellite (13%), or mobile broadband (13%)—typically via cellular networks. The Federal Communications Commission (FCC) currently defines broadband as 4 Megabytes per second (Mbps) download speed and 1 Mbps upload. The availability of broadband for farm offices and land in production has serious implications for the future of agriculture. In particular, a lack of broadband connectivity could hinder the adoption of precision agricultural processes and negatively impact any associated productivity and efficiency gains.
We take an introductory look at the connectivity available on U.S. farms by examining the broadband availability for counties with high levels of crop production. These are also the areas where precision agriculture adoption rates would be the highest; they could be the most likely to employ telematics and participate in the usage of big data in decision making initially.
Historically, farmers generally managed their crops at the field level, applying nutrients at a constant rate and analyzing data from the entire field even though they knew that not all portions of the field would perform the same. The advent of precision agriculture has shifted this paradigm and allows for crop management at a much finer level of detail. Simply defined, precision agriculture is the application of information technology to farm-level production operations and management decision making. The focus of this technology has evolved over time: from mapping site-specific soil properties, to geo-referenced yield monitors, to variable rate applications, to automated guidance and, finally, to the more recent emphasis on "big data."
The concept of precision agriculture has always been about data—particularly, site-specific decision making based on that data. To understand the evolution of precision agriculture data into “big data,” one must consider how precision agriculture can be separated into information-intensive and embodied-knowledge technologies (Griffin et al., 2004). Information-intensive technologies provide more data, such as that generated by yield monitors and grid soil sampling, but require additional management ability and analysis. The current uses of Unmanned Aerial Vehicles (UAVs), also known as drones, are another example of this type of technology, and are expected to be heavily utilized in gathering and incorporating farm-relevant data into the production process. The next generation of drone technology is expected to be more automated and passive in terms of operating equipment, processing data, and making decisions from analytics. Embodied-knowledge includes automated guidance and automated spray boom controls, requiring virtually no additional management ability to effectively use the technology.
Given the distinction between information-intensive and embodied-knowledge, the latter has substantially higher adoption levels than the former. With the proper set of automation and on-demand analytics, it is possible for an information-intensive technology to become passive with respect to human intervention and, thus, be considered embodied-knowledge. The agricultural industry not-so-patiently anticipates this development of automating the collection, processing, analytics, and decision making into the next “killer app” example of embodied-knowledge in agriculture, “big data.” Before “big data” will be widely accepted by farmers and others across the agricultural industry, its collection, processing, on-demand analytics, and decision making must become passive to the user.
“Big data” has become the buzzword due to the capabilities of precision agricultural technology. Although every “big data” spokesperson offers a definition, the notion is essentially that data generated through precision agricultural technologies in the normal course of running a farm operation can be used to improve the operation. Most of the current media buzz surrounding “big data" misleads the masses to believe that it is synonymous with precision agriculture data; however, there are clear differences but the distinction is not particularly useful in most discussions. Big data may include archiving farm-level production and meta-data across multiple years; aggregating farm-level datasets into a repository; data transfer, data conversion; data translation; data standardization; and re-combining aggregated farm data with other data that would not have substantial interpretation for a single farm such as weather, cropping history, input usage, or historical yields. By our definition, no farm-level dataset is sufficient to make use of “big data” without aggregating with other farms. It is common for the secondary use or re-use of the data to have more value than summation of primary uses by individuals. This is a leading reason for development of a new sector of the agricultural industry comprised of data service providers such as data repositories and on-demand analytics services.
Farm businesses have made increasingly more frequent use of internet services. Over the last decade, farmers went from having to deliberately acquire internet connectivity to essentially every farmer with a cellular phone having internet connectivity. Early on, farmers utilized the internet to participate in discussion forums and shop for equipment parts, while today a farmer’s use of the internet is ubiquitous. Nearly every farmer with a smart phone uses it to check weather conditions and commodity prices in near-real-time. Over the last three years, telematics have become the quintessential example of how farmers make use of the internet for precision agriculture; allowing farmers to remotely monitor their equipment and the farm workers operating the equipment, upload variable rate prescriptions to applicators, and gather real-time equipment diagnostics and site-specific sensor data.
Precision agriculture technology has been targeted to broad acre crops such as corn, soybeans, wheat, cotton, and rice rather than higher value horticultural crops; and has typically been adopted by young farmers who are college educated with a relatively higher endowment of wealth (Mooney et al., 2010; and Schimmelpfennig and Ebel, 2011). The expectation is that every new combine harvester comes with a yield monitor and most will also have a global positioning system (GPS). However, this gives no indication of the proportion that is actually utilized for anything more than in-cab entertainment for the combine operator. It is suspected that most U.S. grain farmers have a yield monitor, and we know that half of all planted corn and soybean acres were harvested with a combine equipped with a yield monitor nearly a decade ago (Schimmelpfennig and Ebel, 2011).
A more recent survey by Holland, Erickson, and Widmar (2013) indicated that telematics adoption for field-to-home office communications was one of the largest changes between the 2011 and 2013 survey of agricultural service dealerships. In 2011, only 7% of agricultural service dealers such as retailers and input suppliers offered telematics as a service compared to 15% in 2013. Holland, Erickson, and Widmar (2013) also reported that two-thirds of service providers stated telematics is perceived to be an emerging technology. Telematics not only requires farm internet connectivity with adequate bandwidth, but in order to be fully utilized that connectivity is sometimes required in non-residential areas. Without instantaneous internet connectivity, the transfer of precision agriculture data is still possible—though with additional caveats.
To better understand the use of information technology in agriculture, it is useful to consider the rapid evolution of one technology, that is, yield monitoring. Yield monitor data were originally transferred by physically removing the memory card, typically flash media such as SD RAM, from the harvester yield monitor and taken to a card reader usually connected to a desktop or laptop computer. The user instructed the computer to copy the files from the memory card to another storage media by performing a series of mouse clicks.
Given current technology, even in the absence of internet connectivity sufficient for data uploads from the field in real-time, it is possible for machine data to be wirelessly transferred to another device using personal area networks (PAN) or Bluetooth. When that device comes within internet connectivity, the data are uploaded to “the cloud.” More common, however, is the current practice of physically moving memory cards or at least performing a series of mouse clicks in order to transfer data between farm equipment and the computer or cloud. One current success story of data connectivity and precision agriculture is from the Climate Corporation which hit the 50-million-acre milestone with the freemium version of its Climate Basic online tool.
The future of the technology requires a passive process for the farm workers operating the equipment such that data will be uploaded to the cloud in real-time while the equipment remains operating in the field. This passive transfer of data will create additional efficiencies for the farming operation, decrease downtime needed to manually transfer, and minimize the human error associated with manual transfer. Thus, high-speed wireless broadband in non-residential areas is required and will be similar to cellular connectivity today.
Future precision agriculture technology requirements include the closing of the gap between upload and download speeds or, at the very least, increasing upload speeds. Pushing prescription data to application equipment—sprayer, planter, fertilizer applicator—requires considerably less bandwidth than uploading machine diagnostics to the cloud. In order for precision agriculture to become standard practice by a critical mass of farmers, data transfer must become completely automated and passive such that no human interaction is required.
County-level data from the 2012 Census of Agriculture and the 2012 National Broadband Map (NBM) were used for this analysis.
The NBM website provides basic county-level statistics on broadband availability. These statistics include the percentage of the county population with access to any broadband technology (including wireless), any wired broadband technology, and to various numbers of wired/wireless providers. It also provides data on the percentage of the county population with access to various speeds, both upload and download. The location of the population is identified as their home residence, so this statistic is not measuring the percentage of the land area in the county with connectivity.
The vast majority of the United States is shown as having at least one wireless provider—100% of urban populations, and 98% of rural (NTIA, 2014). However, as Kruger (2013) notes, only 90% of households have access to mobile wireless speeds of 3Mbps or greater, and only 78% have access to 6Mbps or greater—which are the speeds associated with 3G and 4G LTE technologies, respectively. Because there are concerns that some mobile networks may not be achieving true broadband speeds (FCC, 2012), we separate mobile wireless from other categories of broadband. For wired access, the measure of broadband used is the percentage of the county population with access to a wired internet provider that offers at least 768 Kilobytes per second (Kbps) download / 200 Kbps upload speeds.
The Census of Agriculture provides county-level data on the number of harvested acres for various crops. This includes the top U.S. commodities: corn, soybeans, wheat, hay, cotton, sorghum, and rice. The total harvested acres in these commodities sum to over 280 million, representing 89% of the total harvested cropland in 2012. We also use data on irrigated acres since irrigation can be integrated into precision agricultural processes.
We assess the relationship between crop production and the availability of broadband graphically and via simple statistics. However, meshing these county-level datasets is not the optimal way to generate a true picture of the association. This is because our measure of connectivity is focused on the proportion of people, rather than the proportion of farm and ranch land, with specific levels of connectivity. For instance, a county can be represented as well-connected in the NBM data, with 95% of its residents having wired broadband access available, but the remaining 5% of the population that is not connected could very well be farmers living in the more rural portions of the county.
Figure 1 overlays harvested acres of wheat and corn with county-level wired broadband access as of 2012. Figure 2 does the same, but for wireless, typically mobile, broadband.
|
Figure 1: Wired Broadband
Availability for Corn and Wheat Production, 2012 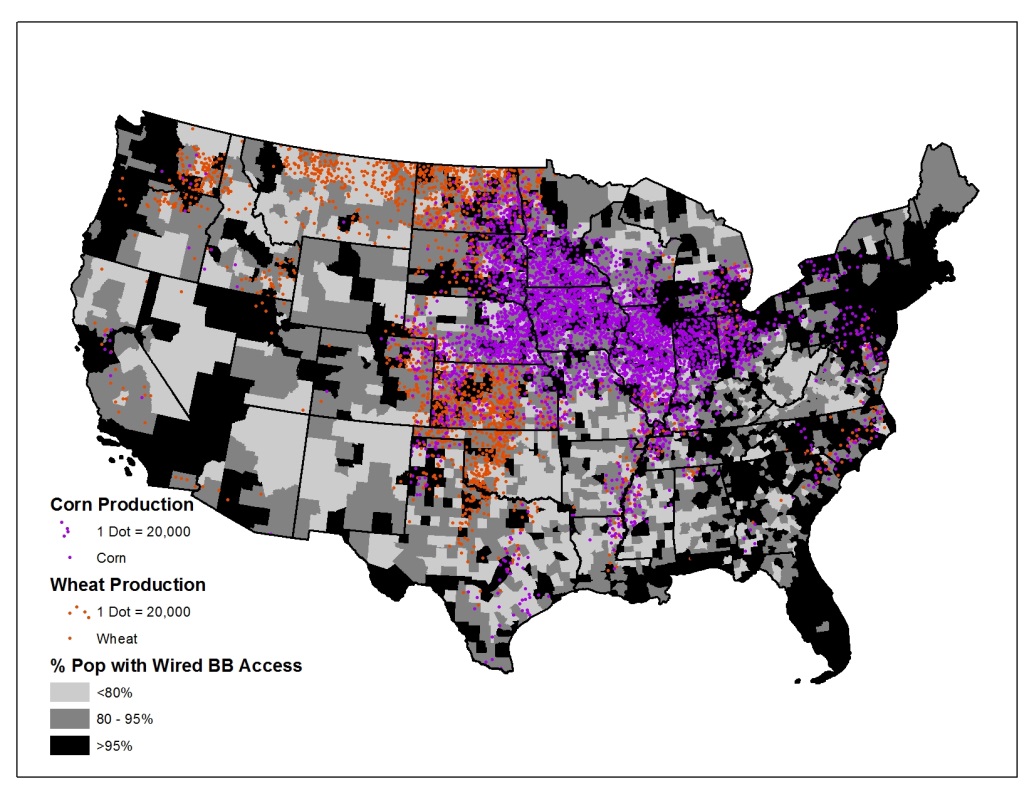
Source: National Broadband Map; |
Figure 2: Wireless Broadband
Availability for Corn and Wheat Production, 2012 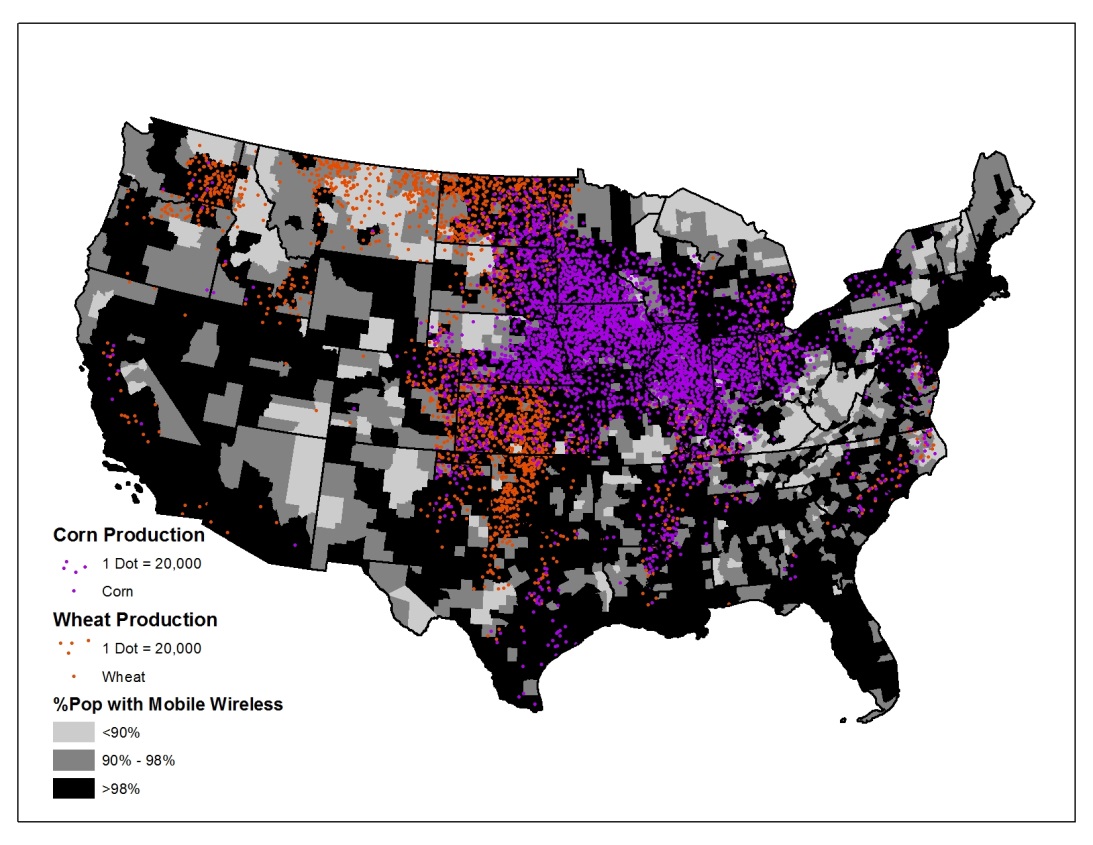
Source: National Broadband Map; |
Two general trends can be observed from Figures 1 and 2. First, high levels of wireless access are much more prevalent than high levels of wired access. Second, counties with significant numbers of harvested wheat and corn acres seem to be relatively well connected, particularly via wireless broadband. While some counties with wheat production in states such as Idaho and Montana have relatively low mobile wireless availability, the vast majority of corn and wheat production acres across the rest of the nation appear to be in counties which have mobile broadband access for over 98% of their populations.
Figures 3 and 4 look at another important issue for precision agriculture, namely speed availability. Figure 3 overlays the harvested irrigated acres with the prevalence of 10 Mbps download speeds. Figure 4 overlays total production acres, all row crops, with the percentage of the population with access to 3 Mbps upload speeds.
|
Figure 3: Availability of 10MB
Download speeds and Harvested Irrigated Acres, 2012 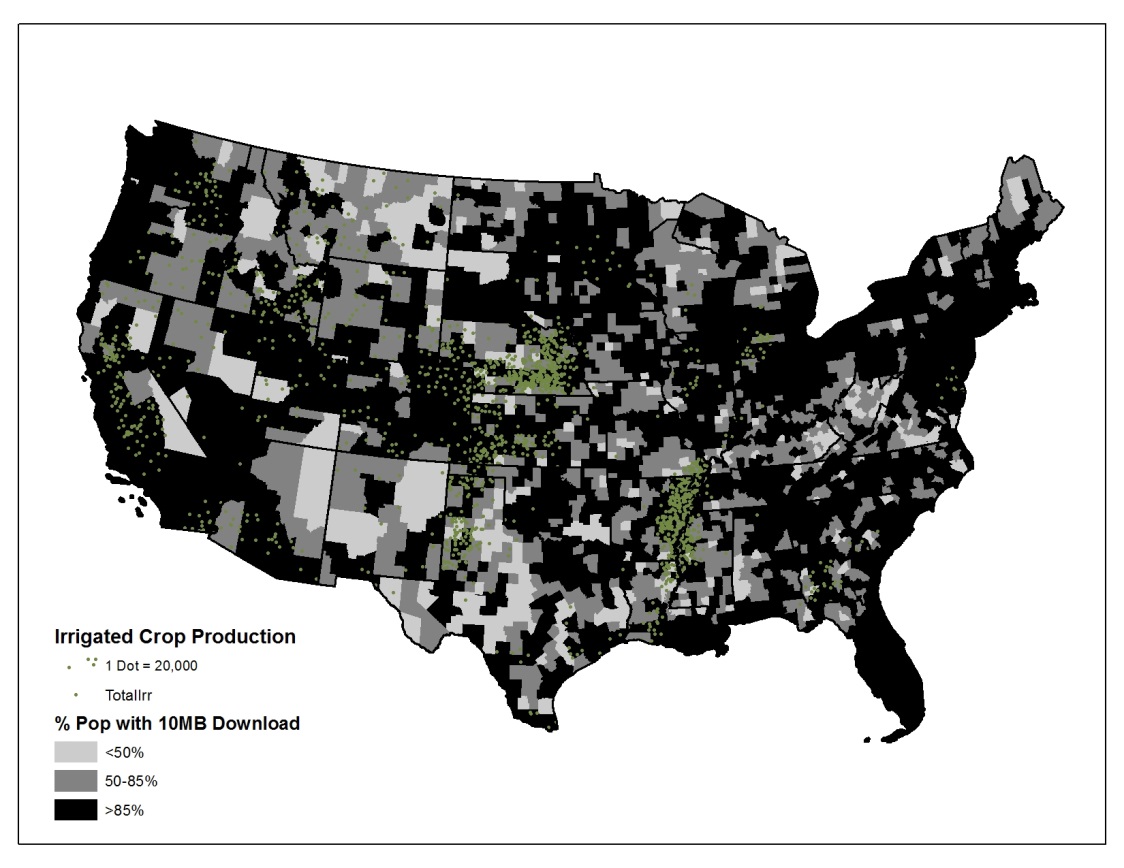
Source: National Broadband Map; |
Figure 4: Availability of 3MB Upload
speeds and Total Harvested Acres (Row Crops), 2012 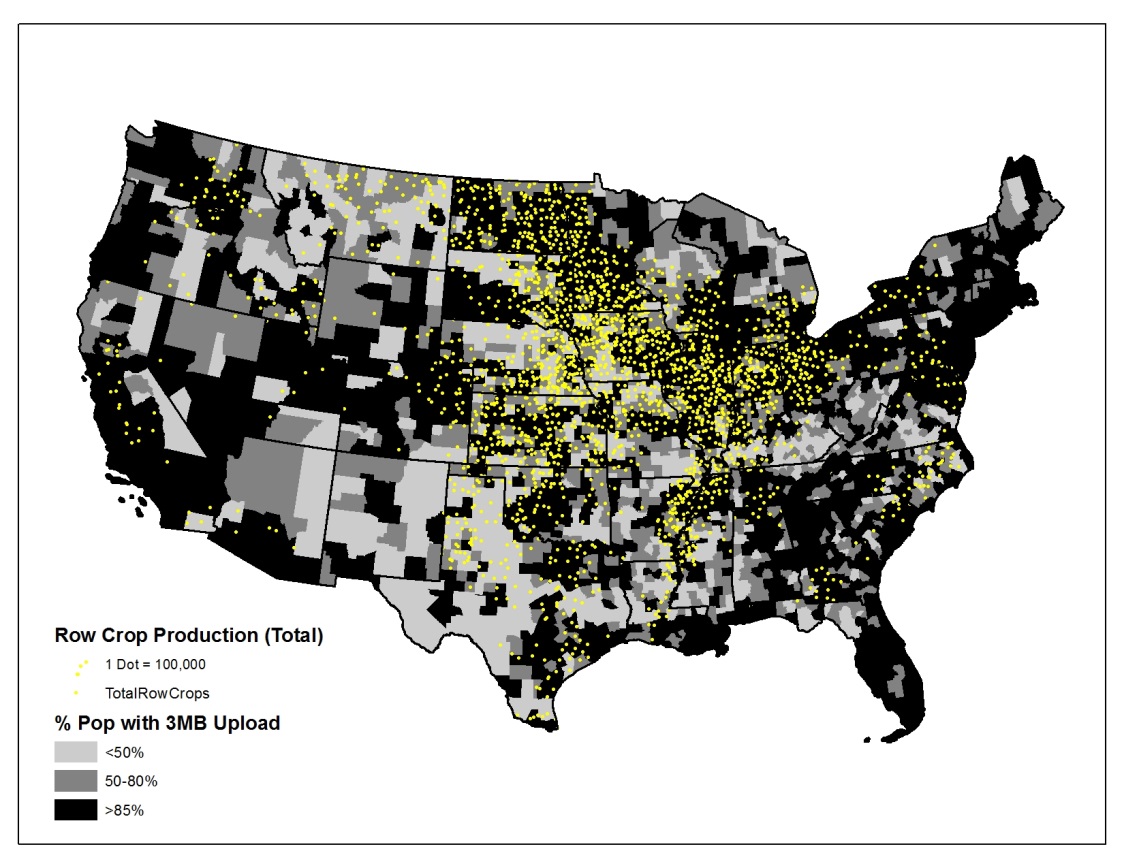
Source: National Broadband Map; |
Figures 3 and 4 demonstrate that both higher upload and download speeds are not nearly as prevalent as the base definition of broadband of 768 Kbps down and 200 Kbps up used in Figures 1 and 2. They also show that access to faster upload speeds may be an impending issue as precision agriculture techniques shift towards having farm machinery send data to the cloud in real time. In particular, counties with significant harvested acres in states such as Texas, Nebraska, Missouri, Iowa, and Kentucky appear to have very limited access to 3 Mbps upload speeds, with less than 50% of the population having such availability in many cases. As opposed to previous technology adoption that depended on a given farmer’s willingness or ability to invest, broadband adoption is externally constrained and potentially limits all farmers in a geographic area. Localized broadband coverage is analogous to commodity basis and comparable to the efficiency differences between farmers given their geographic location. As with other agricultural efficiencies, the ultimate value capture is in land values and, thus, rental rates. Although it is not currently suspected that broadband access directly impacts farmland values, these financial impacts are likely to be capitalized into values once the "big data" system is operational.
The above trends and other relevant statistics are summarized in Table 1, which details the relative connectivity of counties with harvested acres for the dominant U.S. crops. The connectivity measures in Table 1 are weighted by harvested acres so that counties with just a few production acres are discounted compared to others with higher levels of production.
| All Counties | All NM Counties | Any Crop Production | Corn | Soybeans | Wheat | Hay | Cotton | Sorghum | Rice | Any Irrigated | |
| Avg Population | 100,087 | 24,945 | 59,279 | 54,638 | 51,911 | 42,470 | 84,544 | 94,613 | 91,488 | 57,307 | 83,498 |
| % Pop with No Wired BB Available | 11.2% | 13.9% | 10.7% | 9.6% | 9.8% | 11.5% | 12.5% | 12.6% | 10.8% | 12.3% | 12.5% |
| % Pop with No Wireless Available | 1.3% | 1.8% | 0.3% | 0.1% | 0.1% | 0.6% | 0.8% | 0.1% | 0.1% | 0.0% | 0.3% |
| % Pop with 3+ Wired Providers | 22.5% | 15.1% | 20.8% | 23.9% | 23.8% | 16.3% | 18.3% | 15.5% | 9.3% | 7.1% | 20.9% |
| % Pop with 3+ Wireless Providers | 78.1% | 70.4% | 83.0% | 87.9% | 87.3% | 74.5% | 75.8% | 83.3% | 85.9% | 89.5% | 85.5% |
| % Pop with 10+MB Down | 82.1% | 75.9% | 86.1% | 88.8% | 89.1% | 81.6% | 81.6% | 82.4% | 88.2% | 91.4% | 85.6% |
| % Pop with 3+MB Up | 73.6% | 64.2% | 77.4% | 80.6% | 80.7% | 75.0% | 72.3% | 62.6% | 73.7% | 78.5% | 70.2% |
| % Pop with Fixed Wireless Available | 44.7% | 45.9% | 62.4% | 68.5% | 63.6% | 64.2% | 48.8% | 53.7% | 75.2% | 57.7% | 67.6% |
| Total Acres | 280M | 87M | 76M | 49M | 52M | 9.3M | 5.1M | 2.6M | 37M | ||
The statistics displayed in Table 1 demonstrate that, on aggregate, the counties with harvested acres seem to be better connected than the average non-metropolitan county and, in many cases, better connected than the average for all counties, including metropolitan ones. Note that 74% of all production acres are found in non-metropolitan counties. The average non-metropolitan county percentage of the population without access to a mobile wireless provider is 1.8%, but for counties with any type of production this measure falls to 0.3%. Similarly, the average non-metropolitan county has 75.9% of its residents with access to 10 Mbps or greater download speed. For counties with corn, soybeans, sorghum, or rice production, however, the number is closer to 90%. These patterns generally hold for most crops, although there are some that demonstrate lower levels of connectivity. Counties producing sorghum and rice, for example, have very low percentages of residents with access to more than three wired providers. Further, while Figure 4 suggests that access to fast upload speeds may be an issue, Table 1 shows that overall access to 3 Mbps upload speeds is generally more prevalent in crop-producing counties when compared to the non-metropolitan average. This does point out, however, that the aggregate measures demonstrated in Table 1 may mask significant problem areas in specific states.
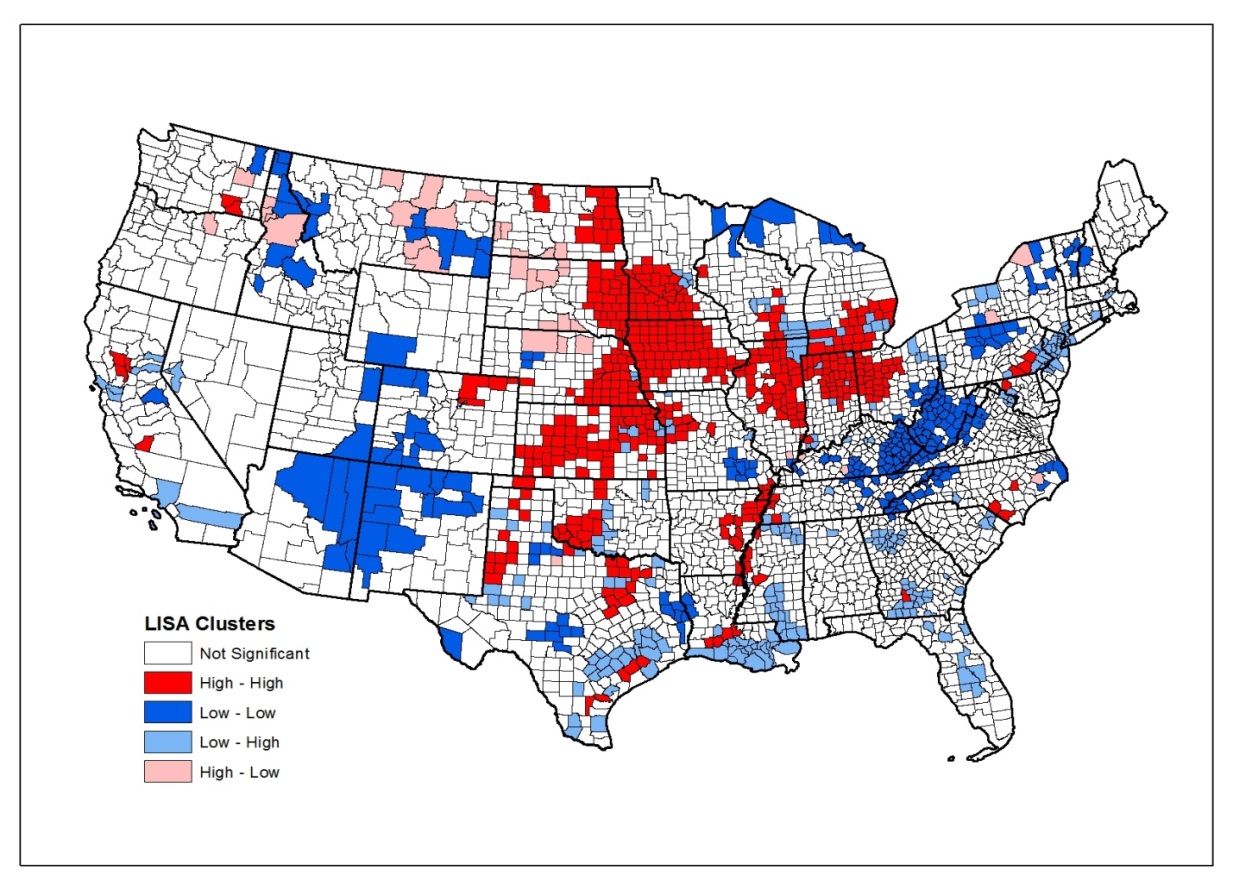
Note: The relationship between total
crop production and any wired
access is spatially clustered, Moran’s
I = 0.038 and p-value = 0.003, although
relatively small in value. As expected,
the relationship betweentotal crop
production and wireless access
has greater spatial clustering, Moran’s
I = 0.168 and p-value <0.000, than wired
access due to agricultural production
occurring away from population centers
where wired access is concentrated.
A Local Indicator of Spatial Association (LISA) map makes this point clear by highlighting areas with significant relationships between agriculture production and wireless broadband (Figure 5). In most of the agriculturally productive regions in the United States, counties with high levels of crops are surrounded by counties with high levels of wireless access as indicated by the “High-High” clustering in the LISA map and depicted as dark red in Figure 5. By contrast, very few counties have high crop production with low levels of wirelessly connected neighbors, the light red category. Areas with low productivity and high wireless connectivity tend to be metropolitan areas, light blue. A few significant “Low-Low” clusters (counties with low crop productivity surrounded by counties with low wireless connectivity) exist in the unpopulated areas of the desert west and forested Appalachia. Thus, the LISA map generally supports the results from our simple analyses that counties with significant acres of crops in production are in areas with relatively high levels of broadband.
While it appears as though counties with significant numbers of acres in production are relatively well connected, via both wired and wireless technologies, a closer look is required to determine whether this relationship actually holds for the acres themselves—or if it is simply a byproduct of having well-connected cities close to those acres. This type of detailed analysis will need access to maps of actual farm and acreage locations, suggesting that the USDA Farm Service Agency could be useful partners. The Census of Agriculture data also has more detailed geographic information available through USDA's National Agricultural Statistics Service (NASS); however, it is unclear if this is sufficient or if an even finer level of geography is required.
Many organizations are taking note of the importance of this topic. In April 2014, the Council on Food, Agricultural and Resource Economics (C-FARE) held the Inaugural Jon Brandt Policy Forum with invited speakers from across industry and government to discuss how publicly available data and private data fit together. Future meetings are expected to be convened that address the use and potential benefits of "big data" but also on the external factors limiting it from achieving its potential such as the lack of broadband connectivity discussed in this article.
Precision agriculture will be an important part of the future of agricultural production in the United States. A key question that is yet to be fully addressed deals with the issue of data privacy. A recent American Farm Bureau Federation (AFBF) survey on "big data" showed that 50% of the respondents indicated they would be investing in new data technologies and 82% are unaware of how the collected data will be utilized (AFBF, 2014b). In January 2014, Bob Stallman, president of the American Farm Bureau Federation (AFBF), provided guidance to and on the behalf of U.S. farmers over their concerns of “data privacy, ownership, and use in agricultural production” (AFBF, 2014b). Along with his statement, AFBF released its Official Policy Number 536 on Proprietary Data stating the AFBF position is that any data generated at the farm level is owned by the farmer. One potential way for farmers to feel protected is if federal and state legislation regarding data privacy, ownership, use, and recourse preserve the rights, freedoms, and privacy of farmers. The position of the AFBF essentially desires legislative blessing while requesting that federal agencies not serve as the data repository due to Freedom of Information Act (FOIA) issues. The AFBF document “Ponder These Nine……Before You Sign: Data Privacy Expectation Guide” goes into more detail about questions farmers should ask before entering into any legally binding agreements (AFBF, 2014a). Data repositories fitting the criteria set forth by Farm Bureau, as well as meeting basic criteria of successful repositories in other industries, have already started popping up. The Grower Information Services Cooperative (GISC) is an example of a data cooperative originally specializing in information services across all aspects of farm management. GISC encourages farmers to organize together to proactively form a farmer-owned data repository to empower them to control who and when their data is shared. GISC has enrolled farmers from 24 states. As broadband connectivity improves both in speed and coverage area, the use of "big data" in agriculture will become more prevalent to the point of being passively used on an almost continual basis; and data privacy issues will become ever more important to the farmer and other entities across the agricultural industry.
The AFBF is not the only group systematically addressing data privacy and standardization issues. Both AgGateway (2014) and Open Ag Data Alliance (2014) have addressed these issues from a multi-entity approach across the agricultural industry while keeping farmers’ interests in mind. The balance between open data and privacy is at competing ends, and the USDA NASS Crop Land Data Layer, also called CropScape (USDA, 2014b), is a prime example. Using 30-meter satellite imagery, CropScape data provide information on the specific crops grown across the United States. Obtaining this information would have historically required driving down each county road in the country; however, it is now easily accessible for public use. Weighing the benefits of this type of access versus the individual farmer’s privacy concerns will be at the heart of the adoption decision for many hesitant farmers.
In addition to privacy, other societal-level benefits of “big data” impact the participation decision. Precision agriculture has not been considered scale-neutral technology because of the required investments in both equipment and human capital; however, “big data” provides farmers of all size classes an opportunity to participate in community-based analytics. Even small acreage farms can participate in these communities where on-demand analytics is embodied-knowledge and requires no additional investments at the farm level. Big data has huge implications for environmental stewardship. An example of the secondary re-use of farm-level data may be proactive reporting regarding application of environmentally responsive rates of chemical fertilizers and to document that any individual farmer was not over applying chemical or organic fertilizers. Alternatively, big data also provides opportunities to conduct regional assessments to test when farming practices have any adverse impact on the environment.
As the technologies and data requirements associated with precision agriculture continue to grow, it will be vital to understand the demands being placed on the local broadband network. Policymakers should be aware of the current broadband requirements for precision agriculture techniques while also keeping an eye towards what future applications may need. It seems strange to suggest that future broadband policies might emphasize providing infrastructure for less populous locations when there are still a significant number of Americans who do not have broadband available to them. Economically, however, the optimal allocation of those resources will depend on the objectives of the policy. Specifically, if the policy is focused on providing broadband access to as many unserved rural residents as possible, the extremely low population locations are unlikely to be served. If the policy is, instead, focused on optimizing the overall value added to the economy by potential use of the technology, then subsidized access in low-population yet high-production locations may be a reality.
AgGateway. 2014. “Draft Data Privacy and Use Whitepaper.” June 12,2014. Available online: http://www.aggateway.org/WorkingGroups/Committees/DataPrivacySecurityCommittee.aspx
American Farm Bureau Federation (AFBF). 2014a. “Ponder These Nine…Before You Sign.” Washington, D.C. Available online: https://docs.google.com/viewer?url=http%3A%2F%2Fwww.fb.org%2Fnewsroom%2Fnr%2Fnr2014%2F01-31-14%2Fprivacy13a1220.doc.
American Farm Bureau Federation (AFBF). 2014b. “American Farm Bureau Survey Shows Big Data Use Increasing, Big Questions Remain.” Washington, D.C. Available online: http://www.fb.org/index.php?action=newsroom.news_article&id=178
American Farm Bureau Federation. 2014b. “Statement by Bob Stallman, President, American Farm Bureau Federation, Regarding the Relationship Between Farmers and Agribusiness About Big Data.” Washington, D.C. Available online: http://www.fb.org/index.php?action=newsroom.news&year=2014&file=nr0131b.html.
Anselin, L. 1988. Spatial Econometrics: Methods and Models, Kluwer Academic Publishers, Drodrecht, Netherlands.
Anselin, L. 1995. “Local Indicators of Spatial Association - LISA.” Geographical Analysis, 27, 93-115.
Cliff, A.D. and J.K. Ord. 1981. Spatial Processes: Models and Applications. London: Pion.
Federal Communications Commission. 2012. “Eighth Broadband Progress Report.” Washington, D.C. Available online: http://www.fcc.gov/reports/eighth-broadband-progress-report
Griffin, T.W., J. Lowenberg-DeBoer, D.M. Lambert, J. Peone, T. Payne, and S.G. Daberkow. 2004. “Adoption, Profitability, and Making Better Use of Precision Farming Data.” Department of Agricultural Economics, Staff Paper #04-06, Purdue University, West Lafayette, Ind.
Heacox, L. 2008. “Time for Telematics.” CropLife. Sept. 10. http://www.croplife.com/equipment/precision-ag/time-for-telematics/
Holland, J.K., B. Erickson, and D.A. Widmar. 2013. 2013 Precision Agricultural Services Dealership Survey Results. Available online: http://agribusiness.purdue.edu/files/resources/rs-11-2013-holland-erickson-widmar-d-croplife.pdf
Kruger, L. 2013. The National Broadband Plan Goals: Where Do We Stand? Federal Assistance Programs. Congressional Research Service Report, Washington, D.C. R43016. Available online: http://fas.org/sgp/crs/misc/R43016.pdf
Kruger, L. and A. Gilroy. 2013. Broadband Internet Access and the Digital Divide: Federal Assistance Programs. Congressional Research Service Report, Washington, D.C. RL30719. Available online: http://fas.org/sgp/crs/misc/RL30719.pdf
Meta Group. 2001. “3D Data Management: Controlling Data Volume, Velocity, and Variety.” Available online: http://blogs.gartner.com/doug-laney/files/2012/01/ad949-3D-Data-Management-Controlling-Data-Volume-Velocity-and-Variety.pdf
Mooney, D.F., R.K. Roberts, B.C. English, D.M. Lambert, J.A. Larson, M. Velandia, S.L. Larkin, M.C. Marra, S.W. Martin, A. Mishra, K.W. Paxton, R. Rejesus, E. Segarra, C. Wang, and J.M. Reeves. 2010. “Precision Farming by Cotton Producers in Twelve Southern States: Results from the 2009 Southern Cotton Precision Farming Survey.” Department of Agricultural and Resource Economics, Report no. 10-02, University of Tennessee, Knoxville, Tenn.
National Telecommunications and Information Association (NTIA). 2014. Broadband Statistics Report: Broadband Availability in Urban vs. Rural Areas. Data as of June 2013. Report in conjunction with the National Broadband Map. Available online: http://www.broadbandmap.gov/download/Broadband%20Availability%20in%20Rural%20vs%20Urban%20Areas.pdf
Open Ag Data Alliance. 2014. “OADA Data Privacy and Use.” V. 1. August 13.2014. Available online: https://docs.google.com/document/d/1VEStM7_zRfNrRnZtYmCiVfDD2T35wvJZXyQkgPm9FDE/edit?usp=sharing.
Schimmelpfennig, D., and R. Ebel. 2011. On the Doorsteop of the Information Age: Recent Adoption of Precision Agriculture. U.S. Department of Agriculture, Economic Research Service, Washington, D.C. Available online: http://www.ers.usda.gov/publications/eib-economic-information-bulletin/eib80.aspx#.U1-rUPldVyw
U.S. Department of Agriculture. 2009. 2007 Census of Agriculture. National Agricultural Statistics Service, Washington, D.C. United States Summary and State Data, Volume 1. Report AC-07-A-51.
U.S. Department of Agriculture. 2014a. 2012 Census of Agriculture. National Agricultural Statistics Service, Washington, D.C. United States Summary and State Data, Volume 1. Report AC-12-A-51.
U.S. Department of Agriculture. 2014b. CropScape. National Agricultural Statistics Service, Washington, D.C. Available online: http://nassgeodata.gmu.edu/CropScape/.

