For researchers studying demographic trends in farming, the number of women participating in agriculture in the United States has posed a series of contradictions. On the one hand, results from the U.S. Department of Agriculture (USDA) Census of Agriculture have suggested a sharp increase in women working as farmers. For example, in a report from the 2012 Census, researchers announced that “nearly 1 million women are working America’s lands. That is nearly a third of our nation’s farmers. Together, these women are generating $12.9 billion in annual agricultural sales” (https://newfarmers.usda.gov/women-in-ag). And yet, using the same data, other researchers have suggested that women’s participation in farming is much smaller, perhaps even shrinking, noting that “farms with women principal operators decreased 6 percent between 2007 and 2012” accounting for just “3 percent of sales” and merely “14 percent of the nation’s…principal operators.”
These contradictions are a result of complicated and, at times, confusing terminology used in the Census of Agriculture. They are also the result of changes in how data about farmers have been collected from one census to the next. This article attempts to bring needed clarity to the nature of the data collected in the Census of Agriculture. We aim to help researchers, journalists, and policy makers make more accurate claims about the demographics of U.S. farmers, especially concerning sex.
An example elucidates the importance of these changes over time. Imagine a farm in 1978 run by two generations of a family. Both are married, heterosexual couples: a mom and dad plus a son and a daughter-in-law. In 1978, one person—likely the father—would be listed as the “farm operator.” For the first time, we can know the sex of that farmer and begin to have data on the gender of farmers in the United States. Each time the census is sent to that farm through 1997, a single person is reported as the farm operator, and we have access to the demographic data (including age, race, sex, and Hispanic origin) on that farmer. The aging of the farming population became a major concern precisely because of these new Census data gave us better insights into farmer demographics.
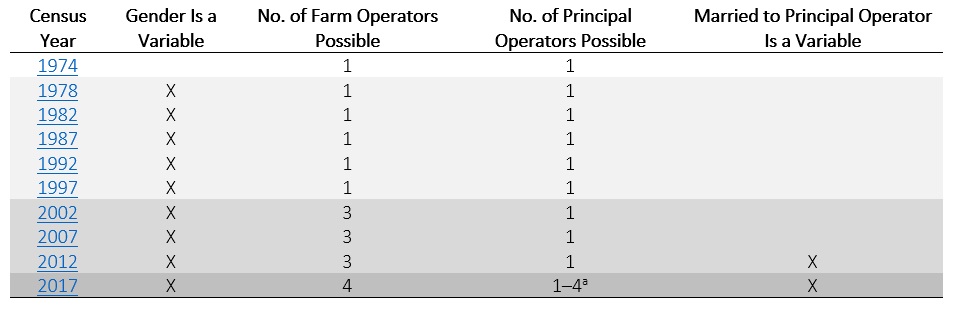
Notes: Each year in the Census Year column hyperlinks to a
document containing the questionnaire/report form for that
year’s Census of Agriculture.
a In 2017 “Principal Operator” was replaced by “Principal
Producers.”
However, starting in 2002, the census changes and allows for up to three operators. In the family listed above, they would likely register “dad,” “mom,” and “son” as the “farm operators” and continue to select the father as the “principal operator.” However, in 2017, that same family could list all four of the members as “farm operators” and—most importantly—could select up to all four as “principal producers.” Therefore, this farm might list dad, mom, son, and daughter-in-law as farm operators and dad, mom, and son as principal producers. This change in how the data were collected makes it appear that there were more women operators, and more women principal producers, on the farm, while in reality, the mom and daughter-in-law could have been contributing to the farm in exactly the same way for decades. In addition, these changes make it appear that the average age of the farmers on has farm decreased. It is worth noting that more and younger farmers are both politically popular findings. Thus, it seems that significant demographic shifts took place between 2012 and 2017 on this farm when in actuality, no shift took place—rather, data collection became richer and more accurate.
This clarification—including Table 1, which outlines various terms used and changes made in the Census of Agriculture over the years—will help researchers and other constituencies use census data to make more knowledgeable comparisons over time, especially concerning women’s participation in U.S. agriculture. As this paper will explain, the complexities of the data collection and organization used in the Census of Agriculture make accurate comparisons from the 2017 Census of Agriculture about the number of women farming in the United States nearly impossible.
One of the most common issues with the reporting of data by journalists and researchers is a misunderstanding of the terms “farm operator(s)” versus “principal farm operator(s).” The USDA definition of these terms does not clearly distinguish a difference, defining both under a single heading, “Farm Operator and Principal Farm Operator.” The USDA notes that a farm operator is “the person who runs the farm, making day-to-day management decisions…In the case of multiple operators, the respondent for the farm identifies the principal farm operator during the data collection process” (USDA, 2019, paragraph 3). In other words, the census does not clearly define the difference between a farm operator and a principal farm operator, merely stating that in the case of multiple operators, the farm should select one farmer as the “principal” for the purpose of data collection.
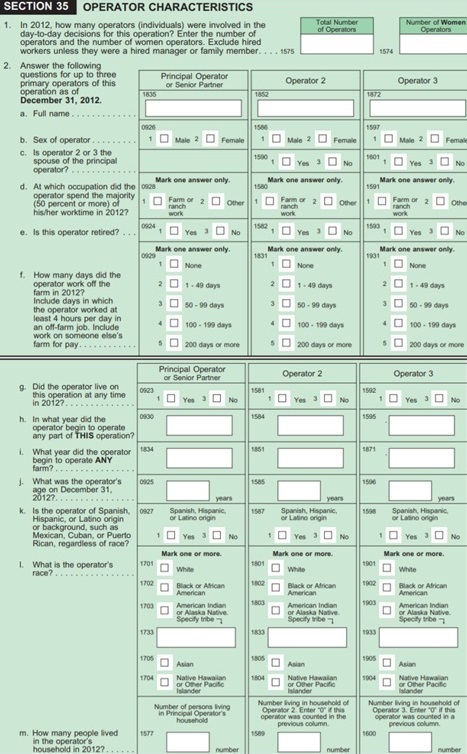
Source: U.S. Department of Agriculture (2012).
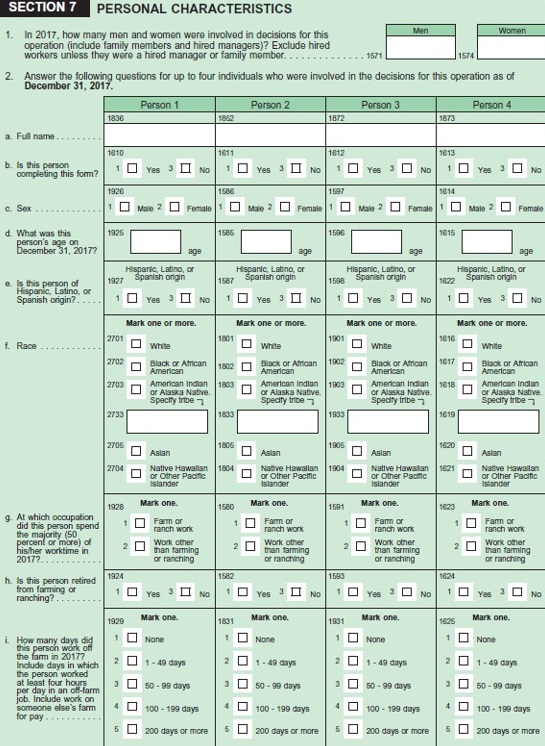
Source: U.S. Department of Agriculture (2017).
Source: U.S. Department of Agriculture (2017).
While race had been a variable on the Census of Agriculture since 1900, gender and Hispanic ethnicity only became variables starting in 1978. From 1978 through 1997, the Census of Agriculture allowed only one “farm operator” for each farm or ranch in the United States. Hence, the number of farmers and the number of farms was a 1:1 ratio, making it relatively easy to compare operators’ demographics across time.
Starting in 2002 and continuing in 2007 and 2012, the census allowed for up to three “farm operators” to be listed for every farm (see Figure 1). Each farm was required to designate one operator as the “principal” operator. Therefore, while the number of farm operators listed in the census rapidly increased in this period, the “principal operator” for each farm remained a 1:1 ratio. This explains the seeming contradiction that in 2012, women were both 14% of principal farm operators and 33% of U.S. farmers and ranchers.
Another essential addition to the 2012 Census was a question asking whether either of the two “non-principal” farmers was married to the principal—for the first time, the marital status of two farmers on the same farm could be determined. This question was repeated in the 2017 Census, which—combined with the legalization of same-sex marriage in 2015—made it possible for the first time to determine (albeit in a limited way) a proportion of LGBT farmers by identifying “women married to women” and “men married to men” operators as long as they worked on the same farm.
The most significant and challenging changes in the data to understand are those from the 2017 Census, which make a direct comparison between this census and the 2002-2012 Censuses very difficult. Starting in 2017, respondents could list up to four farm operators per farm (see Figures 2 and 3), an increase from the previously allowable three farm operators per farm. Thus, the number of farm operators increased from 3,180,074 in 2012 to 3,399,834 in 2017, while the number of farms decreased from 2,109,303 to 2,042,220 in the same period. Additionally, starting in 2017, on any one farm, zero to four of those operators could be selected as a “principal operator.” This completely altered the nature of this variable, which for decades had indicated one single principal operator per farm. In other words, in the 2017 Census, a single farm might have four “farm operators” (versus three previously), and any or all of those operators could also be listed as a “principal operator.” As such, the term “principal operator” is not interchangeable across the 2017 and previous Censuses.
This change in 2017 in the way that “principal operators” are counted was well-intentioned; it was envisioned as a way to create a more accurate presentation of the farms in the United States. As Beach (2013), Bell et al. (2004) and Brasier et al. (2014) note, women are much less likely to identify themselves as “farmers,” even when they are doing critical work on a farm. Thus, the 2017 data likely achieves its goal and is a better representation of farmer demographics and the composition of U.S. farms and ranches. However, this progress eliminates the ability to accurately estimate trends in the number of women operators and principal operators in the United States over time using previous censuses. The result is that researchers, journalists, and policy makers must be cautious making claims comparing farmer demographics from the 2017 Census. In other words, we know that the way the data was collected changed, but we cannot necessarily see how the composition of U.S. farmers changed over this period. Therefore, we cannot know if the decline of women as both “operators” and “principal operators” in the 2012 Census of Agriculture—the first time this has happened since the Census began collecting demographic data about the sex of farmers in 1978—was an anomaly or whether it marked the first point in a downward trend.
Incorrect comparisons between the 2012 and 2017 Censuses have produced misleading articles that overestimate women’s success in agriculture. For example, an article in Successful Farming titled “Ag Census: Producers Get Older, Number of Female Farm Owners Tops 1 Million” highlights that, in 2017, “more women also have become principal producers. About 1.23 million females were principal operators in 2017, up from 969,672 in 2012, marking the first time the figure has topped 1 million, according to government data” (Dreibus, 2019). The data from the 2017 Census were only released on April 11, 2019, yet already they are being used to highlight the growing success of women in farming. For instance, Messina (2019) notes that “between 1997 and 2017, the number of women serving as the principal producers on U.S. farms grew from 209,700 to 766,500, according to the latest U.S. Department of Agriculture’s (USDA) 2017 Census of Agriculture.”
Despite these headlines, knowing what direction the trends for women in agriculture have taken since 2012 (or 1997) is simply not possible with the data that were collected. The number of women reported in the 2017 Census increased because of changes in how the census was written (allowing the reporting of a fourth operator and multiple principal operators). It may have also increased because the number of women in farming increased, but it is not possible to know this for sure. For example, it is possible that the number of women in agriculture decreased between 2012 and 2017, with the changes in the census data obscuring that decrease.
Further, without understanding the changes in the 2017 Census, there is likely a significant overestimation of women’s success in agriculture. For instance, Fremstad and Paul (2016) found in their analysis of the 2012 Census of Agriculture, “Assessing full-time farmers, we show that farms operated by women earn much lower farm incomes than farms operated by men, such that the gender gap in agriculture is amongst the largest in any occupation.” With the difficulty of identifying who the principal farm operator is in the 2017 Census, a similar assessment of this most recent data might conclude that farms operated by women now earn farm incomes much closer to those of farms operated by men; however, this may be because women can now be listed as principal operators on farms where men are also listed as principal producers. The general rush to proclaim the triumphant success of women farmers is not merely inaccurate: It could hurt women’s chances of succeeding in agriculture by pulling educational programming targeting them as an underrepresented group.
There are three main ways to access USDA Census of Agriculture data:
Despite the challenges of comparing demographic trends across time, researchers can answer other important questions about demographic trends in farming using the Census of Agriculture data. Comparisons across periods, however, should be used only with appropriate caveats, as outlined above.

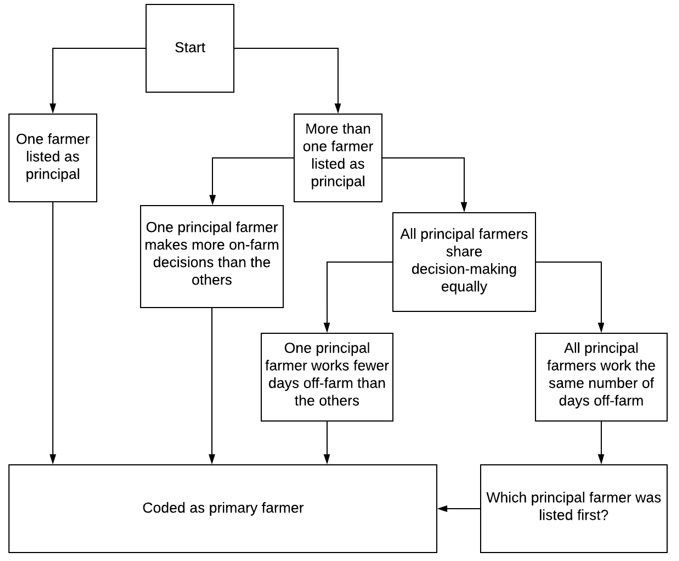
Source: U.S. Department of Agriculture (2017).
It is possible for researchers who access the full datasets to compare across time to a certain extent. To account for the incompatibility of the “principal operator” variables in the 2017 and earlier censuses, the USDA created a variable termed “primary producer.” This variable is calculated from 2017 Census data and is intended to be comparable to the previous years’ “principal operator” term. Specifically, “primary producer” (see Figure 4) is coded using if/then statements based on who makes the most decisions on the farm, followed by who works the fewest days off the farm, and finally implementing a tiebreak based on the order in which producers are listed.
While this variable is intended to be directly comparable to “principal operators” from previous censuses, there are some issues with this comparison. In particular, in past census years, operators self-designated principal operators. In the 2017 coding scheme, principal producers are determined objectively (i.e., the actual farmers are not involved in the assignment). Therefore, some producers who do not consider themselves principally farmers, or who are not considered principal farmers by the individual completing the survey, would not have been listed as such before 2017 but may nonetheless be designated a principal producer using the 2017 coding. This is especially relevant for women farmers, who research shows may not apply the label “farmer” to themselves despite being closely involved with the farm operation (Beach, 2013; Bell et al., 2004; Brasier et al., 2014). Therefore, the most accurate way to compare principal operators would be to apply the same coding that was used for the 2017 Census across all years. Unfortunately, this is not directly possible as 2017 was the first year in which detailed questions were included about the on-farm decision making of each operator.
The changes in data collection in the 2017 Census of Agriculture make comparison difficult with the previous censuses. Specifically, in 2017, the Census of Agriculture allowed for up to four operators to be reported, all of whom could be designated as a principal operator. This is a departure from previous years; from 1974 to 1997, only one operator could be listed, while from 2002 to 2012, three operators could be registered, with only one of these designated as the principal operator.
Although the changes in the 2017 Census represent a better understanding of farmer demographics and the composition of U.S. farms and ranches, these modifications reduce the ability to estimate trends accurately using previous data. Also, it had been the source of misleading articles that incorrectly compare the 2012 and 2017 Censuses and potentially overestimate women’s success in agriculture.
To compare the “principal operator” variable from the 2002–2012 Census with the “primary producer” variable from the 2017 Census, the USDA created an algorithm based on who makes more decisions and work more days on the farm. While this new variable helps resolve the problem, they are not directly comparable. In past census years, operators self-designated principal operators. In the 2017 coding scheme, principal producers are determined objectively.
As a result, researchers, journalists, and policy makers must be cautious in making claims comparing farmer demographics from the 2017 Census with previous censuses. Also, they should make comparisons across periods and present their results with appropriate caveats.
Changes to the 2017 Census of Agriculture offer us the most comprehensive and detailed look we have had at U.S. farmers and ranchers; however, these changes also mean it is simply not possible to compare 2017 Census of Agriculture data to previous years’ data. Specifically, in 2017 the number of people on each farm who could be listed as a “farm operator” increased from three to four. In addition, the role of “principal operator,” previously a role for a single person on each farm, was replaced with “Principal Producers” a role that 0–4 people on each farm could claim.
Beach, S.S. 2013. “‘Tractorettes’ or Partners?: Farmers’ Views on Women in Kansas Farming Households.” Rural Sociology 78(2):210–228.
Bell, M.M., W.D. Bauer, S. Jarnagin, and G. Peter. 2004. Farming for Us All: Practical Agriculture and the Cultivation of Sustainability. University Park, PA: Pennsylvania State University Press.
Brasier, K.J., C.E. Sachs, N.E. Kiernan, A. Trauger, and M.E. Barbercheck. 2014. “Capturing the Multiple and Shifting Identities of Farm Women in the Northeastern United States.” Rural Sociology 79(3):283–309.
Dreibus, T. 2019. “Ag Census: Producers Get Older, Number of Female Farm Owners Tops 1 Million.” Agriculture.com. Available online: https://www.agriculture.com/news/business/ag-census-producers-get-older-number-of-female-farm-owners-tops-1-million.
Fremstad, A. and M. Paul. 2016. “Opening the Farm Gate to Women? Sustainable Agriculture in the United States.” Amherst, MA: University of Massachusetts Amherst, Political Economy Research Institute, Working Paper 422.
Messina, M. 2019. “Female Farmers Are Coming into Their Own—and Networking Is Key to Their Success.” Civil Eats. Available online: https://civileats.com/2019/04/16/ag-census-female-farmers-are-coming-into-their-own-and-networking-is-key-to-their-success/.
U.S. Department of Agriculture. n.d. “Women in Ag.” Washington, DC: U.S. Department of Agriculture, New Farmers. Available online: https://newfarmers.usda.gov/women-in-ag
U.S. Department of Agriculture. 1997. “Appendix D: Reports Forms and Information Sheets.” Washington, DC: U.S. Department of Agriculture, Form 97-A0214. Available Online: http://usda.mannlib.cornell.edu/usda/AgCensusImages/1997/01/51/1601/Appd-04.pdf
U.S. Department of Agriculture. 2002. “United States 2002 Census of Agriculture.” Washington, DC: U.S. Department of Agriculture, National Agriculture Statistics Service, Form 02-A0201. Available online: http://usda.mannlib.cornell.edu/usda/AgCensusImages/2002/03/01/1769/Table-02.pdf.
U.S. Department of Agriculture. 2007. “United States 2007 Census of Agriculture.” Washington, DC: U.S. Department of Agriculture, National Agriculture Statistics Service, Form 07-A0201. Available online: https://www.nass.usda.gov/AgCensus/Report_Form_and_Instructions/2007_Report_Form/07-a02011.pdf.
U.S. Department of Agriculture. 2012. “United States 2012 Census of Agriculture.” Washington, DC: U.S. Department of Agriculture, National Agriculture Statistics Service, Form 12-A101. Available online: https://www.nass.usda.gov/AgCensus/Report_Form_and_Instructions/2012_Report_Form/Region1_12a101_121311.pdf.
U.S. Department of Agriculture. 2017. “United States 2017 Census of Agriculture.” Washington, DC: U.S. Department of Agriculture, National Agriculture Statistics Service, Form 17-A100. Available online: https://www.nass.usda.gov/AgCensus/Report_Form_and_Instructions/2017_Report_Form/17a100_121316_general_final.pdf.
U.S. Department of Agriculture. 2017. “United States 2017 Census of Agriculture: Appendix B. General Explanation and Census of Agriculture Report Form.” Washington, DC: U.S. Department of Agriculture, National Agriculture Statistics Service. Available online: https://www.nass.usda.gov/Publications/AgCensus/2017/Full_Report/Volume_1,_Chapter_1_US/usappxb.pdf.
U.S. Department of Agriculture. 2019. “Glossary.” Washington, DC: U.S. Department of Agriculture, Economic Research Service. Available online: https://www.ers.usda.gov/topics/farm-economy/farm-household-well-being/glossary.aspx
U.S. Department of Commerce. 1974. “Farm Census Guide for the 1974 Census of Agriculture.” Washington, DC: U.S. Department of Commerce, Social and Economic Statistics Administration, Form 74-A10, December. Available online: http://usda.mannlib.cornell.edu/usda/AgCensusImages/1974/05/1.pdf.
U.S. Department of Commerce. 1978. “Farm Census Guide for the 1978 Census of Agriculture: Appendices.” Washington, DC: U.S. Department of Commerce, Social and Economic Statistics Administration, Form 78-A1(1). Available online: http://usda.mannlib.cornell.edu/usda/AgCensusImages/1978/01/51/1978-01-51-appendixes.pdf.
U.S. Department of Commerce. 1982. “Agricultural Census Guide 1982 Census of Agriculture.” Washington, DC: U.S. Department of Commerce, Bureau of the Census, 82-A20. Available online: http://usda.mannlib.cornell.edu/usda/AgCensusImages/1982/03/1.pdf.
U.S. Department of Commerce. 1987. “1987 Census of Agriculture Report Form Guide.” Washington, DC: U.S. Department of Commerce, Bureau of the Census, 87-A10. Available online: http://usda.mannlib.cornell.edu/usda/AgCensusImages/1987/04/6.pdf.
U.S. Department of Commerce. 1992. “1992 Census of Agriculture: Coverage Evaluation.” Washington, DC: U.S. Department of Commerce, Economics and Statistics Administration, Bureau of the Census, AC92-S-2. Available online: http://usda.mannlib.cornell.edu/usda/AgCensusImages/1992/02/Coverage.pdf

