Nitrogen (N), phosphorus (P), and potassium (K) are essential elements needed for crop growth, and fertilizers containing these elements are widely used in agriculture production. While synthetic fertilizer use has been one of the main contributors to crop yield increases over the last century, the unabsorbed fertilizer pollutes aquatic ecosystems through leaching and surface runoff (Glibert, 2017). Collectively, agricultural fertilizer runoff has caused eutrophication and formed “dead zones” in important aquatic ecosystems, such as the Chesapeake Bay, Great Lakes, and Gulf of Mexico. In addition, the greenhouse gas (GHG) emissions caused by the manufacture, transportation, and field use of synthetic N fertilizer account for 10.6% of total agricultural GHG emissions (Menegat, Ledo, and Tirado, 2022).
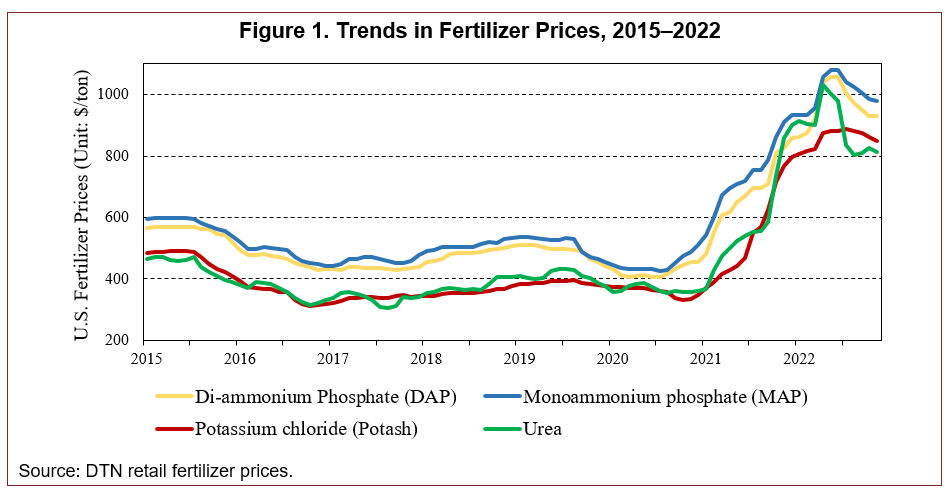
Fertilizer is a primary input cost incurred in crop production, constituting an average of 36%, 35%, and 30% of farmers’ operating costs for corn, wheat, and sorghum in 2020, respectively (USDA, 2022a). On large fields where the need for N varies spatially, overapplication of N is common at low fertilizer price levels due to its cost-effectiveness (Basso et al., 2019). Due to the supply chain disruptions from the COVID-19 pandemic and the onset of the Russia–Ukraine war, fertilizer prices in 2022 reached record high levels (Figure 1). These high prices have incentivized farmers to adjust their farm practices to reduce fertilizer usage and minimize production costs. For example, some producers reduced planted acreage, while others may have planted crops that require less fertilizer, such as soybeans (USDA, 2022b). Conservation practices (e.g., cover crops, diversified crop rotation) that improve soil fertility also offer farmers opportunities to reduce fertilizer usage. Variable-rate fertilizer application addresses in-field nutrient variation and frequently generates cost savings. To reduce fertilizer costs, producers are also using alternative nutrient sources, such as manure and soil microorganisms/microbes.
To assess farmers’ adaptation strategies to high fertilizer prices and the effectiveness of different strategies inreducing the use of synthetic fertilizer, we conducted a survey in the U.S. Midwest (Minnesota, Nebraska, North Dakota, and South Dakota) in 2022. This is a follow-up survey of farmers who responded to our 2021 farm survey (Wang et al., 2023). For the 2021 farm survey, we purchased 6,000 mailing addresses (1,500 in each state) from Dynata using the criterion that each operation had at least 100 corn acres. Of 5,473 eligible addresses, we received 1,119 responses, constituting our 2022 resurvey sample. These producers were contacted for up to four waves from July to September 2022, in line with the modified Tailored Design Method (Dillman, Smyth, and Christian, 2009).
In the first wave, we mailed an advance letter containing a link for producers to answer the questionnaire online. A $2 bill was sent with the advance letter to help promote response rates. We also offered survey respondents the chance to win one of ten $100 gift cards. In the second wave, we sent the paper questionnaires and prepaid return envelopes. We sent a reminder/thank you postcard in the third wave, and then a second copy of the paper questionnaire with the prepaid envelopes in the fourth wave. Excluding the 64 producers who were ineligible for reasons such as no longer farming and undeliverable addresses, we received 654 responses out of 1,055 eligible sample—a response rate of 62%. The results of our 2022 survey fill in the literature gaps on producers’ short- and medium-term responses to increased synthetic fertilizer prices and offer insights into changes in fertilizer demand associated with higher prices.
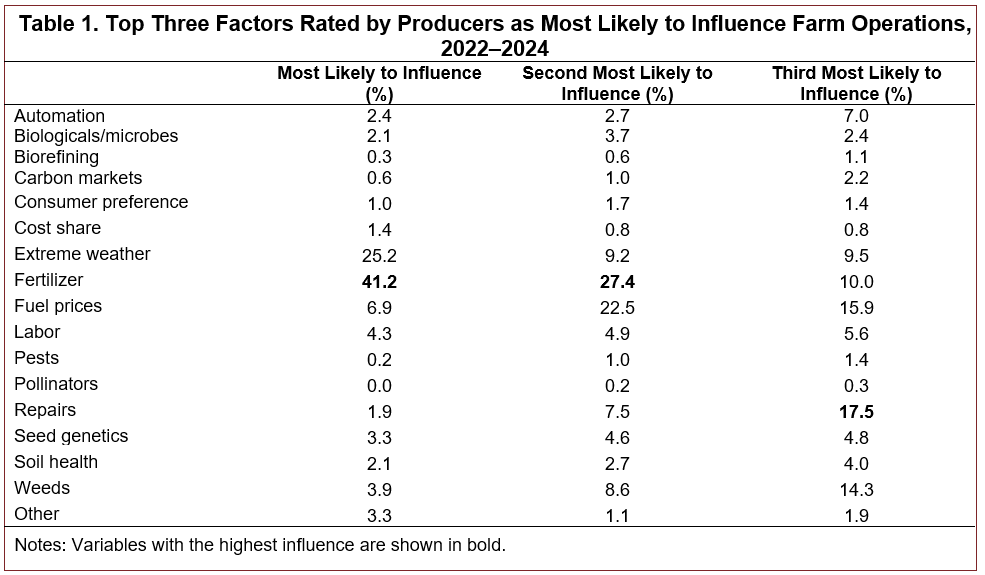
In our 2022 survey, farmers were asked to rank the top three factors likely to affect their farm operations during the 2022–2024 period. From these responses, we identified 16 issues/challenges that have likely affected the farming sector: 1) automation, 2)biologicals/microbes, 3) biorefining, 4) carbon credits, 5) consumer preference, 6) cost share, 7) extremeweather, 8) fertilizer, 9) fuel prices, 10) labor, 11) pests, 12) pollinators, 13) repairs, 14) seed genetics, 15) soil health, and 16) weeds. Of the 16 listed issues, 78.6% of the respondents ranked fertilizer as among the top three issues that had the greatest effect on their operations (Table 1). Of these, 41.2% rated fertilizer as the factor most likely to influence their operations, followed byextreme weather (25.2%) and fuel prices (6.9%), and 27.4% rated fertilizer as the second most important influencing factor, followed by fuel prices (22.5%) and weeds (8.6%).
There are regional variations in producers’ views across the four surveyed states. For example, 46.6%, 34.5%, 35.0%, and 44.8% of farmers in Minnesota, Nebraska, North Dakota, and South Dakota, respectively, rated fertilizer as the top factor influencing their farm operations. Compared with ratings in North Dakota and Minnesota, fertilizer appeared less of a concern for South Dakota and Nebraska farmers, as extreme weather also poses a great concern for one-third of South Dakota and Nebraska farmers. Nevertheless, when considering the first and second most influencing factors, fertilizer remains the most highly rated influencing factor in all four states.
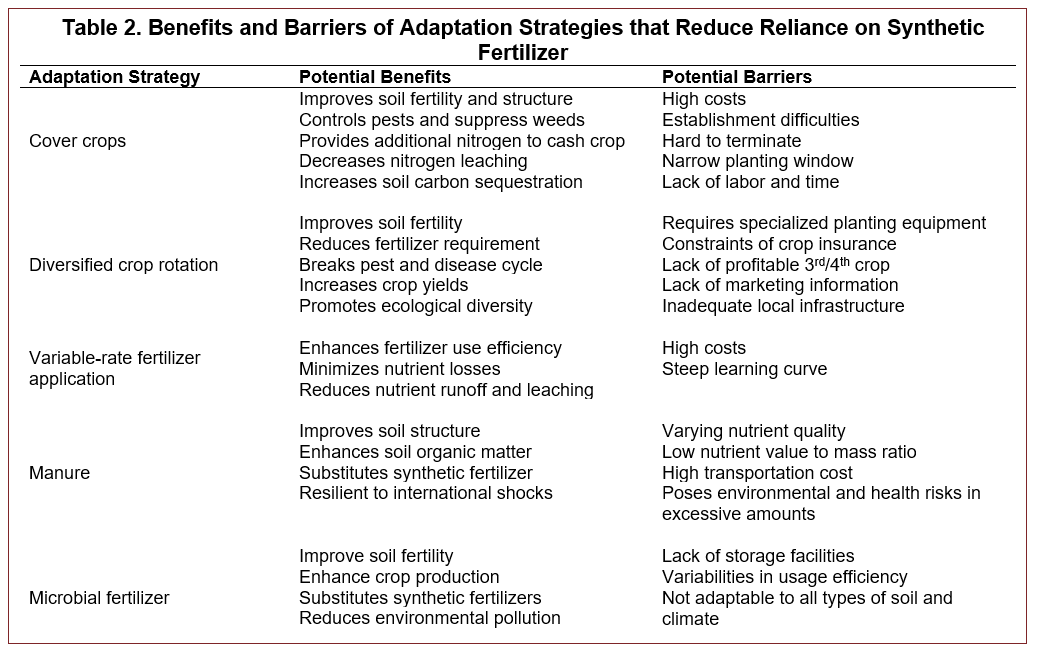
Table 2 summarize the potential benefits and barriers of different adaptation strategies, which are detailed below.
Cover crops are planted to protect the soil surface during fallow periods or following the harvest of one crop and before the planting of the next crop. One of the major reasons that farmers adopt cover crops is to help improve soil fertility and structure. Cover crops can also suppress weeds, break pest and disease cycles, and increase soil carbon sequestration (Clark, 2007). Cover crops can help producers reduce synthetic fertilizer use by retrieving excessive or residual nitrogen from the soil and fixing nitrogen from the atmosphere, meanwhile providing environmental benefits by reducing nitrogen leaching and phosphorus runoff (Adetunji et al., 2020; Tonitto, David, and Drinkwater, 2006). According to the National Cover Crop Survey (2020), 49% of corn producers, 41% of soybean producers, 43% of wheat producers and 53% of cotton producers reported fertilizer cost savings due to cover crop use.
Despite well-documented benefits, the current adoption rate of cover crops remains low. During 2017–2020, cover crops were planted in only 4%–5% of row crop acres in the U.S. Midwest. Barriers that prevented producers from using cover crop practice included high costs, establishment difficulties, narrow planting window, unpredictable yield benefits, labor and time constraints, and variations in weather and soil conditions (Adhikari, 2023).
Diversified crop rotation (DCR) is the rotating of three or more crops in set or variable sequences on the same field (Wang et al., 2019). Compared to monoculture or two-crop rotations, DCR reduces the need for fertilizer use by adding organic matter to the soil, improving soil function, regulating soil fertility, and fully using soil nutrients (Baldwin-Kordick et al., 2022). For example, Davis et al. (2012) demonstrated that compared to two-crop rotations, DCR increased maize and soybean yieldsby 4% and 9%, respectively, with much-reduced averagesynthetic N fertilizer usage rates of 16 kg (3-year rotation) and 11 kg (4-year rotation) per hectare in comparison to the 80 kg per hectare used in a 2-year rotation. Feng et al. (2021) also found that DCR demonstrated a higher level of resilience in economic returns at reduced N fertilizer application rates compared to the 2-year corn–soybean rotation.
The adoption rate of diversified crop rotation has showed a declining trend over past decades. Barriers faced by farmers—including the need to invest in specialized planting equipment, insufficient knowledge and technical skills, inadequate local infrastructure, and lack of insurance policies and marketing information—could inhibit farmers from transitioning to diversified crop rotation (Wang et al., 2019, 2021). In addition, the benefits of diversified crop rotation—such as increased yield and reduced requirement for fertilizer inputs—generally take a long time to manifest (Wang et al., 2021).
Variable-rate (VR) fertilizer application is a site-specific management tool that aims to enhance fertilizer use efficiency and minimize losses by accounting for in-field variation in nutrient availability and yield expectations so that the fertilizing needs of crops are met temporally and spatially (Krishna, 2013). Thompson et al. (2019) found that the two most important benefits of VR fertilizer application viewed by farmers were yield improvement and cost savings. Recent studies have reported significant fertilizer savings from adopting VR fertilizer technology, with yields either not affected or significantly increased. For example, VR fertilizer application led to a 14 kg N ha−1 fertilizer saving (Kazlauskas et al., 2022) and a 4% reduction in fertilizer costs (Schimmelpfennig, 2018) compared to uniform applications.
The prerequisite for VR fertilizer application is to collect data through diagnostic precision agriculture tools. Due to the sequential adoption pattern, not all farmers use collected data to facilitate VR applications (Griffin et al., 2017). Potential reasons hindering VR adoption include high investment costs, being too time consuming to learn, and uncertainty about effective use of collected data (Wang, Jin, and Sieverding, 2023).
Manure is rich in multiple nutrients and could be used as a crop fertilizer that increases crop yield and as a soil amendment that improves soil health (Almeida et al., 2019; USDA, 2023). Manure application improves soil structure, boosts organic matter, provides micronutrients, minimizes compaction, and increases water-holding capacity (MacDonald et al., 2009). When synthetic fertilizers are amply available, farmers tend to overlook the value of manure, with the belief that it is an unreliable nutrient source. The synthetic fertilizer supply shortage incentivizes farmers to use manure as supplement or substitute for synthetic fertilizers. Given the variety of livestock species that produce manure, the supply of manure is resilient to international shocks (Pudenz and Schulz, 2022).
As of 2020, only 7.7 % of the total area planted with major field crops in the U.S. received manure application (USDA, 2023). Barriers that have limited the widespread usage of manure include the low nutrient value to mass ratio. As water content could be 90% of the total weight in manure, the transportation cost of manure could be excessively high (USDA, 2023). Thus, the use of manure is typically limited to local regions where it are produced. Additionally, manure poses environmental and human health risks when improperly stored or used (MacDonald et al., 2009).
Microbial fertilizers, also referred to as biofertilizers and bioinoculants, use living microorganisms—such as algae, bacteria, or fungi—to improve nutrient availability to plants (Fasusi, Cruz, and Babalola, 2021). By using the naturally occurring processes involving beneficial soil and plant microorganisms to improve soil fertility and enhance crop production, biofertilizers meet the nutrient requirement of different crops while reducing the environmental pollution caused by synthetic fertilizers (Fasusi, Cruz, and Babalola, 2021; Mitter et al., 2021). For example, microbial fertilizers could supply 20%–25% of the N required by rice, 30%–50% required by wheat, and up to 70% required by sugarcane (Mitter et al., 2021).
The usage of biofertilizers is limited, and it has been estimated that about 15% of U.S. soybean acres were amended with N-fixing microbes (Santos, Nougeria, and Hungria, 2019). Inconsistency in biofertilizer performance is often observed due to low quality or contamination of undesired microbes (Kumar, Sindhu, and Kumar, 2022). The performance of most biofertilizers is linked to agroecosystem conditions, and it is challenging to develop a microbial product adaptable to all types of soils and climates. Further, extreme climatic conditions could lead to efficacy variabilities of the microbial products (Fasusi, Cruz, and Babalola, 2021). The use of biofertilizers may also be restricted due to a lack of specialized storage facilities (Nosheen, Ajmal, and Song, 2021).
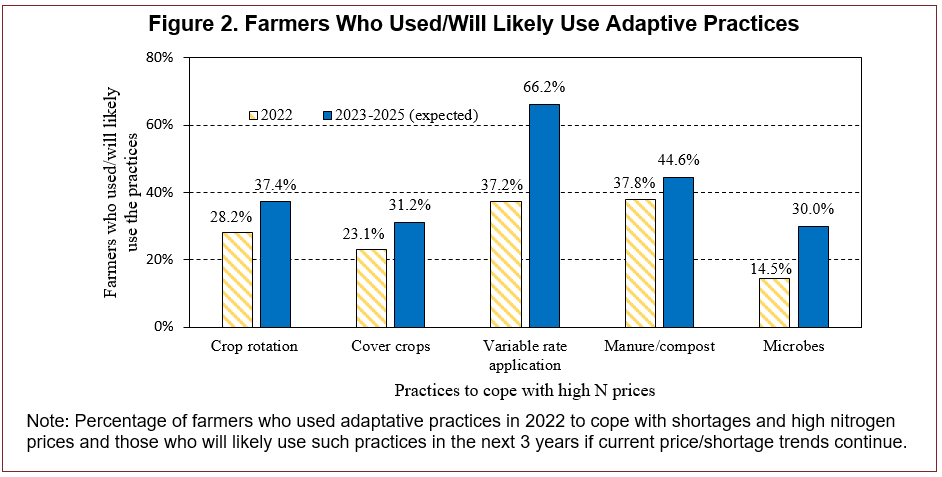
In the questionnaire, producers were asked, “Have you used any of the following practices in 2022 to cope with increasing nitrogen prices and/or shortage in nitrogen fertilizer supplies? (Check all that apply).” The options provided included 1) changed crop rotation/mix, 2) planted cover crops, 3) used variable-rate (VR) fertilizer application, 4) used manure, compost, livestock bedding, or other similar amendments, and 5) added microbes.Among the five practices, 78.0% of farmers had taken some adaptation strategies, with 34.0% adopting one practice and 44.0% adopting more than one practice. As indicated in Figure 2, VR fertilizer and manure/compost were the two most adopted adaptation strategies in 2022, with 37.2% and 37.8% adoption rates respectively, followed by 28.2% of farmers changing crop rotation/mix and 23.1% planting cover crops. Microbes or biofertilizer had the lowest adoption rate at 14.5%.
We also asked producers to rate their likelihood of using these practices in the next 3 years if the current high nitrogen prices or supply shortages continued. Many U.S. producers purchased their fertilizers for 2022planting in 2021 (Jones and Nti, 2022). While early planning could help avoid a singular price surge or shortage, more adaptation strategies will likely be takenif prices continue to trend upwards. Compared to 2022, more farmers plan to change their practices in the next 3 years rather than had in the year of the survey.
The growth rates in adaptation strategy usage in the next 3 years vary by practice. For example, the usage rates of VR fertilizer and manure/compost were similar in 2022. However, 66.2% of producers indicated that they were either likely or very likely to use VR application in the next 3 years, compared to 44.6% for manure/compost usage. Even though the usage rates for microbes remain the lowest for 2022 and the next 3 years, it has the highest expected growth rate.
The expected growth rates for microbes (106.9%) and VR fertilizer (77.8%) demonstrate that farmers most favor new technology-oriented adaptation strategies to reduce their reliance on synthetic fertilizer. Comparatively, the expected growth rates are relatively low for conservation practices such as cover crops (35.4%) and diversified crop rotation (32.8%). The expected growth rate is the lowest for manure/compost (17.8%), indicating that producers would be least likely to try manure if they do not currently use it. Specialization in agricultural production since World War II has advanced the spatial separation of crop and livestock production. Therefore, it can be difficult for crop producers to locate manure sources if they are not integrating livestock with crop production or located near a concentrated livestock producer.
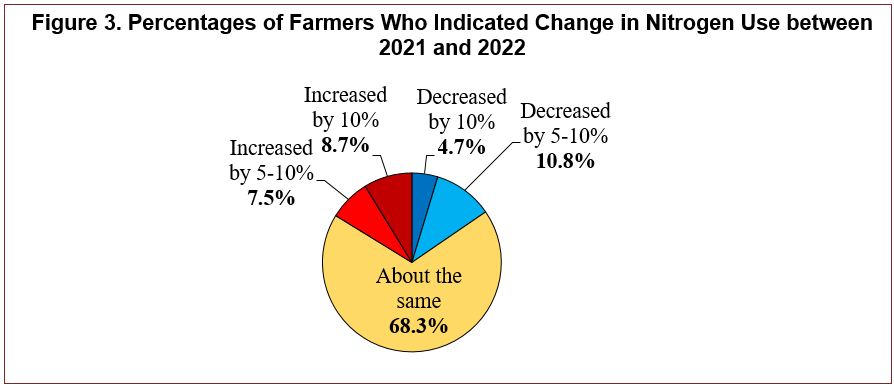
Fertilizer is viewed by 78.6% of the respondents as one of the top three most influential issues on farm operations during 2022–2024, but fewer than 10% (9.8%) indicated that they experienced a shortage in N supply. Indeed, farmers are primarily concerned with high fertilizer prices rather than with sourcing adequate supplies. As indicated in Figure 3, over two-thirds of farmers indicated their nitrogen usage rates in 2022were about the same as those in 2021, and 16.2% hadincreased their nitrogen usage by over 5%. Only 15.5%of producers had decreased nitrogen usage by more than 5%.
Figure 4 demonstrates the change in nitrogen use between 2021 and 2022 on a per acre basis for adopters and nonadopters of each practice. Adopters of all practices, except for VR application, reported that their average N use decreased from 2021 to 2022. While VR fertilizer optimizes the usage efficiency of fertilizerthrough site-specific management technology, it does not necessarily lead to a decrease in overall fertilizer use(Schimmelpfennig and Ebel, 2016).
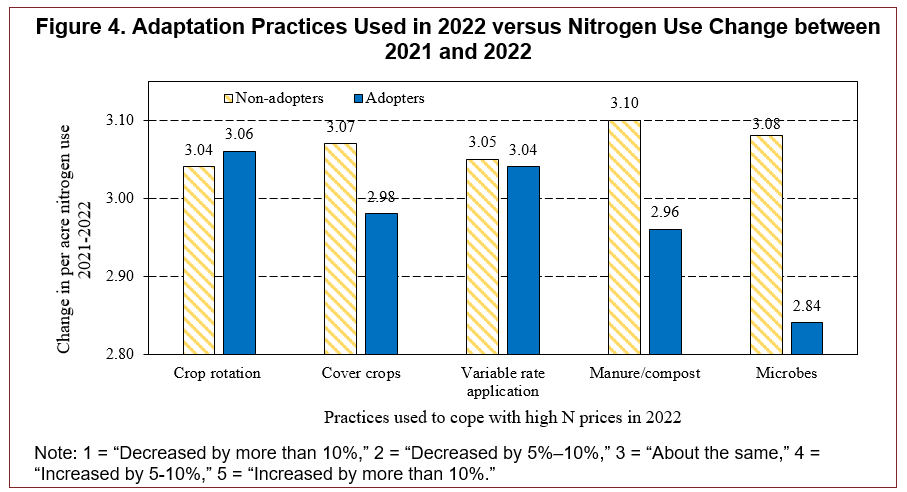
Due to the sequential adoption patterns in PA technology (Griffin etal., 2017), the VR fertilizer application is not likely to be implemented in the short term to cope with the fertilizer change. This could explain the little change in N use between 2021 and 2022 for VR adopters, as 2022 may not be their first year of adoption.
A comparison between adopters and nonadopters through the t-test indicated that using cover crops, manure/compost, and microbes led to significant reductions in N usage, illustrating the potential of these practices in reducing synthetic fertilizer use in the short term. Among those, manure/compost and microbes serve directly as fertilizer substitutes and cover crops reduce N needs indirectly through more systemic improvements in nutrient cycling. While DCR adoption also decreased N use, the difference between adoptersand nonadopters was insignificant.
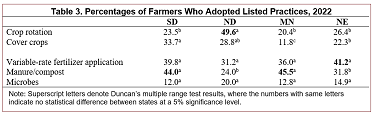
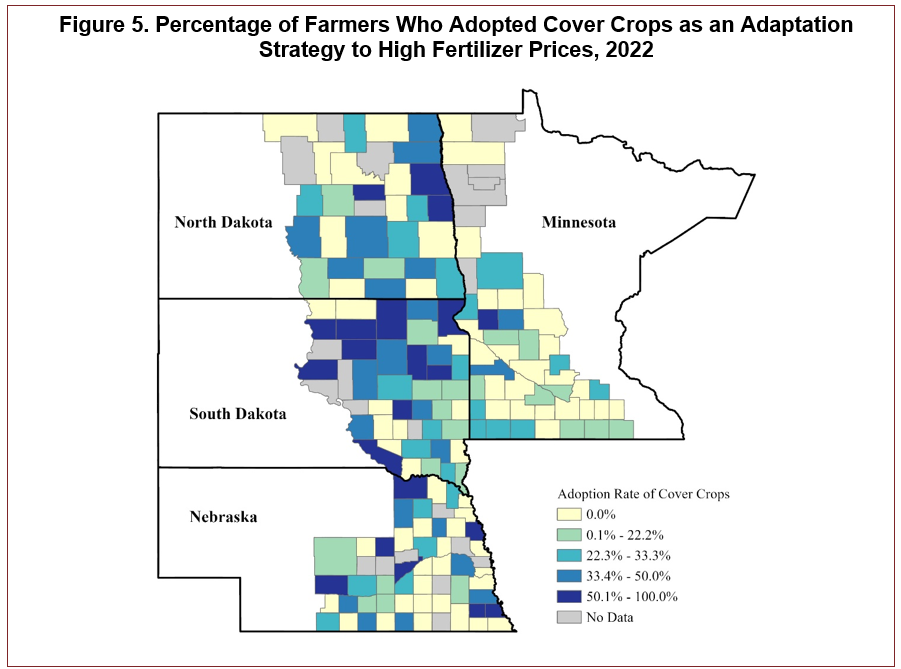
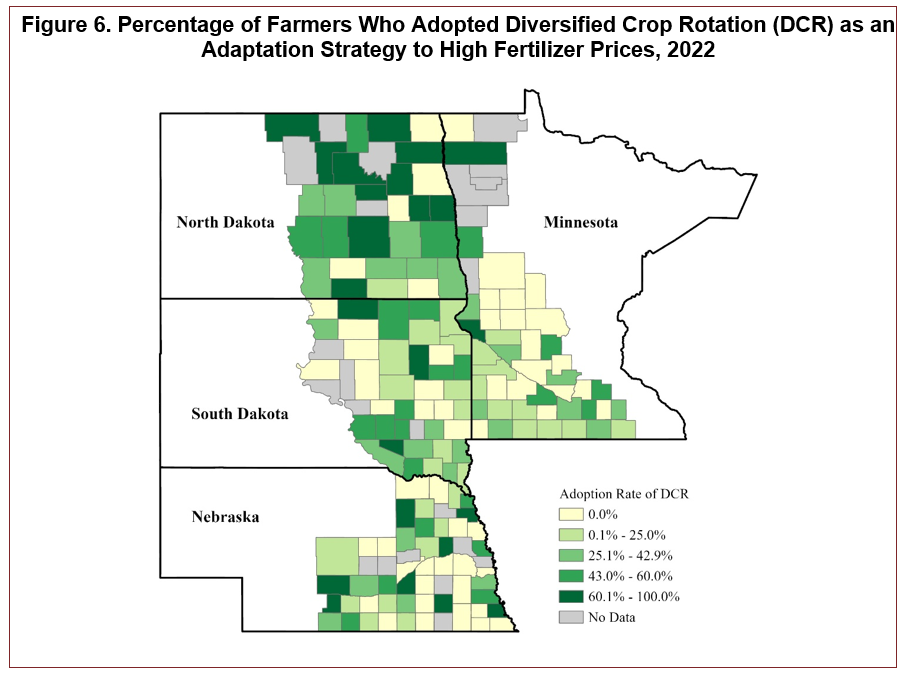
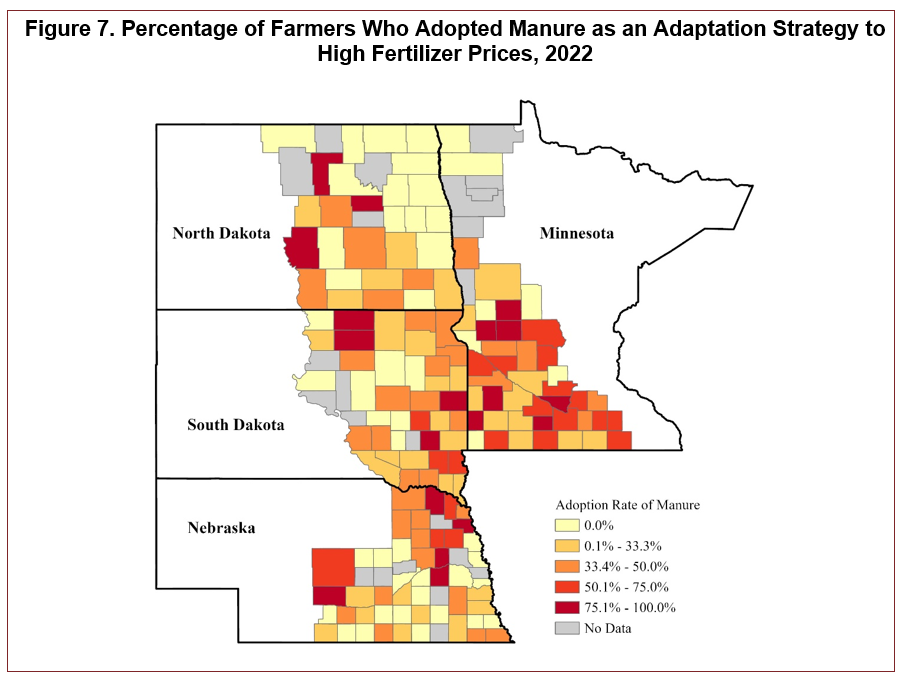
Farmers’ uptake of adaptation strategies demonstrates heterogeneity in different regions (Table 3). While manure/compost is the most used adaptation strategy in South Dakota (44.0%) and Minnesota (45.5%), in North Dakota and Nebraska the adoption rates are significantly lower at 24.0% and 31.8%, respectively. In North Dakota, DCR is the most used adaptation strategy (49.6%); in Nebraska, VR fertilizer application has been most used (41.2%). Except for VR fertilizer andmicrobes, the adoption rates of the other three practices vary significantly across states (Table 3). The variation in adaptation strategies is also reflected at the county level (Figures 5–7).
To understand how existing farming practices may influence farmer adaptation strategies in 2022, we compared our findings with the 2017 agricultural census data on the three practices that demonstrate regional heterogeneity: DCR, cover crops, and manure. According to the 2017 Census of Agriculture (USDA, 2017), corn and soybean harvested acres make up 84%, 80%, 50%, and 70% of total harvested acres for Minnesota, Nebraska, North Dakota, and South Dakota, respectively. This aligns well with our finding that, while49.6% of North Dakota farmers chose DCR as a strategy to save on fertilizer use, only 20.4% of Minnesota farmers used this strategy.
Our finding that manure adoption rates in Minnesota andSouth Dakota are significantly higher than those of North Dakota and Nebraska is also consistent with the 2017 census data, which shows that of the operations that applied fertilizer or manure, 43%, 34%, 24%, and 23% were manure users in Minnesota, South Dakota, North Dakota, and Nebraska, respectively (USDA, 2017). As of 2017, the number of farms that adopted cover crops accounted for 13%, 15%, 15%, and 12% of the total number of farms that used fertilizer application (including manure) in Minnesota, Nebraska, North Dakota, and South Dakota respectively (USDA, 2017). Compared to the census data, results from our survey indicated an overall increase in cover crop usage during the last 5 years, especially in South Dakota and North Dakota.
The congruency between producers’ 2022 adaptation strategies and the 2017 agricultural census data regarding DCR and manure use implies that producers’ decisions are, in many cases, contingent on existing practices and local infrastructure. Climate and soil factors, as well as infrastructure differences across different regions, could affect the
feasibility of implementing various practices. Among the strategies that curtail the need for synthetic fertilizer, DCR adoption is more likely to occur in regions with lower precipitation and temperature (Wang et al., 2019; 2021). Further, infrastructure development—such as market outlets, equipment, and agronomic services—plays a critical role in extending crop rotations. This illustrates the importance of strengthening market and service infrastructure and providing insurance and monetary incentives to facilitate farmers’ adaptation strategies. Similarly, the decision to apply manure is often contingent on existing livestock operations. In cold regions where concentrated livestock operation isgenerally lacking (e.g., North Dakota), probably due to the high costs of maintaining temperature-controlled confinement facilities, producers are less likely to use manure as a substitute for synthetic fertilizer. Therefore, policy makers must consider regional differences when promoting conservation practices as adaptation strategies for farmers.
Financial assistance for cover crops has increased in recent years through working land conservation programs on the national scale, such as the Environmental Quality Incentives Program (EQIP) and the Conservation Stewardship Program (CSP). While numerous studies have evaluated the effectiveness of these programs, regional comparisons of the program effectiveness have received scant attention. Our findings illustrate nonuniform increases in cover crop adoption rates across states.
A plausible reason for why South Dakota experienced a high increase in cover crop usage is that South Dakota was one of the most affected states during the 2019 flood, which prevented planting on 19 million acres across the Midwest. In 2019, producers who filedprevented planting claims and planted cover crops afterward could receive a $15/acre payment through the Market Facilitation Program (USDA, 2019). The likelihood and magnitude of prevented planting are both reduced for fields planted cover crops (Won et al., 2023). The demonstrated benefits, along with monetary support from different programs, could have incentivized many farmers in the flood-stricken area to use cover crops.
As of 2021, 41% of South Dakota farmers indicated they were likely to use cover crops on fields susceptible to extreme weather conditions (Wang and Ristau, 2021). A similar trend also occurred during the 1998–2006 period when drought-stricken South Dakota, Nebraska, and Kansas experienced a 67% increase in no-till cropping acres, which greatly exceeded the national average increase of 38% (Ding et al., 2009).
Policy assistance during extreme events such as natural disaster or fertilizer price spike, if designed properly, could incentivize producers to adopt individual conservation practices or combinations of conservation practices that are ideal for the region. In the long term, social benefits will accrue as more farmers become accustomed to using conservation practices as adaptation strategies to such events or as a norm in their agricultural production.
Most producers consider the surge in fertilizer prices to be one of the top three factors influencing farm operations during 2022–2024. As a result, 78.0% offarmers chose to alter their management practices: 34.0% of surveyed farmers adopted one and 44.0% adopted more than one adaptation strategy. Among all the adaptation strategies presented in the survey,biofertilizer (microbes) was the leading practice adopted,followed by manure/compost and cover crops. Farmers are more likely to make medium- and long-term adaptation plans than short-term adaptation decisions if high fertilizer prices continue.
Our findings revealed that producers were highly interested in investing in new technologies, such as biofertilizers and VR fertilizer in the future. This calls for more research and development efforts to advance the use of biofertilizers and address the performance inconsistency challenges due to weather and undesirable microbes. To overcome barriers toward VR adoption, especially from small farm operators, it is important to train specialized laborers in precision agriculture and provide custom services to interested farmers who lack expertise.
Comparatively, the future growth rates for cover crops, DCR, and manure are modest. Current adoption rates for these practices also demonstrated significant regional differences. It is therefore important for policy makers to consider climate and infrastructure factors in promoting the best adaptation strategies on a regional basis. On both DCR and manure adoption rates, the close resemblance between our findings and the 2017 census data implies that existing agricultural practices in the region play critical roles in farmers’ adaptation decisions with respect to high fertilizer prices. This illustrates the importance for policy makers to takepreventative measures by strengthening market and service infrastructure and providing insurance and monetary incentives to facilitate adaptation strategies.
The nonuniform increase in cover crop adoption rate could be attributed to recent flooding events, which likely introduced farmers in the severely affected regions to using cover crops. Similarly, the fertilizer price spike in 2022 will likely alter producers’ experience and expectations on the input costs of synthetic fertilizer, necessitating and reinforcing the need to reduce farmers’ overreliance on synthetic fertilizer and shift toward alternative resources that improve social benefits in the long term through channels such as promoting ecological diversity and reducing environmental pollution.
Adetunji, A.T., B. Ncube, R. Mulidzi, and F.B. Lewu. 2020. “Management Impact and Benefit of Cover Crops on Soil Quality: A Review.” Soil and Tillage Research 204:104717.
Adhikari, R.K., T. Wang, H. Jin, J.D. Ulrich-Schad, H.L. Sieverding, and D. Clay. 2023. “Farmer Perceived Challenges Toward Conservation Practice Usage in the Margins of the Corn Belt, USA.” Renewable Agriculture and Food Systems 38:14.
Almeida, R.F., I.D.S. Queiroz, J.E.R. Mikhael, R.C. Oliveira, and E.N. Borges. 2019. “Enriched Animal Manure as a Source of Phosphorus in Sustainable Agriculture.” International Journal of Recycling of Organic Waste in Agriculture 8:203–210.
Baldwin-Kordick, R., M. De, M.D. Lopez, M. Liebman, N. Lauter, J. Marino, and M.D. McDaniel. (2022). “Comprehensive Impacts of Diversified Cropping on Soil Health and Sustainability.” Agroecology and Sustainable Food Systems 46:331–363.
Basso, B., G. Shuai, J. Zhang, and G.P. Robertson. 2019. “Yield Stability Analysis Reveals Sources of Large-Scale Nitrogen Loss from the US Midwest.” Scientific Reports 9(1):1–9.
Clark, A. 2007. Managing Cover Crops Profitably, 3rd ed. Handbook Series 3. Beltsville, MD: Sustainable Agriculture Network.
Davis, A.S., J.D. Hill, C.A. Chase, A.M. Johanns, and M. Liebman. 2012. “Increasing Cropping System Diversity Balances Productivity, Profitability and Environmental Health.” PLoS ONE 7(47):149.
Dillman, D.A., J.D. Smyth, and L.M. Christian. 2009. Internet, Mail and Mixed-Mode Surveys: The Tailored Design Method, 3rd ed. Hoboken, NJ: Wiley.
Ding, Y., K. Schoengold, and T. Tadesse. 2009. “The impact of weather extremes on agricultural production methods: Does drought increase adoption of conservation tillage practices?.” Journal of Agricultural and Resource Economics 34(3): 395-411.
Fasusi, O.A., C. Cruz, and O.O. Babalola. 2021. “Agricultural Sustainability: Microbial Biofertilizers in Rhizosphere Management.” Agriculture 11(2):163.
Feng, H., T. Wang, S.L. Osborne, and S. Kumar. 2021. “Yield and Economic Performance of Crop Rotation Systems in South Dakota.” Agrosystems, Geosciences and Environment 4(3):20196.
Glibert, P.M. 2017. “Eutrophication, Harmful Algae and Biodiversity—Challenging Paradigms in a World of Complex Nutrient Changes.” Marine Pollution Bulletin 124(2): 591-606.
Griffin, T.W., N.J. Miller, J. Bergtold, A. Shanoyan, A. Sharda, and I.A. Ciampitti. 2017. “Farm’s Sequence of Adoption of Information-Intensive Precision Agricultural Technology.” Applied Engineering in Agriculture 33(4):521.
Jones, K., and F. Nti. 2022. “Impacts and Repercussions of Price Increases on the Global Fertilizer Market.” USDA Foreign Agricultural Service, June 3-4.
Kazlauskas, M., E. Šarauskis, K. LekaviÄienÄ—, V. NaujokienÄ—, K. Romaneckas, I. BruÄienÄ—, S. BuragienÄ—, and D. SteponaviÄius. 2022. “The Comparison Analysis of Uniform-and Variable-Rate Fertilizations on Winter Wheat Yield Parameters Using Site-Specific Seeding.” Processes 10(12):2717.
Krishna, K.R. 2013. Precision Farming: Soil Fertility and Productivity Aspects. CRC Press.
Kumar, S., S.S. Sindhu, and R. Kumar. 2022. “Biofertilizers: An Ecofriendly Technology for Nutrient Recycling and Environmental Sustainability.” Current Research in Microbial Sciences 3:100094.
MacDonald, J.M., M.O. Ribaudo, M.J. Livingston, J. Beckman, and W. Huang. 2009. “Manure Use for Fertilizer and for Energy: Report to Congress” No. 2238-2019-2929.
Menegat, S., A. Ledo, and R. Tirado. 2022. “Greenhouse Gas Emissions from Global Production and Use of Nitrogen Synthetic Fertilisers in Agriculture.” Scientific Reports 12(1):14490.
Mitter, E.K., M. Tosi, D. Obregón, K.E. Dunfield, and J.J. Germida. 2021. “Rethinking Crop Nutrition in Times of Modern Microbiology: Innovative Biofertilizer Technologies.” Frontiers in Sustainable Food Systems 5:606815.
National Cover Crop Survey. 2020. Annual Report. Available online: https://www.sare.org/wp-content/uploads/2019-2020-national-cover-crop-survey.pdf [Accessed August 2023].
Nosheen, S., I. Ajmal, and Y. Song. 2021. “Microbes as biofertilizers, a potential approach for sustainable crop production.” Sustainability 13(4):1868.
Pudenz, C,C., and L.L. Schulz. 2022. “Challenges and Opportunities for a Manure in Iowa.” Agricultural Policy Review. Ames, IA: Iowa State University Center for Agricultural and Rural Development. Available online: https://www.card.iastate.edu/ag_policy_review/article/?a=141 [Accessed September 2023].
Santos, M.S., M.A. Nougeria, and M. Hungria. 2019. “Microbial Inoculants: Reviewing the Past, Discussing the Present, and Previewing an Outstanding Future for the Use of Beneficial Bacteria in Agriculture.” AMB Express 9:205.
Schimmelpfennig, D. 2018. “Crop Production Costs, Profits, and Ecosystem Stewardship with Precision Agriculture.” Journal of Agricultural and Applied Economics 50(1):81–103.
Schimmelpfennig, D., and R. Ebel. 2016. “Sequential Adoption and Cost Savings from Precision Agriculture.” Journal of Agricultural and Resource Economics 41(1):97–115.
Thompson, N.M., C. Bir, D.A. Widmar, and J.R. Mintert. 2019. “Farmer Perceptions of Precision Agriculture Technology Benefits.” Journal of Agricultural and Applied Economics 51(1):142–163.
Tonitto, C., M.B. David, and L.E. Drinkwater. 2006. “Replacing Bare Fallows with Cover Crops in Fertilizer-Intensive Cropping Systems: A Meta-Analysis of Crop Yield and N Dynamics.” Agriculture, Ecosystems & Environment 112(1):58–72.
U.S. Department of Agriculture. 2017. Census of Agriculture. Washington, DC: USDA National Agricultural Statistics Service. Available online: https://www.nass.usda.gov/publications/agcensus/2017/index.php [Accessed September 2023]
———. 2019. “USDA Using Flexibility to Assist Farmers, Ranchers in Flooded Areas. Washington, DC: USDA Risk Management Agency. Available online: https://www.rma.usda.gov/news-room/press/national-news-archive/2019-news/2019-news/usda-using-flexibility-to-assist-farmers-ranchers-in-flooded-areas [Accessed September 2023].
———. 2022a. “Fertilizer Prices Spike in Leading U.S. Market in Late 2021, Just Ahead of 2022 Planting Season.” Washington, DC: USDA Economic Research Service. Available online: https://www.ers.usda.gov/data-products/chart-gallery/gallery/chart-detail/?chartId=103194 [Accessed September 2023].
———. 2022b. Impacts and Repercussions of Price Increases on the Global Fertilizer Market. International Agricultural Trade Report. Washington, DC: USDA Foreign Agricultural Service. Available online: https://www.fas.usda.gov/data/impacts-and-repercussions-price-increases-global-fertilizer-market [Accessed September 2023].
U.S. Department of Agriculture. 2023. Increasing the Value of Animal Manure. Administrative Publication AP-109. Washington, DC: USDA Economic Research Service. Available online: https://www.ers.usda.gov/webdocs/publications/106089/ap-109.pdf?v=3816.3 [Accessed September 2023].
Wang, T., H. Jin, Y. Fan, O. Obembe, and D. Li. 2021. “Farmers’ Adoption and Perceived Benefits of Diversified Crop Rotations in the Margins of US Corn Belt.” Journal of Environmental Management 293:112903.
Wang, T., H. Jin, B.B. Kasu, J. Jacquet, and S. Kumar. 2019. “Soil Conservation Practice Adoption in the Northern Great Plains.” Journal of Agricultural and Resource Economics 44:404–421.
Wang, T., H. Jin, and H. Sieverding. 2023. “Factors Affecting Farmer Perceived Challenges Towards Precision Agriculture.” Precision Agriculture 24:2456–2478
Wang, T., H. Jin, H. Sieverding, S. Kumar, Y. Miao, O. Obembe, X. Rao, A. Nafchi, D. Redfearn, and S. Cheye. 2023. “Understanding Farmer Views of Precision Agriculture Profitability in the U.S. Midwest.” Ecological Economics 213107950.
Wang, T., and J. Ristau. 2021. South Dakota Farmers’ Usage of Cover Crops. South Dakota Farm Survey 8. Open Prairie, South Dakota State University. Available online: https://openprairie.sdstate.edu/sdfarmsurvey/8 [Accessed September 2023].
Won, S., R.M. Rejesus, B.K. Goodwin, and S. Aglasan. 2023. “Understanding the Effect of Cover Crop Use on Prevented Planting Losses.” American Journal of Agricultural Economics DOI: 10.1111/ajae.12396

