The availability and expense of labor has been a major challenge for the agriculture industry in recent years. Many agricultural jobs require individuals who are willing to perform physically demanding work, and the number of such workers has been ever more tightly constrained in recent decades (Buccola, Li, and Reimer, 2012; Li and Reimer, 2021). This affects many agricultural sectors, including labor-intensive specialty crop production and livestock industries such as dairy. In Oregon, for example, labor expenses account for 53%, 48%, 44%, 43%, 38%, 35%, and 20% of the production costs for tree fruits, berries, Christmas trees, nursery, hops, vegetables, and dairy, respectively (Highland Economics, 2021).
In the midst of current labor challenges, a small but growing number of states are making gradual changes meant to help farm workers, who lack some of the rights of workers in nonfarm sectors. The 1938 U.S. Fair Labor Standards Act (FLSA) exempted agricultural workers from overtime pay, meaning they are not entitled to 1.5 times their regular wage rate for hours worked beyond 40 hours per week. A number of states are now requiring overtime pay for agricultural workers. In the case of Oregon, as of January 1, 2023, agricultural employers are required to pay overtime to workers after they work 55 hours in one workweek. Starting January 1, 2025, employers are required to pay overtime to agricultural workers after they work 48 hours in one workweek. Starting January 1, 2027, employers will be required to pay overtime for work over 40 hours in one workweek.
In this article, we attempt to predict what will happen to farms, workers, and the industry as a whole as agricultural overtime requirements fully phase in. We focus on Oregon because of data availability but believe that the results will extrapolate to other states for which an overtime policy is being considered or has been implemented. The three sectors we highlight—plant nurseries, dairies, and cherry producers—can provide a template for how other agricultural sectors may experience the transition to overtime pay.
We find that agricultural overtime will negatively affect farm profitability and, perhaps surprisingly, will decrease the weekly earnings of some farm workers. This analysis is valuable in large part because it is based on individual records of (anonymous) employee hours and wages that are not usually available to researchers.
To gather these data, we secured the cooperation of farming operations within the nursery, dairy, and tree fruit industries. Ten farming operations voluntarily shared their payroll data with us to provide a basis for answering the questions of this study. All names and identities were kept anonymized. We used the payroll data to estimate the increase in labor costs that would result from full implementation of the overtime law under current labor usage. We also used industry-level data provided by industry leaders to calibrate cost functions for farming operations and estimate the impact of overtime laws on the number of farm operations in the state.
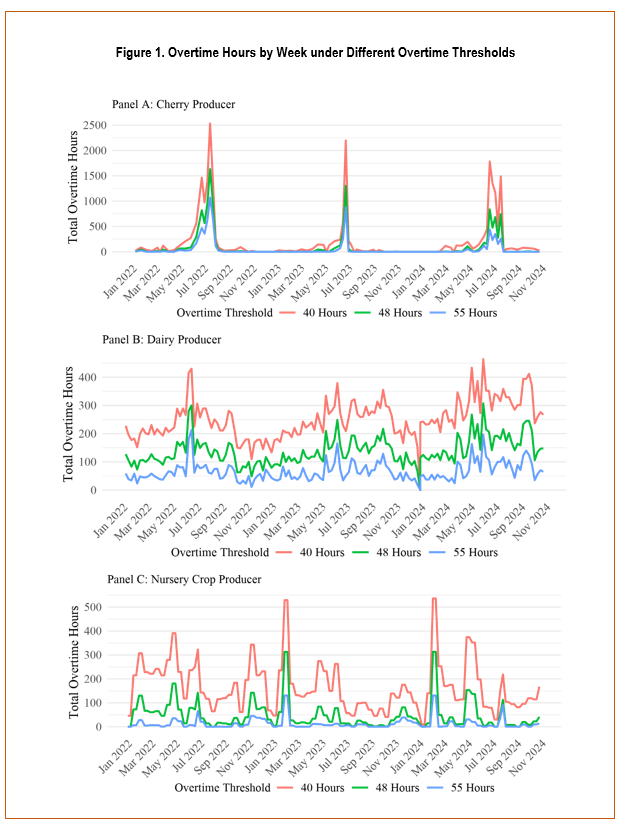
Farm businesses face seasonal fluctuations in their labor needs, and these fluctuations differ across sector and commodity. Nurseries are busiest during the spring harvest season, while cherry producers experience a large spike in labor needs during harvest in June and July. Within a particular agricultural sector, unique operational considerations can affect the number of hours that employees work each week and the ability of the farm managers to adapt and minimize overtime hours. As a result, the impact of new agricultural overtime laws falls differently on each farming operation.
Figure 1 shows the sum of weekly overtime hours for one each of the tree fruit (panel A), dairy (panel B), and nursery operations (panel C) whose payroll data are used in this analysis. Note that the number of overtime hours is the sum across all employees and would scale up or down with the size of the operation. The seasonal fluctuation in labor demand that is apparent in the figure will be largely similar across operations in the same sector.
The payroll data we use include detail on the number of hours worked and wage rates for each individual (anonymized) employee. In most cases, the datasets cover each pay period from January 1, 2022 to November 2024, allowing the analysis to account for adaptation to labor management that was prompted by the 55-hour overtime limit coming into effect on January 1, 2023. For each operation, we use the employees’ actual wage rates to calculate the gross wages that they would earn under a no-overtime scenario as well as each of the three overtime thresholds specified in the Oregon law. Specifically, wages under the three overtime thresholds are calculated for all employees in all weeks and then converted to percentage increases relative to the no-overtime baseline wage. For example, an employee working 50 hours in a particular week and earning a base wage of $18 per hour would see a 0% increase in wages at the 55-hour threshold, a 2% increase in wages at the 48-hour threshold, and a 10% increase in wages at the 40-hour threshold.
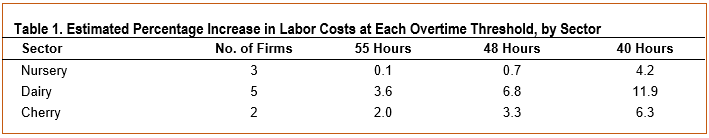
Table 1 presents the estimated percentage increases in labor costs associated with each farming operation that provided data for analysis. Of the three agricultural sectors, the dairy farm employees worked the highest number of hours per week over the course of the year and had the highest anticipated overtime costs at each threshold level, with total wages increasing more than 7% and 12% under the 48-hour and 40-hour thresholds, respectively.
The cherry producers face a lower estimated increase in labor costs than the dairy farms but a slightly higher increase than nursery crop producers. On average, the nursery crop producers included in this analysis would see an estimated increase in labor costs of slightly more than 4% under the 40-hour overtime threshold. It is important to note that all farming operations are unique, and differences in crop mix, farm size, and production factors (such as weather) may result in fluctuations in overtime hours from year to year and from one farm to the next.
The estimated percentage increases in labor expense that we estimate for each overtime threshold should not be confused with the percentage impact to net farm income. Since crop and livestock enterprises vary in terms of labor intensity and net profit margins, an equal percentage increase in labor costs will impact the net income earned by some farms more substantially than others. For example, based on a 2022 Oregon StateUniversity crop budget for sweet cherry production (Thompson and Seavert, 2022), a 10% increase in labor costs would amount to $260 per acre, representing a 34% reduction in net returns to cherry production. Based on a 5-year average of financial data from Minnesota dairy farms (University of Minnesota Center for Farm Financial Management, 2025), a 10% increase in labor costs would amount to $64 per cow, leading to a 15% reduction in net income.
In the short term, some of the increase in farm payroll cost could be offset by a refundable tax credit offered by the state of Oregon. Depending on the size and type of farm, and subject to a cap on total statewide expenditure, Oregon will provide a credit worth between 60% and 100% of overtime expenses in the 2025 tax year. The tax credit will phase out through 2028, and no credit will be offered in the 2029 tax year and beyond (Oregon Legislative Assembly, 2022).
Increasing earnings for workers is among the key goals of agricultural overtime legislation. Although workers who receive overtime pay of 1.5 times their base-wage rate are likely to see an increase in their average hourly wage, it does not necessarily follow that the total earnings will be higher for all individual workers under the new rules. With agricultural overtime laws in place, farm managers have a strong incentive to organize work schedules in a way that minimizes overtime costs, which may include reducing the hours per week that an employee works (Chavez Santos et al., 2025).
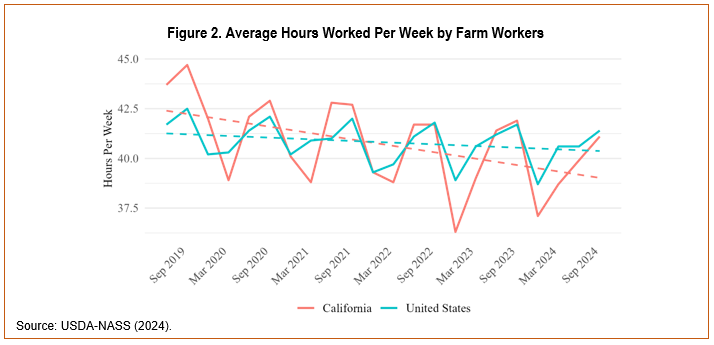
Research based on data from the National Agricultural Workers Survey (NAWS) in California suggested that while the phase-in of overtime pay pushed the average weekly earnings of some farm employees up, a larger share of workers saw declines in their average weekly pay as they were asked to work fewer hours (Hill, 2023). This pattern is consistent with USDA data that show that the average number of hours worked per employee per week has fallen in California in recent years relative to national averages (USDA-NASS, 2024; Figure 2).
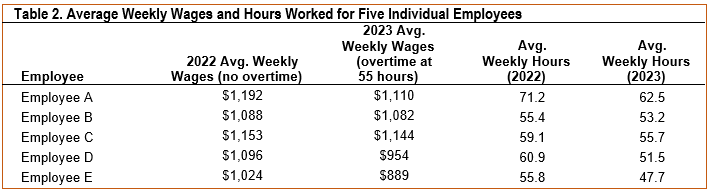
A major limitation of previous analyses of agricultural overtime is that they have been based on large-scale survey data in which individual workers cannot be followed over time and details of agricultural earnings are unobservable. Since the datasets that we use in our analysis provide information on individual workers across several years, we are able to identify the change in farmworker hours and total pay when the 55-hour overtime threshold came into effect on January 1, 2023. Among the farms that have provided both 2022 and 2023 payroll data, some seem to have shifted work schedules to reduce overtime pay. Table 2 shows the impact of the 55-hour overtime threshold on employees of one of the Oregon dairy farms that provided data for analysis. This table shows the five employees that averaged more than 55 hours of work in 2022, were paid hourly in each year, and were employed by the farm for the full two-year period. Each employee worked fewer hours in 2023 and earned less in total wages in 2023 than in 2022, despite the higher average hourly wage earned as a result of overtime pay.
Not all farm managers that contributed data for this analysis reduced the number of overtime hours that their staff worked in 2023 and 2024, though the pressure to minimize costs has led them to take other steps. Some operations have reduced year-end bonuses, and some seem to have slowed increases to base-wage rates of employees earning overtime pay. Other operations have few workers exceed 55-hour work weeks and have not yet made adjustments but will be more significantlyimpacted by the 48-hour threshold that starts on January 1, 2025.
This analysis does not explore the preferences of agricultural workers regarding overtime pay regulation. It is conceivable that some workers prefer receiving overtime pay and working fewer total hours, while others prefer to maximize total pay even if it means that no overtime would be paid. There is little research on the opinions of farmworkers following the establishment of agricultural overtime policies, though Chavez Santos et al. (2025) recently found that agricultural workers in Washington were dissatisfied with the outcomes of the overtime law in that state. Survey and interview responses indicated that, just as we have found in
Oregon payroll data, many of their farm employers cut hours to avoid paying overtime, and their total pay has fallen. One surveyed worker stated that “to do the work that they did before with their ten workers working 50 or 60 hours, now they are going to do it with 15 workers only working 40 hours … it is very high cost of living to survive with 40 hours of pay” (Chavez Santos et al., 2025).
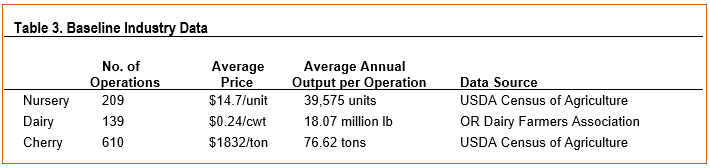
Table 3 shows the total number of operations for each of the three industries considered in Oregon. The information reported in Table 3 can be used to calibrate total cost functions for individual operations within each sector. These functions quantify the total cost of production for a given quantity of output. Then, the impact of new overtime rules can be predicted using the economic theory of a long-run competitive equilibrium.
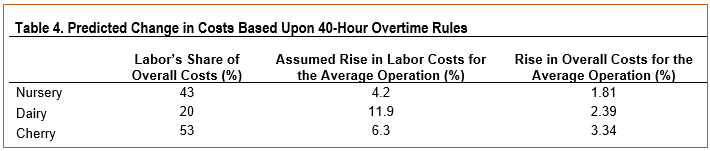
Table 4 summarizes the overall average cost change for farming operations. These average cost predictions are based on the ultimate January 1, 2027, form of the agricultural overtime law, which is that there will be overtime pay for hours worked above 40 hours per week. Table 4 first shows labor’s share of overall costs, (this information is from Highland Economics, 2021). We then use the average of the expected firm-level cost increases from Table 1 above (this information is from the cooperating farm operations who shared data in November 2024). Finally, the rightmost column—the mathematical product of the values in the two columns to the left—shows that overall costs for all three operation types are expected to rise.
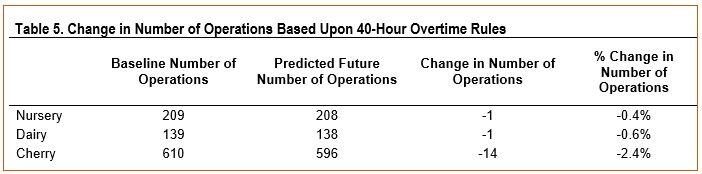
Using the information from Table 4 and a long-run competitive market model, the change in number of operations based upon 40-hour overtime rules was calculated. Table 5 reports that the number of all three types of operations would fall once the 40-hour overtime rules are in place after January 2027. This accounts for the fact that operators will act to minimize overtime hours, as seen above, yet will still be forced to pay overtime to some extent due to the limited supply of workers that they can hire on their farm. If the assumptions allow this to be extrapolated more generally, it would suggest that the loss of operations would range from roughly 0.5% to 2.5% across the various agricultural industries of Oregon (Table 5). It is important to acknowledge that the results in Table5—which are meant to represent what could happen asa result of 40-hour overtime rules going into effect after January 1, 2027—are not a forecast: In years to come many other events could change the number of firms, including changing consumer demand, tariffs, inflation, recessions, rises in energy costs, and weather events. Such events could help increase or decrease the number of operations on net, apart from the particular role that overtime rules play. The results in Table 5 are an attempt to isolate the unique role of overtime rules, abstracting from all other possible future unknown changes. The results are also affected by the farms’ ability to minimize overtime hours worked, which is imperfect due to labor supply limitations and related factors.
There are some limitations of this analysis that should be noted. Most significantly, the increases in labor costs presented in Table 1 reflect the hours that were worked prior to the implementation of the 48-hour and 40-hour overtime thresholds. Therefore, these results do not reflect further steps that farm managers may take to reduce payroll expenses under tighter overtime restrictions. These strategies might include hiring additional workers and reducing the hours worked by existing employees, investing in labor-saving equipment where possible, or diverting some tasks to outside contractors.
There are also aspects of the agricultural overtime issue that are difficult to quantify but should be considered in an assessment of the impact on farms and farm workers. First, the degree to which individual farming operations are able to limit overtime pay will vary greatly. Dairy farms and tree fruit producers tend to house many of their employees. Depending on the housing that is available, this may make it more difficult for these operations to add staff. Adding housing may be possible in some cases, but it might not be a cost-effective solution given regulations related to working housing and construction.
A second issue is that not all farms can pass their costs on to consumers, especially if their commodities can be produced in other states without overtime laws. For example, since a large majority of sweet cherry production in the United States comes from either California, Washington, or Oregon, tree fruit producers might possibly be able to extract higher prices from the market as their labor costs rise and aggregate supply adjusts downward. The opposite is true for dairy farms, as several states can produce milk with lower labor costs than found in the West Coast states.
Finally, the operational challenges associated with transitioning to the new overtime system should not be underestimated. Some farms have had to convert full-time salaried employees to an hourly basis to comply with the legislation and report that the transition has caused some degree of tension and increased management burden. Managing payroll is likely to become particularly difficult for some smaller tree fruit producers and berry producers that pay for harvest or pruning on a piece-rate basis. Complying with overtime regulation requires that the average piece-rates be calculated and tracked, which may require investment in more sophisticated labor management systems than these farms have traditionally used. While these factors may seem trivial for those not involved with managing small agricultural businesses, they may affect the survival of some operations.
Buccola, S., C. Li, and J.J. Reimer. 2012. “Minimum Wages, Immigration Control, and Agricultural Labor Supply.” American Journal of Agricultural Economics 94(2):464–470. https://doi.org/10.1093/ajae/aar063
Chavez Santos, E., M. Flores Moreno, A. Hernandez, R. Moreno Garcia, J.T. Spector, I.J. Ornelas, and B. Baquero. 2025. “‘A Veces No Aguantas lo Pesado Que Es el Trabajo’: A Qualitative Study on Work Conditions, Labor and Social Policies, and Health Among Latino Agricultural Workers in Washington State.” SSM - Qualitative Research in Health 7:100507.
Highland Economics. 2021. Economics of Agricultural Overtime Pay in Oregon: Executive Summary Potential Effects on Farms and Farmworkers.
Hill, A. 2023. “California’s Overtime Law for Agricultural Workers: What Happened to Worker Hours and Pay?” ARE Update 27(1).
Li, A., and J.J. Reimer. 2021. “The U.S. Market for Agricultural Labor: Evidence from the National Agricultural Workers Survey.” Applied Economics Perspectives and Policy 43(3):1125–1139. https://doi.org/10.1002/aepp.13054
Oregon Legislative Assembly, 2022. Agricultural Worker Overtime Pay. H.B. 4002, 81st Assembly, 2022 Regular Session. Available online: https://olis.oregonlegislature.gov/liz/2022R1/Downloads/MeasureDocument/hb4002/A-Engrossed
Sorte, B., J.J. Reimer, and G.B. Jones. 2021. Oregon Agriculture, Food and Fiber: An Economic Analysis. Oregon State University. Available online: https://agsci.oregonstate.edu/sites/agscid7/files/main/about/oragecon_report_2021.pdf
Thompson, A., and C. Seavert. 2022. Enterprise Budget: Cherries, Sweet, Fresh Market. Oregon State University, AEB 0069. Available online: https://appliedecon.oregonstate.edu/sites/agscid7/files/oaeb/pdf/aeb0069.pdf
University of Minnesota Center for Farm Financial Management. 2025. FINBIN Farm Financial Database. Available online: www.finbin.umn.edu Accessed February 1, 2025.
U.S. Department of Agriculture Economic Research Service (USDA-ERS). 2024. “Tailored Reports.” Available at: https://my.data.ers.usda.gov/arms/tailored-reports
U.S. Department of Agriculture National Agricultural Statistics Service (USDA-NASS). 2022. “Table 72: Summary by Market Value of Agricultural Products Sold: 2022.” 2022 Census of Agriculture, Vol. 1, Chap. 1: U.S. National Level Data. Available online: https://www.nass.usda.gov/Publications/AgCensus/2022/Full_Report/Volume_1,_Chapter_1_US/
———. 2022. “Table 31: Fruits and Nuts: 2022 and 2017.” 2022 Census of Agriculture. Volume 1, Chapter 2: State Level Data. Available online: https://www.nass.usda.gov/Publications/AgCensus/2022/Full_Report/Volume_1,_Chapter_2_US_State_Level/
———. 2024. “Farm Labor.” Available at: https://usda.library.cornell.edu/concern/publications/x920fw89s?locale=en

