The growth in student debt in the United States has become a cause for concern, with many scholars referring to the current situation as a building “crisis” (Goldrick-Rab and Steinbaum, 2020; Perry and Spencer, 2018; Razaki, Koprowski, and Lindberg, 2014). At the beginning of 2006, total student debt, or loans taken out to pursue higher educational opportunities, was approximately $481 billion. By the beginning of 2019, that amount has grown to nearly $1.6 trillion (Figure 1, Table 1).
| 2019 Level (%trillions) |
Percentage Change from 2006 (%) |
|
| Student loans | 1.6 | 232 |
| Consumer credit | 4.1 | 70 |
| Mortgage | 15.5 | 24 |
While student loan debt remains smaller than consumer credit debt ($4.1 trillion) or mortgage debt ($15.5 trillion), the rate of growth of student debt is alarming. Since 2006, consumer credit debt grew by about 70% and mortgage debt grew by only 24%, but student loan debt grew by 232%. Although student loan debt is just a fraction of mortgage and consumer debt, if the larger economy were to enter a serious recession, such as the current economic crisis caused by COVID-19, the rates of defaults on student debt could further weaken the financial markets.
Based on an analysis of survey data from American four-year universities and colleges by the Institute for College Access & Success (2018), the average student debt at graduation ranged from $4,400 to $58,000. Average student debt level rose from $18,650 in 2004 to $29,650 in 2016. The Institute of Educational Sciences (2018), part of the U.S. Department of Education, found that the 1995–1996 cohort of entering freshman owed a median percentage of 70% in principal after 12 years and 22% after 20 years. The percentage of principal owed has increased. For those who began postsecondary education in 2003–2004, the median percentage owed in principal was 78% of the total principal amount borrowed 12 years after beginning college.
Researchers have offered numerous reasons for this explosion in student debt (Razaki, Koprowski, and Lindberg, 2014), including rising tuition and fees in response to declining tax dollars going to public universities, a growing number of students from lower- and middle-income families seeking higher education, students’ fiscal illiteracy, and growth in predatory for-profit colleges, among others. There is likely no single cause, and several policy options for how to address this potential fiscal crisis have been proposed, which we discuss below.
The potential crisis from the explosion in student debt takes two forms. The first, and most critical, is how rising student debt may affect local economies. Debtors do not have as much access to the capital necessary to start a business, purchase a home, or invest in other assets that collectively contribute to community development. While numerous authors (Cornelius and Frank, 2015) have speculated about how student debt might affect students’ decisions post education, including postponing the purchase of an automobile and delaying marriage and having children, it is only recently that more rigorous analysis has been conducted. From a community economic development perspective, the relevant research falls into three broad categories: labor market outcomes, patterns in entrepreneurship, and home ownership decisions. We explore each of these categories.
Briefly, the second concern relates to student loan defaults, which could strain the financial system. Dynarski (2015) reports considerable variation in the characteristics of the nearly 7 million student loan borrowers in default, including whether individuals had completed their degree and levels of income after finishing their educations. The Institute of Educational Sciences (2018) analysis of those who had begun postsecondary education in 2003–2004 found that, of students who obtained a bachelor’s degree or higher, only 3.5% were in default after 12 years and 11% of those obtaining an associate degree were in default. Meanwhile, 29.9% of those that experienced some college but did not obtain a degree were in default. The same analysis found that those in the lower quartile of income after school defaulted at a rate of 21.6%, but the default status was 11.7% for the highest income quartile. Although the majority of student debt is through the federal government, not private banks, a weakening of the economy, such as the current economic crisis cause by COVID-19, could see a large increase in defaults and further threaten the stability of the financial system and represent a significant risk exposure.
The literature concerned with how student debt affects labor market outcomes is composed of two competing theories. The first maintains that high debt levels encourage a student be to less selective about employment (i.e., take a lower-paying job) because they are simply focused on repaying the debt. The second suggests students with more debt will seek out higher-paying but higher-risk jobs so they can more easily repay their debt. An outcome of this latter view suggests that lower-paying occupations such as teaching or law enforcement will be less attractive. The available research tends to favor the second hypothesis (Minicozzi, 2005), but results vary by level of education. The differences across individuals with student debt makes it difficult to draw broad generalizations.
In support of the first hypothesis on student debt impacts on labor market outcomes, Weidner (2016) finds that an additional $10,000 of student debt reduces earnings by 1%–2% in the first year of employment because higher debt induces someone to find a job more quickly and thus may take a lower-paying job or a job in a field unrelated to their area of study.
But, in a study of students at the University of Virginia, Sullivan (2018) finds that students with higher debt levels tended toward degrees in business and economics, perhaps with an eye toward higher-paying jobs. Rothstein and Rouse (2011) find that debt causes graduates to choose substantially higher-salary jobs and reduces the probability that students choose low-paid “public interest” jobs. Gervais and Ziebarth (2019) find no evidence for a negative effect of student debt on earnings in the short or long run.
While these results may suggest that our understanding of labor market outcomes is unclear, we must avoid making broad generalizations by treating all students who have debt as a homogeneous group. Based on the descriptive analysis of the Institute of Educational Sciences (2018), it is clear that not all students who have student loan debt obtained the same level of educational outcomes and those differences make it difficult, if not impossible, to draw broad generalizations about labor market outcomes.
Another element of the labor market outcome question takes the form of entrepreneurial activity (Ambrose, Cordell, and Ma, 2015; Krishnan and Wang, 2018). Not only is the creation of a new business a viable employment option, but the importance of new business formation to economic growth, particularly in rural areas, is well established in the literature (Deller, Kures, and Conroy, 2019). Baum (2015) provides three potential mechanisms that could link student debt and entrepreneurship. First, people who were inclined to start a business before assuming student debt may be deterred because of perceived success risks associated with entrepreneurship. While estimates of business survival rates vary by study, a general rule is that 50% of all new startups do not survive after five years (Deller and Conroy, 2016). Second, salary or proprietor income from new ventures is uncertain, particularly in the first few years. Without guaranteed income, former students may be unable to make debt payments or support living costs. Third, new businesses may be undercapitalized because student debt limits the ability of the potential entrepreneur to secure sufficient financing. Indeed, some have made the observation that the rapid growth in student debt levels corresponds to the national slowdown in new business formation.
The third manner in which student debt can affect the larger community is through homeownership (Cooper and Wang, 2014; Elliott and Lewis, 2015). For many communities, particularly smaller and more rural communities, the decision to purchase a home is viewed as a commitment to the community. Renters are more transient and less likely to make that commitment. Further, homeownership is important in helping rates of entrepreneurship. This comes from the commitment to the community as well as a source of potential financing for a business startup or expansion because homeownership builds wealth through equity. Xu et al. (2015) also argue that high student debt levels are a deterrent to homeownership because of the inability to secure financing as well as the desire for the person to be more footloose if alternative employment opportunities become available.
A handful of studies (e.g., Houle and Berger, 2015) challenge this conventional wisdom. Young adults who are willing to assume student debt may be taking a longer-term view surrounding the decision to purchase a home. Higher lifetime earnings potential among those with higher education outweighs the short-term burden of student debt repayment. Further, a key element of the research into this question hinges on how young adults are defined. A young adult in their early to mid 20s with student debt is different from a young adult in their early 30s.
The potential student debt crisis is a cause for concern, but it is unclear how such a crisis might impact local communities. While our research foundation is growing and finer insights are being gained, it is becoming more difficult to make broad generalizations. In essence, there is too much variation across students to make definitive statements. Debtors represent nearly every corner of demographic categories and pursue widely varying educational achievements, from associates to doctoral degrees.
One area that has received surprising little attention is difference in student debt and community outcomes across the rural-urban spectrum. Within the context of “rural brain drain,” Tabit and Winters (2019) find that individuals with student loan debt are less likely to remain in rural areas than those with no debt. Indeed, the rate of out-migration from rural to urban is highest for those individuals with the highest levels of debt. They also find that the delinquency rates and balance reduction is lower for those who move from rural to urban areas than for those that remain.
In terms of the community outcomes discussed, Minicozzi’s (2005) suggestion that individuals with student debt will seek higher paying jobs in order to pay of their debt more easily poses a challenge for rural areas, which typically have lower pay scales than urban areas. Rothstein and Rouse’s (2011) research suggesting that student debt reduces the probability that an individual take a lower-paying “public-interest” job is equally challenging for rural areas. School districts and governments are often the largest employers in rural counties. Additionally, some have argued that the teacher shortage is compounded by high student debt and low salaries in rural areas.
New firm births buoy net job growth in rural areas (Deller, Kures, and Conroy, 2019). Therefore, threats to entrepreneurial activity through reduced access to capital and greater risk are particularly troubling for rural areas, where net job creation is overwhelmingly driven by the birth of new firms. Beyond this analysis, very little is known about student loan debt within a rural context. The aim of this analysis is to explore these differences using county level data from the U.S. Internal Revenue Service (IRS).
One of the fundamental difficulties of studying the impact of student loan debt on the community or regional economy is the lack of quality data. Unfortunately, the federal government does not consistently collect or report student loan data at the community or regional level. Most studies of student debt are based on a handful of colleges and universities that collect and make available such data on their alumni. Detailed individual data from credit reporting agencies are generally beyond the grasp of researchers.
One data source that is widely available and is consistent over time and across regions is the summary tax file information provided by the Internal Revenue Service (IRS). These data represent summary data from individual tax returns aggregated to the county level and are available from 1989 to 2016. The 2016 data include the number of tax returns declaring student loan interest deductions and the amount of the interest deductions. For example, in Wisconsin, 293,110 individual filers (10.3%) declared student debt interest on their tax returns. Unfortunately, this only captures individuals who itemized for their federal taxes and reflects interest payments and not level of debt. Individuals who itemize generally have higher incomes (Harris and Baneman, 2011). In addition, regardless of income, individuals who spend a larger portion of their income on qualifying deductions are more likely to itemize. We would expect two of the largest deductions—charitable contributions and home mortgage interest—to impact the local community. In other words, by narrowing the analysis to individuals who do itemize their income taxes, we are omitting lower-income individuals and individuals who are less likely to own a home and less likely to support their community through charitable donations. This could result in an underestimate of the negative impact of student debt on community outcomes because we are not capturing lower-income individuals who have student debt but do not itemize their federal taxes. This limitation to the data is important because the growing academic literature suggests that student debt has a disproportionate impact on lower-income individuals (Choi, 2011).
Finally, disclosure rules apply, meaning there are no data available for the most rural communities. A mapping of the amount of student debt interest payment per return declaring such payments finds that there are large parts of the Great Plains, some of the most rural and least populated counties in the United States, where data are unavailable. Despite these limitations, the IRS data are an excellent alternative to the piecemeal college and university sourced data and the difficult-to-source credit rating agency data.
Based on the IRS data, the typical filer who declared payment of student debt paid about $1,004 annually in interest; assuming an interest rate of about 6%, the average level of debt is about $16,700. The county with the highest level ($1,360) is the more urban Morgan County in the north-central part of Alabama, with a population of about 119,500 and median household income of $37,800. The lowest level ($655.56) is rural Woodruff County, in the Delta region of Arkansas, with a population of 7,300 and median household income of $22,100. A noticeable difference between the two is that Morgan County has been experiencing strong economic growth, while Woodruff County has been seeing significant out-migration.
The simple mapping of the IRS student debt data suggests that there are spatial patterns identifiable across the United States. Indeed, a spatial clustering technique (the Getis-Ord Gi* spatial clustering statistic method), identified areas that are consistently high (hot-spots) as well as consistently low (cold-spots) (Figure 2). For other areas, the patterns are not statistically meaningful. The triangle from New England south through Virginia then northwest to Chicago is a “hot spot,” or an area with higher levels of student debt. Other “hot spots” include a range from South Carolina through central Alabama, the Twin Cities region of Minnesota, Denver and northern Colorado, and the coastal region of Oregon. There are also several “cold spots,” regions with lower levels of student debt, including a band from West Virginia west to Arkansas, the Mississippi Delta region, large parts of New Mexico, as well as Utah and a few other isolated areas such as very northern Wisconsin and the Rio Grande Valley of Texas. While some more urban areas, such as the Twin Cities and Denver, stand out as hot spots and some more rural areas, such as northern Wisconsin, are cold spots, we cannot infer that levels of student debt vary significantly across the urban–rural spectrum using this spatial clustering method.
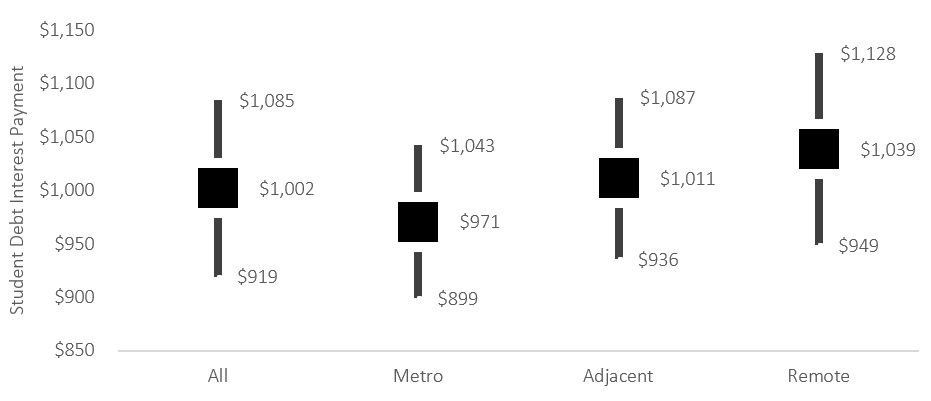
To gain further insights into urban–rural differences in student debt, we group the data into metro, nonmetro adjacent to metro, and nonmetro remote counties and conduct a series of subsample equivalency tests (F-test, median test, Wilcoxon, etc.) to determine whether there are substantial differences between groups. We provide the subsample means in Figure 3. Each subsample equivalency test indicates that the subsamples are statistically different. There is a clear pattern of higher levels of student debt moving from metro ($971) to remote rural ($1,039) areas. If the findings of Tabit and Winters (2019) are correct and people with higher student debt tend to relocate from rural to urban areas seeking stronger economic opportunities, coupled with the descriptive analysis reported here (Figure 3), we could expect to see accelerated rates of rural brain drain as student debt levels continue to increase.
To gain additional insights into the impact of student debt on community outcomes we estimated a series of simple correlations of our proxy measure of debt on a range of community outcomes. These outcomes include the percentage of residents within the county that are owner occupied, the percentage of renters that are facing housing fiscal stress, the business birth rate as a measure of entrepreneurship, the percentage of income donated to charities and the percentage of income going into retirement accounts. The first two measures are from the American Community Survey (2017 five-year average), the business start-up rates are from Business Information Tracking Series developed by the Census Bureau, and the charity and retirement saving data are from the IRS files, from which the student debt data are drawn. Simple correlations are estimated for the full sample of counties, as well as metro, nonmetro adjacent, and nonmetro remote subsets (Table 2).
| All Counties | Metro | Adjacent | Remote | |
| Percentage of housing owner occupied | 0.1932*** (0.0001) |
0.2108*** (0.0001) |
0.1051** (0.0011) |
0.1543*** (0.0001) |
| Percentage of renter occupied paying 30% or more of income on rent | -0.3269*** (0.0001) |
-0.3527*** (0.0001) |
-0.2173*** (0.0001) |
-0.1362** (0.0003) |
| Business birth rate | 0.0029 (0.8783) |
-0.0237 (0.4311) |
0.0746** (0.0211) |
0.0040 (0.9158) |
| Percentage of income donated to charity (IRS) | -0.1515*** (0.0001) |
-0.1235*** (0.0001) |
-0.0414 (0.2009) |
-0.1445*** (0.0001) |
| Percentage of income going to retirement accounts (IRS) | -0.2502*** (0.0001) |
-0.4572*** (0.0001) |
-0.1641*** (0.0001) |
-0.2053*** (0.0001) |
Given the current thinking around student debt, we expect to find that higher student debt leads to lower rates of home ownership and higher rates of stress in the rental market. If people with higher debt levels are excluded from the home ownership market, they are forced into the rental market, placing upward pressure on rental pricing and thus higher levels of rental stress. We also expect higher student debt to be linked to lower rates of entrepreneurship, lower rates of charitable donations, and lower rates of savings for retirement. Lower rates of entrepreneurship will place a drag on economic growth and development, lower rates of charitable donation will hinder the ability of nonprofits to provide services in the community, and lower rates of retirement saving will create greater financial stress in the long term.
Based on the simple correlation analysis, it appears that higher student debt levels are actually tied to higher rates of home ownership within the community. This result is more consistent with the findings of Houle and Berger (2015) and challenges the conventional wisdom that higher levels of student debt deter homeownership. This result holds not only for all counties aggregated together, but also across the urban–rural spectrum. We also find that higher student debt is not associated with greater stress in the rental market. Indeed, the student debt and rental stress relationship is negative but weaker in more rural areas than in metro areas. Thus, at the community or regional level, higher levels of student debt do not hinder the housing ownership or rental markets based on our IRS proxy data.
In terms of entrepreneurial activity, measured by the formation of new businesses, the correlation coefficients tend to be statistically insignificant, suggesting no relationship between student debt and community-level entrepreneurship. Indeed, for nonmetro counties that are adjacent to metro counties, there is some evidence of a weak positive relationship. Based on this simple analysis, student debt does not appear to negatively affect entrepreneurship and may have a weak positive affect in nonmetro adjacent counties.
We do see that higher student debt has the expected negative affect on donations to charities and retirement savings. For charitable donations, the negative relationship holds for all counties aggregated together, metro counties, and remote counties but is not statistically significant for metro-adjacent counties. The negative affect on retirement savings is the strongest for metro counties and but still weakly negative for the two nonmetro county categories.
These results taken together suggest that higher student debt does not impact the housing market or rates of entrepreneurship as one might expect but does have a negative effect on charitable donations and retirement savings. The data seem to suggest that people with student debt prioritize housing over other uses of their income such as donations and retirement savings. This makes intuitive sense: Housing is a primary need, but charitable donations are a “luxury” that can be put aside and saving for retirement can be deferred to later in life. Further, while there are subtle differences across the urban–rural spectrum, these differences seem to be modest at best.
The results presented here are not without their limitations. Our measure of student debt is drawn from IRS data, which only capture those tax filers who declared student debt. Our two measures of the housing market do not address the quality of housing, while the measure of entrepreneurship only captures those start-ups with at least one employee. Specifically, self-employed people who do not formally hire workers are not captured. Charitable donations and savings for retirement also only capture those federal tax filers who report donations and savings on their tax returns. Donations to charitable causes can take many forms, such as volunteering time, which are not reflected in the IRS data. In addition, our retirement savings data only capture savings that are eligible for special federal tax retreatment and do not capture savings in the form of mutual funds or even U.S. Savings Bonds. Further, simple correlation analysis masks important underlying factors such as variation among people who have student debt.
Student debt is increasing at an alarming rate (Figure 1). While student loan debt is just a fraction of mortgage and credit card debt, if the larger economy were to enter a prolonged recession, the rates of defaults on student debt could further weaken financial markets and restrict access to capital that an individual would invest in his or her education. The global COVID-19 pandemic and subsequent economic shutdown represent a shock to the economy that may further drive student loan defaults.
Our analysis, proxied by interest payments declared on federal income tax returns, finds that while student debt is higher on average in more rural areas compared to metropolitan counties, the outcome on housing and entrepreneurial activity is not as expected. Rather than lower rates of home ownership and greater stress in the rental markets, the exact opposite is observed. Entrepreneurship rates appear to be unaffected by student debt and, for nonmetro adjacent counties, higher student debt is associated with weakly higher rates of entrepreneurship. We do find evidence of lower levels of charitable donations, particularly in metropolitan areas, as well as savings for retirement.
For rural areas, the results of Tabit and Winters (2019), when matched with our findings (Figure 3), are of most concern. In their analysis of the “rural brain drain,” Tabit and Winters find that individuals with higher levels of student debt who relocate to urban areas tend to do better than those who remain in rural areas. The argument is that better economic opportunity in urban areas is particularly attractive to people with higher levels of student debt. If student debt tends to be higher in rural areas, as the IRS data suggest, we might expect to see growth in levels of student debt to accelerate rural brain drain. Although rural housing costs may be lower than those in urban areas, that fact does not appear to sufficient to compensate for the greater economic opportunities in urban areas.
The federal government maintains the Public Service Loan Forgiveness (PSLF) program, which forgives federal student loans for borrowers employed full-time (30 hours or more per week) for ten years in most federal, state, local, or nonprofit positions. The breadth of this program does not specifically support rural communities, but some states have developed smaller, targeted debt forgiveness programs. Mississippi offers up to $12,000 over four years to indebted graduates who work as teachers in underserved areas of the state. The Learning Policy Institute (2016) found that state programs were generally effective at recruiting and retaining high-quality teachers in underserved areas. Many states maintain similar programs for lawyers, doctors, and other education-intensive careers, where rural wages are unlikely to draw candidates with high levels of debt.
One consistent policy recommendation coming from the relevant literature is to help students better understand the financial ramifications of undertaking student debt. Perry and Spencer (2018) and Andruska et al. (2014) maintain that too many students lack experience with credit or loan terms, and the complexity of student loans can place students at a strong disadvantage. Further, students may miscalculate the expected returns of education, particularly in the short term, compared to debt repayment obligations. While the long-term returns to higher education are well understood, the short-term returns may not be sufficient to make student debt payments.
As more high schools in both rural and urban communities are emphasizing college preparation classes and steering students toward higher education—whether through technical schools, junior colleges, or four-year institutions—financial planning should be part of that preparation. Communities and high schools can work with students to improve their personal financial skills and encourage students who are more likely to depend on student debt to pay for higher education to explore low cost options such as local/regional technical schools or junior colleges for an associate degree then transfer to a four-year institution. Communities and high schools can also make students aware of existing state and federal debt forgiveness programs, including a list of local jobs and organizations that would qualify for the programs.
Ambrose, B.W., L. Cordell, and S. Ma. 2015. “The Impact of Student Loan Debt on Small Business Formation.” Working Paper. Available online: https://ssrn.com/abstract=2417676.
Andruska, E.A., J.M. Hogarth, C. Needles Fletcher, G.R. Forbes, and D.R. Wohlgemuth. 2014. “Do You Know What You Owe? Students’ Understanding of Their Student Loans.” Journal of Student Financial Aid 44(2): 125–148.
Baum, S. 2015. Does Increasing Reliance on Student Debt Explain Declines in Entrepreneurial Activity? Posing the Question, Gathering Evidence, Considering Policy Options. Research Report. Washington, DC: Urban Institute.
Choi, L. 2011. Student Debt and Default in the 12th District. San Francisco, CA: Federal Reserve Bank of San Francisco, Community Development Research Brief.
Cooper, D., and J.C. Wang. 2014. Student Loan Debt and Economic Outcomes. Boston, MA: Federal Bank of Boston, Current Policy Perspectives No. 14–7.
Cornelius, L.M., and S.A. Frank. 2015. “Student Loan Debt Levels and Their Implications for Borrowers, Society, and the Economy.” Educational Considerations 42(2): 35–38.
Deller, S.C., and T. Conroy. 2016. “Survival Rates of Rural Businesses: What the Evidence Tells Us.” Choices 31(4).
Deller, S.C., M. Kures, and T. Conroy. 2019. “Rural Entrepreneurship and Migration.” Journal of Rural Studies 66(February): 30–42.
Dynarski, S. 2015, August 31. “Degrees of Debt: Why Students with Smallest Debts have the Larger Problem.” New York Times, p. A3.
Elliott, W., and M. Lewis. 2015. “Student Debt Effects on Financial Well-Being: Research and Policy Implications.” Journal of Economic Surveys 29(4): 614–636.
Gervais, M., and N.L. Ziebarth. 2019. “Life after Debt: Postgraduation Consequences of Federal Student Loans.” Economic Inquiry 57(3): 1342–1366.
Goldrickâ€Rab, S., and M. Steinbaum. 2020. “Effective Treatment for the Student Debt Crisis Requires an Accurate Diagnosis.” Journal of Policy Analysis and Management 39(2): 548–550.
Harris, B.H., and D.H. Baneman. 2011. “Who Itemizes Deductions?” Washington D.C.: Urban Institute and Brookings Institute Tax Policy Center. Available online: https://www.taxpolicycenter.org/sites/default/files/alfresco/publication-pdfs/1001486-Who-Itemizes-Deductions-.PDF
Houle, J.N., and L. Berger. 2015. “Is Student Loan Debt Discouraging Homeownership among Young Adults?” Social Service Review 89(4): 589–621.
Institute for College Access & Success. 2018. Student Debt and the Class of 2017. Washington DC: Institute for College Access & Success.
Krishnan, K., and P. Wang. 2018. “The Cost of Financing Education: Can Student Debt Hinder Entrepreneurship?” Management Science 65(10).
Minicozzi, A. 2005. “The Short Term Effect of Educational Debt on Job Decisions.” Economics of Education Review 24(4): 417–430.
Perry, A., and C. Spencer. 2018. “College Didn’t Prepare Me for This: The Realities of the Student Debt Crisis and the Effect It Is Having on College Graduates.” William & Mary Educational Review 6(1): 1.
Razaki, K.A., W. Koprowski, and D.L. Lindberg. 2014. “The Student Loan Crisis: Background, Motivations of Participants, and Regulatory Issues.” Journal of Business & Accounting. 7(1): 94–104.
Rothstein, J., and C.E. Rouse. 2011. “Constrained after College: Student Loans and Early-Career Occupational Choices.” Journal of Public Economics 95(1–2): 149–163.
Sullivan, Z. 2018. “The Impacts of Student Loan Debt on College and Early-Career Decisions.” Charlottesville, VA: University of Virginia, Department of Economics, Working paper.
Tabit, P.J., and J. Winters. 2019. “‘Rural Brain Drain’: Examining Millennial Migration Patterns and Student Loan Debt.” Consumer & Community Context 1(1).
U.S. Department of Education. 2018. Repayment of Student Loans as of 2015 among 1995–96 and 2003–04 First-Time Beginning Students First Look. Washington DC: U.S. Department of Education, Institute of Educational Sciences.
Weidner. J. 2016. “Does Student Debt Reduce Earnings?” Princeton, NJ: Princeton University, Department of Economics, Working paper.
Xu, Y., C. Johnson, S. Bartholomae, B. O'Neill, and M.S. Gutter. 2015. “Homeownership among Millennials: The Deferred American Dream?” Family and Consumer Sciences Research Journal 44(2): 201–212.

