Over the past several years, the market for plant-based (PB) analogs for animal products has shown significant growth. The U.S. market for PB foods reached $8 billion in 2022, a 44% increase in sales since 2019 and a 7% increase from 2021 (Ignaszewski, 2023). PB milks dominate the PB market ($2.8 billion in sales in 2022). However, the market continues to expand and provides a variety of alternatives to nonliquid dairy products (such as yogurt and cheese), meat, chicken, and fish products. Despite continued and fast growth, PB products comprise a relatively small market compared to their animal-based counterparts. The Good Food Institute (GFI) identified a trifecta of factors that drives or limits consumer interest in plant-based products: taste, price, and convenience. High premiums of niche commodities are a known impediment to higher adoption by consumers, even if consumers are interested. For example, organic products typically receive a premium over nonorganic products because of higher production costs. Sales for organic products with lower premiums (such as spinach, granola, and carrots) tend to enjoy larger market shares than those with higher premiums (Carlson and Jaenicke, 2016). This paper quantifies the price premium of PB foods over animal-product counterparts from 2019 to 2022 and discusses relevant history and input costs of both PB and animal products that may contribute to the price disparity.
The growing interest in PB products has implications for consumers, producers, and policy makers alike. Traditional livestock farming has raised concerns about zoonotic diseases, water eutrophication, greenhouse gas emissions, biodiversity loss, antibiotic resistance, and animal welfare (Tilman et al., 2017; Poore and Nemecek, 2018; Springmann et al., 2018; UNEP and IRLI, 2020; WHO, 2021). These concerns have led to government funding for alternative proteins, both directly through grants such as the U.S. Department ofAgriculture (USDA) National Institute of Food and Agriculture’s $10 million grant to establish the National Institute for Cellular Agriculture at Tufts University as well as indirectly through research at the USDA Agricultural Research Service that may relate to optimizing certain crops for PB foods even when the primary purpose of the research is toward a different end. Tracking structural changes in consumer preferences and diets can inform priorities on research decisions. For example, a rise in PB meat demand could offset traditional meat consumption, amounting to less profit for traditional livestock producers. On the other hand, a rise in PB meat would introduce new opportunities for producing input crops. Similarly, as the market share for certain PB foods increases, suppliers will need more input crops, which may have broader market effects and impact legislative funding, insurance, and policy decisions.
Food manufacturers continuously innovate in the PB product field, releasing new PB milks, cheeses, beef-like burgers, or seafood. We obtained UPC-level retail sales data on PB products for 2019 through 2022 from SPINS, a market research company focused on the natural, organic, and specialty products industries. The data are point-of-sales from partner retailers spanning over 108,000 conventional multioutlet retail locations, including grocery, club, and drug stores in partnership with Circana (formerly Information Resources Inc.) as well as over 1,800 natural food stores, defined as having more than $2 million in annual sales as well as 40% or more of UPC coded sales from natural, organic, or specialty products (for example, co-ops and independent stores). The rich dataset includes sales information by product, such as brand name, product name, package size, dollar sales, and quantities sold.
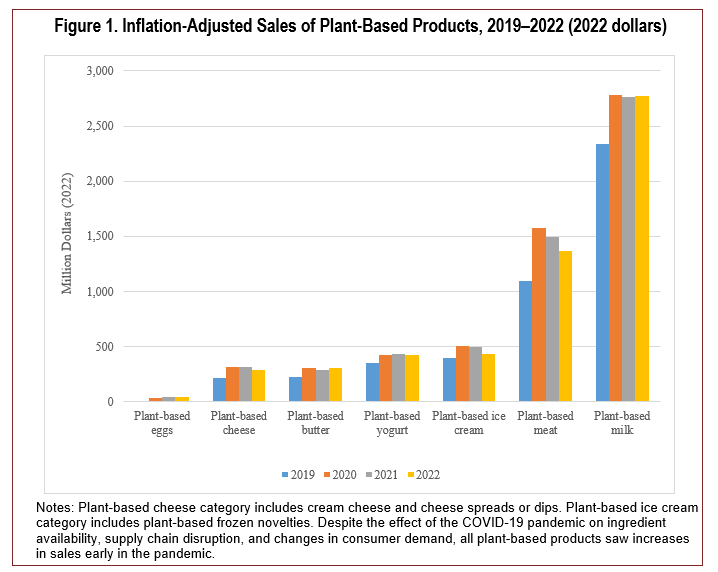
From 2019 to 2022, the PB products market has grown for all categories observed (Figure 1). Notably, in 2020, patterns of retail food sales changed as consumers stayed home due to social distancing measures related to the COVID-19 pandemic. The PB market expanded early in the pandemic. During the first year of the pandemic, inflation-adjusted retail sales for all PB categories increased. Nominal sales of PB meat increased by 31% from 2019 to 2020 and inflation-adjusted sales increased by 44%. PB milk, the category with the lowest nominal growth in 2020, grew by 17%. During the second year of the pandemic, food prices grew at an elevated rate of 3.9%. Still, despite the “pandemic slump,” nominal spending on
all categories except PB meat increased in 2021 relative to 2020. After accounting for inflation, PB sales increased for eggs, cheese, and yogurt but fell for PB butter, ice cream, and meat.
However, 2022 saw the fastest increase in food prices since 1979. The Bureau of Labor Statistics Consumer Price Index showed food prices increased by 9.9% in 2022. Unsurprisingly, PB foods, which carry a premium relative to their traditional counterparts, experienced slower growth or even sales declines after accounting for price inflation. Inflation diminishes consumers’ budgets,sometimes forcing them to substitute with lower-price alternatives. Inflation-adjusted sales of PB cheese (including cream cheese and cheese dips), yogurt, ice creams and novelty frozen products, and meat declined in 2022. Nevertheless, inflation-adjusted sales increased by almost 6%, for PB eggs and by over 6% for PB butter. PB milk was stable, growing at 0.5%. Additionally, sales of all PB products in 2022 were significantly higher than pre-pandemic levels. After adjusting for inflation, 2022 sales relative to 2019 were 291% higher for PB eggs. Even the market for PB milk, which has a more extended history of consumer acceptance, grew by 19% relative to 2019.
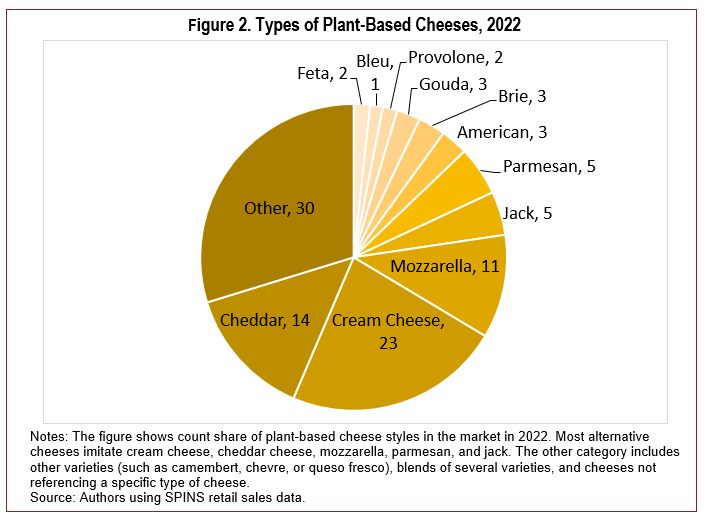
Some of the growth in the PB market can be attributed to the sector’s ability to release creative and innovative products that aspire to recreate well-known tastes and textures of animal-based products. For example, PB companies model PB cheeses after increasingly
diverse varieties and flavors of dairy cheeses. In 2022, 14% of PB cheese sold was explicitly marketed as cheddar style, 11% as mozzarella, and over 5% as parmesan. Many other cheese styles are also available to U.S. consumers, including brie, provolone, feta, gouda, and cheese blends (Figure 2). In 2019, the PB cheese market already had a significant diversity of cheese styles, but even since then, new types of cheeses have been introduced to the market, including new blends.
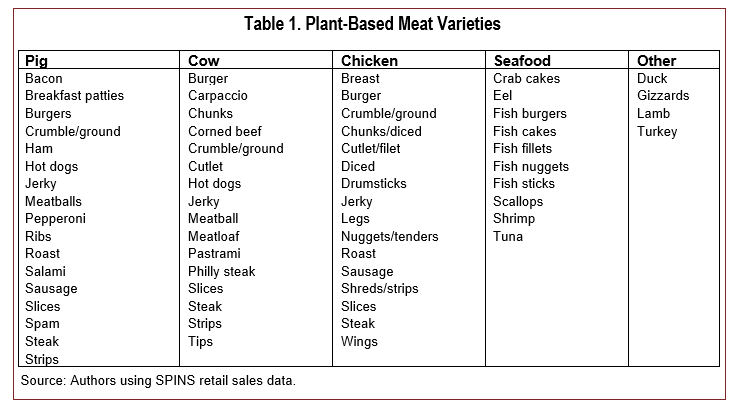
The PB meat category has also expanded the number of varieties available to consumers in recent years. Table 1 shows a list of cuts or products mimicking pork, beef, chicken, seafood, and other animal products found in the SPINS dataset. We categorize these products based on how companies market them. The categories are not entirely comparable because they often have differing tastes, textures, and nutritional qualities, but they are directly marketed as analogs. For example, a product may be labeled as “plant-based bacon” or “bacon alternative.” The meat alternatives also have entirely different inputs with separate supply chains. Aside from health, nutrition, environmental, and animal welfare reasons for adopting plant-based diets, these PB products may be attractive to consumers who cannot eat the traditional version. For example, according to kashrut, the dietary laws of Judaism, people cannot consume shellfish. However, if products such as PB crab cakes, eel, scallops, and shrimp are certified kosher,those following the laws of kashrut may consume them.Similarly, kashrut prohibits mixing dairy and meat.However, consumers adhering to this diet could combine a “kosher parve” (containing neither dairy nor meat ingredients) PB cheese with a meat hamburger. Similarly, other consumers may have health restrictions limiting their ability to consume certain products, including milk allergies, lactose intolerance, or alpha-gal syndrome, a tick-borne disease that induces an allergy to red meat.
Notes: Animal products as reported by the Bureau of Labor
Statistics (BLS). BLS surveys fortified whole milk in gallon
containers, yogurt in 8-oz. containers, butter in 16-oz. stick
form, ice cream in half-gallon containers, and eggs by the
dozen, as these are the most common sizes. For plant-
based products, we surveyed milk in half-gallon containers,
yogurt in 5.3 oz. containers, butter in 16-oz. stick form, ice
cream in 16-oz. containers, and yogurt in 5.3-oz. containers.
Source: Authors’ calculations using SPINS retail sales data
and Bureau of Labor Statistics.
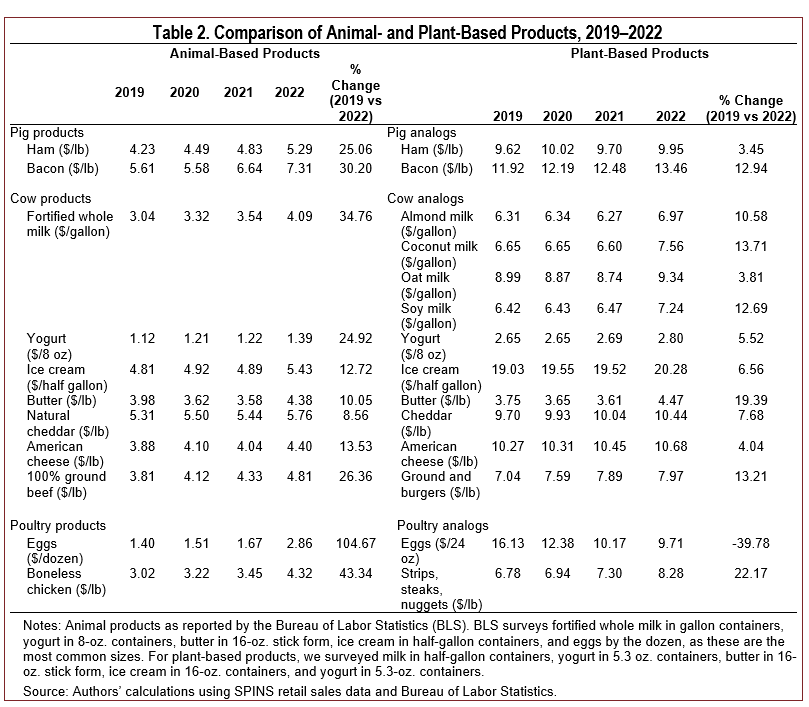
We compare SPINS weighted average retail prices of PB products with their animal-based counterparts to see how prices stack up and how prices have changed in the last 4 years, a period both of increased public awareness and interest but also of inflationary pressure and supply chain disruptions (Table 2). Prices may have changed due to various factors, such as pandemic effects, supply chain and labor disruptions, or changes in demand. We draw retail prices for pork, beef, chicken, eggs, milk, and dairy products from the Bureau of Labor Statistics (BLS) monthly prices averaged across all 12 months for retail sales in U.S. cities. Cost of production and farm returns data are from the USDA Economic Resource Service (ERS).
For the selected products we surveyed, we calculated comparable national PB prices by restricting our dataset to be as close as possible to container sizes typically sold for the animal-product counterpart. However, exact size comparison is not always possible, so we choose the closest option, as reported in Table 2. For example, BLS only reports yogurt sold in 8 oz. containers, but the market for PB yogurt sold in 8 oz. containers is small, with most plant-based yogurts being sold in 5.3 oz. containers. For each PB product, we then calculate the price per ounce by dividing the total sales in terms of dollars by the total volume sold in terms of ounces. When we were not able to restrict our sample to the same size container as the animal-product analog (for example, aside from yogurts, PB milks are typically sold by the half-gallon while we only had cow’s milk data by the gallon), we multiplied the price per ounce of the PB product by the number of ounces to match the sizing of the animal product. For example, in the case of PB milks, we doubled the half-gallon price to calculate the price of a full gallon to make it comparable to our cow’s milk data, or we converted the 5.3 oz price of PB yogurt as a $/8 oz. for comparison with animal-
Notes: Animal products as reported by the Bureau of Labor
Statistics (BLS). BLS surveys fortified whole milk in gallon
containers, yogurt in 8-oz. containers, butter in 16-oz. stick
form, ice cream in half-gallon containers, and eggs by the
dozen as these are the most common sizes. For plant-
based products, we surveyed milk in half-gallon containers,
yogurt in 5.3 oz. containers, butter in 16-oz. stick form,
ice cream in 16-oz. containers, and yogurt in 5.3-oz.
containers.
Source: Authors’ calculations using SPINS retail sales data
and Bureau of Labor Statistics.
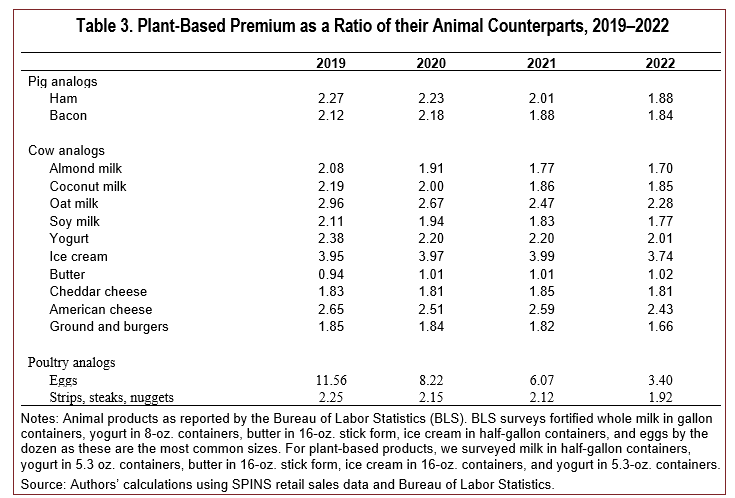
based yogurt. Table 3 reports premiums. Changes in premium levels are important, but the directionality of change can also paint a picture about whether the price premium may be narrowing or widening.
The cost of production for hogs increased from $79.14 to $106.27 per hundredweight, or 34%, from 2019 to 2022, largely due to a doubling in the cost of nursery andfeeder pigs. Meatpacking plant closures during the spring and summer of 2020 severely impacted meat production and increased prices. The increase in the cost of production and disruptions in input supply and processing capabilities led to general increases in all pig-derived products. During the pandemic, the prices of ham and bacon increased by 25% and over 30%, respectively, from 2019 to 2022.
Major ingredients in PB analogs include vital wheat gluten and tofu or soybeans. The farm-gate prices of wheat and soybeans also increased substantially between 2019 and 2022, by 96% and 76%, respectively (USDA-NASS, 2023a). Aside from pandemic-related supply chain disruptions and high food inflationary pressure, wheat prices have also been affected by Russia’s invasion of Ukraine and drought, severely affecting domestic supplies. Additionally, while initially not the case, as the PB sector has continued to increase, a large portion of the PB market now uses organic or non-GMO certified ingredients (OTA, 2022), further increasing the price of PB products given the premium associated with organic products. According to Mercaris (2023), a company that publishes data on organic commodity prices, food-grade organic soybean prices increased from the low $20s per bushel in 2019 to over $30 per bushel by the end of 2022. Food-grade organic wheat prices averaged $12.55 per bushel in 2019, increasing to around $19 per bushel at the end of 2022.
Of note is that field crops are typically not grown under a marketing contract. However, food markets for grains tend to be thinner, and processors choose to use contracting when the spot markets may be too risky to fulfill their necessary supply flow, particularly if they want to assure certain quality standards. In fact, about 50% of the organic soybean market is forward-contracted (Mercaris, 2023). If producers forward contract a significant amount of PB wheat and soybean, this would explain the more tempered price increase in 2021 and the eventual spike in 2022. Likely because of contracting, PB foods are more protected from short-term volatility.
Looking only at PB products that explicitly described themselves as “ham” or “bacon,” we find that the price ofPB bacon initially increased only moderately at the beginning of the pandemic, about 2% from 2020 to 2021,but then surged in 2022. Comparing 2019 to 2022 PB bacon prices, we find an increase of almost 13%. On the other hand, the price of ham analogs initially increased during the first year of the pandemic but fell in 2021. PB ham and bacon products are now relatively cheaper than they were pre-pandemic due to a lesser increase in price when compared to the animal products. In 2019, the retail price of PB ham was 2.3 times that of ham, falling to 1.9 by 2022. While PB bacon prices increased in the past few years, the rate of increase was significantly lower than animal-based bacon, narrowing the premium from 2.1 to 1.8 times the price of the animal-based product.
Early in the pandemic, school closures and stay-at-home orders led to an oversupply of cow’s milk and decreases in the producer price index of milk (Mead et al., 2020). As with most commodities, the bulk of the price increase for cow’s milk occurred from 2021 to 2022. The retail price of fortified whole milk increased by 34.76% from 2019 to 2022, partly driven by high production costs, which rose by 21.62%, from $22.71 in 2019 to $27.62 in 2022. Spikes in dairy feed costs in 2022 were a large culprit of the increased costs, increasing by 39.1% from 2019 to 2022 or by 17% from 2021 to 2022.
The primary inputs for cow’s milk and PB milk are quite different. While the primary inputs for cow’s milk prices are tied to feed ratio prices and replacement dairy cows, PB milks have differing primary ingredients, such as almonds, coconuts, or food-grade oats and soybeans. Prices per pound of almonds have had a negative trend since 2014, with record crops in California several years in a row pushing prices down (NASS, 2023b). In 2022, the price of almonds decreased to $1.50 per pound, the lowest price since 2002. Since 2017, fresh coconut annual prices have ranged between $27 to $31 per 40-pound sack, according to USDA Agricultural MarketingService San Francisco terminal prices on coconuts. The exception was 2021, when prices increased to $33.75. Accordingly, coconut milk prices also increased in 2022, from $6.60 per gallon to $7.56 per gallon. However, coconut prices had decreased to $31 by the next year. Finally, the U.S. imports food-grade oats from Canada or Europe. Volume is an issue for sourcing oats, so oat milk processors (and all food companies using oats) forward contract oats in advance. While food-grade oat prices are not available, oat prices overall have been affected by drought that hampered production conditions in Canada during the summer of 2021. According to the USDA’s World Agricultural Supply and Demand Estimates, price received for U.S. oats increased by 87% from 2019 to 2022 (NASS, 2023a). Generally, PB producers are likely contracting for almond, coconut, soybean, and oats as well as other needed ingredients, which would reduce the volatility of prices within a year.
While cow’s milk is most often sold in gallon jugs (and is reported by BLS only for gallon containers), PB milks are generally sold in half-gallon cartons. We limit our PB analysis to half-gallon containers to avoid differentiated prices of small personal containers and convert prices to gallon units for comparison. Like organic milks, whose price is about double the price of conventional milk (AMS, 2022), PB milks are about double the price of cow’s milk. The PB milk market, while the largest in the sector, is still a small share of the total milk market. From 2013 to 2018, PB milk prices reacted to shocks in the price of cow’s milk in the short run, showing that dairy milk is the price leader (Raszap Skorbiansky, Saavoss, and Stewart, 2022). However, the PB price premium has been declining over time. In 2019, the prices of almond, coconut, and soy milk were all more than twice the price of fortified whole milk, and oat milk was almost three times the price. By 2022, the ratios for almond, coconut, oat and soy milks had fallen to 1.7, 1.85, 2.28, and 1.77 times the price of fortified whole milk, respectively.
Nonliquid dairy product price increases were less dramatic than those in liquid milk, despite several overlapping inputs and costs of production with milk. Still, relative to pre-pandemic prices, all of these commodities experienced price inflation. From 2019 to 2022, prices of yogurt, ice cream, butter, cheddar cheese, and American cheese increased by 25%, 13%, 10%, 9%, and 14%, respectively. Similar to animal-based nonliquid dairy products, the PB analogs experienced less volatility year-to-year during the height of the pandemic. Lower price inflation in PB nonliquid dairy products may be due in part to the fact that the PB yogurt, cheese, and ice cream market is newer and smaller than the PB milk market, and so a larger percentage of their costs may be associated with research and development instead of raw ingredients. For example, the PB American cheese price increased by 4% and PB ice cream by 7% from 2019 to 2022, with most of the increase occurring in 2022, a year of significant price inflation.
As with milk, the prices of PB yogurts, cheddar cheese, and American cheese were about twice those of their animal-based counterparts in 2019. The exceptions were butter sticks, roughly at parity with traditional butter in 2019, and PB ice cream, which was over triple the price of traditional ice cream. In 2022, the premium of PB nonliquid dairy products declined for all PB nonliquid dairy products (except for butter). Still, the price premium remains about double. For example, the price premium of PB yogurt declined from 2.38 to 2.01 times the price of cow’s milk yogurt. The PB butter premium slightly increased but is still about parity with cow’s milk butter. The length of PB butter availability in grocery stores may be the reason why it has been close to cost parity with animal-based butter. Margarine manufacturing began in the second half of the nineteenth century, with plant-dairy hybrids coming to market in the post-war period and gaining popularity via “I Can’t Believe It is Not Butter!” spread, introduced in the early 1980s. PB butters are typically made by combining water with a plant-derived oil (such as avocado, coconut, olive, or palm).
As mentioned in the section on pig products, the spread of coronavirus and associated responses affected the meat supply. Pandemic-related shutdowns and drastically reduced operations of major U.S. poultry, beef, and pork processors and meatpacking plants affected meat supply. Additionally, school and restaurant closures shifted meat demand away from food services and toward grocery stores. However, the supply chains were not set up to facilitate such a shift. On the demand side, decreased global meat demand, especially for China, a prominent importer of U.S. meat and livestock, also affected U.S. markets. The result of these changes caused a spike in retail prices of meat in the spring of 2020. In the ensuing year, supply chain issues associated with the pandemic persisted, affecting some livestock input prices. (Balagtas and Cooper, 2021). According to the ERS (2022) Costs and Returns Report for cow-calf, the total cost of production per cow increased 25%, from $1,343 in 2019 to $1,683 in 2022. The biggest drivers of these costs were capital recovery of machinery and equipment, which increased from $271 to $376, and feed costs, which increased from $396 to $501. Other inputs that contributed to the increase in production costs included labor (paid and unpaid), taxes and insurance, and general farm overhead. All meat products were also affected by meatpacking plant closures during the pandemic. As a result, the retail price of 100% ground beef increased 26.36%, from $3.81 per pound in 2019 to $4.81 per pound in 2022.
The PB beef industry had problems as well. In addition to soy and wheat products, yellow peas, pea protein, and other beans are major ingredients in many plant-based meats (GFI, 2022a), providing a significant source of protein for PB meats. Canada is the largest pea-producing country and has drastically cut in their production due to drought in recent years. Meanwhile, in France, another large pea-producing country, a significant amount of the crop was damaged by weather events in 2021 and droughts in 2022. As shown in Figure 1, inflation-adjusted PB meat sales declined in 2021 and 2022. However, despite troubles in both supply chains, the premium for PB meat has been narrowing. In 2019, the premium for PB ground meat (for which we included grounds, meatballs, and patties) was 1.85 times higher than 100% ground beef. As shown in Table 3, the premium has declined annually and is now 1.66 times the price of 100% ground beef.
ERS does not report costs and returns for poultry products, but we can still look at changes in the cost of inputs. NASS provides indices for costs of major farm inputs, which inform the ERS Cost and Returns Reports. Between 2019 and 2022, the index for the cost of feed increased 24.5% and the index for farm fuel prices increased 41.7%. We concentrate on retail prices for boneless chicken breast as the most comparable to PB chicken analogs. Mirroring other meats, the price of boneless chicken breasts surged in recent years after increased input costs and supply chain disruptions, increasing 43% from 2019 to 2022, with the majority of the increase occurring in 2022. From 2020 to 2021, boneless chicken breast increased by 7.05%, from $3.22 to $3.45 per pound.
For PB chicken analogs, we looked at the weighted average price of products described as nuggets, tenders, shreds, chunks, fillets, cutlets, or strips. Similar to previous products, PB chicken products are often made with gluten, soybeans, pea proteins, and protein derived from legumes. PB chicken is a fast-growing category, as these products more closely match the taste, texture, and appearance of animal-based chicken (GFI, 2022b). From 2020 to 2021, individual PB chicken products experienced price increases, but a significant amount of the year-to-year growth was due to new companies and products entering the market, suggesting that prices are likely to fall as consumers shift to cheaper products or as the companies establish themselves and scale up. Despite additional inflationary pressure in 2022, the premium for PB chicken decreased annually, from 2.25 times its price in 2019 to 1.92 times its price in 2022.
Meanwhile, the recent outbreak of highly pathogenic avian influenza (HPAI) has impacted the retail cost of eggs. During the most recent outbreak, egg prices increased more rapidly than in the 2014–2015 HPAI outbreak. According to BLS data, the cost of large, grade A eggs increased 104.7% between 2019 and 2022, from $1.40 per dozen to $2.86 per dozen. The PB egg market can be separated into two categories: eggs for baking and eggs for eating. Baking-style egg replacers are a combination of starches and baking soda that can be combined with water to replace whole eggs, yolks, or egg whites in baking recipes. The other category is eggs for scrambles or omelets. These types are meant to recreate the texture and taste of eggs and can be made from a variety of ingredients, including mung beans, lupin beans, or soybeans. Penetration of PB eggs remains low as a share of the total egg market (0.6%, according to GFI, 2022a). However, PB egg prices have significantly declined every year from 2019 to 2022, going from $16.13 to $9.71 per 24 ounces (comparable to a dozen eggs). As a result, the premium dropped from a staggering 11.56 times the price of eggs in 2019 to 3.40 times the price in 2022.
The trajectory of the PB product price premiums is strongly dependent on continued investment. If price premiums become competitive with animal product counterparts, the PB market size will still rely on the ability of companies to continue improving texture, taste, accessibility, and consumer interest in the products. In 2022, capital investments in PB meat, seafood, eggs, and dairy companies were $1.2 billion, 41% lower than in 2021 due to challenging macroeconomic and market conditions (GFI, 2023). Despite the challenging market environment that producers and consumers face, we find that inflation-adjusted sales are higher for all categories relative to pre-pandemic levels. Except for PB butter, which is at price parity, all products we surveyed experienced price premium declines from 2019 to 2022.
The interest in and demand for PB products are not limited to the United States. The USDA Foreign Agricultural Service has recently released reports on the development of PB markets in the Philippines, Taiwan, India, United Kingdom, Japan, Germany, and China (Patil and Sandoval, 2021; Singian, 2021; Lee, 2021; Branson, 2021; Arrigan, 2022; Satake and Sasatani, 2023; Rehder, 2023). For example, 18% of Taiwan’s population follows a flexitarian diet, and about 70% of Taiwanese consumers have purchased PB analogs. Local manufacturers are appealing to novelty-seeking Gen Z consumers, instead of traditional vegan consumers, with products such as “braised ribs” or “popcorn chicken” (Lee, 2021). The German FAS report finds that eating vegan is becoming easier, despite the country being known for sausages and abundant meat-based dishes, and over 50% of Germans describe themselves as flexitarians (Rehder, 2023).
The animal- and PB industries will likely continue battling supply chain issues and price volatility. In 2023, food products have continued to experience elevated price inflation, though at lower levels than in 2022. In 2022, PB prices experienced a lagged effect (likely due to high contracting in the industry) following soaring soybean, wheat, and pea prices in 2021. The animal industry also observed increased operating costs, leading to high cattle slaughter rates in the first half of 2022 (Knight et al., 2022). While high culling leads to lower prices in the short term as products flood the market, lower stocks of animals lead to lower supply and higher prices in the long term. In the first 7 months of 2022, egg prices increased by 21%, fats and oils by 13%, and poultry by 12% compared to the first 7 months of 2021 (MacLachlan and Sweitzer, 2022). Poultry and eggs have been particularly affected by recent outbreaks of HPAI.
Meanwhile, the PB industry has a lot of room for growth. Input prices have stabilized somewhat relative to 2022, with organic and conventional soybean and wheat prices declining in 2023. Additionally, continued domestic investment may lead to decreased prices and increased quality. For example, the low domestic supply of oats (both conventional and organic), coupled with immense increased demand for oat milk and droughts in Canada and high transportation costs from Europe could lead to opportunities for improving oat production in the United States. To switch to growing oats, growers can use similar equipment to soybeans, with different spacing for the cutters and almost no modification for drills. In fact, Iowa used to be a large producer of oats, which are barely grown in the Midwest today. Continued consumer interest in PB products could create as an opportunity for the revitalization of many food-grade grains and oilseeds in the United States. Similar shifts in U.S. production and economies of scale may influence the PB premium across a variety of products.
Arrigan, D. 2022. Overview of the Plant-Based Food and Beverage Market in the United Kingdom. Washington, DC: U.S. Department of Agriculture, Foreign Agricultural Service, GAIN Report UK2022-0003,.
Balagtas, J., and J. Cooper. 2021. “The Impact of Coronavirus COVID-19 on U.S. Meat and Livestock Markets.” Washington, DC: U.S. Department of Agriculture, Office of the Chief Economist, OCE Working Paper, March.
Branson, A. 2021. Market Overview of Plant-Based Meat Alternative Products in China. Washington, DC: U.S. Department of Agriculture, Foreign Agricultural Service, GAIN Report CH2021-0008.
Carlson, A., and E. Jaenicke. 2016. “Changes in Retail Organic Price Premiums from 2004 to 2010.” Washington, DC: U.S. Department of Agriculture, Economic Research Service, Economic Research Report ERR-209.
Good Food Institute (GFI). 2022a. 2021 U.S. Retail Market Insights: Plant-Based Foods. Available online: https://gfi.org/wp-content/uploads/2022/03/2021-U.S.-retail-market-insights_Plant-based-foods-GFI.pdf
———. 2022b. “U.S. Plant-Based Food Retail Sales Hit $7.4 Billion, Outpacing Total Retail Sales, despite Supply Chain Interruptions and Pandemic Restrictions Creating Widespread Volatility in the Food Industry.” Available online: https://gfi.org/press/u-s-plant-based-food-retail-sales-hit-7-4-billion/
———. 2023. 2023 State of the Industry Report: Plant-Based Meat, Seafood, Eggs, and Dairy. Available online: https://gfi.org/event/the-state-of-the-industry-plant-based-meat-seafood-eggs-and-dairy/
Ignaszewski, E. 2023. “2022 U.S. Retail Sales Data for the Plant-based Foods Industry.” Good Food Institute (GFI). Available online: https://www.plantbasedfoods.org/2022-u-s-retail-sales-data-for-the-plant-based-foods-industry/
Knight, R., H. Taylor, W. Hahn, A. Terán, M. Haley, G. Grossen, A. Valcu-Lisman, and M. Cornelius. 2022. Livestock, Dairy, and Poultry Outlook. Washington. DC: U.S. Department of Agriculture, Economic Research Service, LDP- M-338, August.
Lee, K. 2021. New Consumers Embrace Plant-Based Trends in Taiwan. Washington, DC: U.S. Department of Agriculture, Foreign Agricultural Service, GAIN Report TW2022-0013.
MacLachlan, M., and M. Sweitzer. 2022. Food Price Outlook. Washington, DC: U.S. Department of Agriculture, Economic Research Service. Available online: https://www.ers.usda.gov/data-products/food-price-outlook/ [Accessed 8/25/2022].
Mead, D., K. Ransom, S.B. Reed, S. Sager. 2020. “The Impact of the COVID-19 Pandemic on Food Price Indexes and Data Collection.” Monthly Labor Review, U.S. Bureau of Labor Statistics.
Mercaris. 2023. Organic and Non-GMO Commodity Price Breakdown Report.
Organic Trade Association. 2022. Organic Industry Survey.
Patil, U., and L. Sandoval. 2021. India Emerges as a Burgeoning Market for Plant-based Meat Substitutes. Washington, DC: U.S. Department of Agriculture, Foreign Agricultural Service, GAIN Report IN2021-0064.
Poore, J., and T. Nemecek. 2018. “Reducing Food’s Environmental Impact through Producers and Consumers.” Science 360(6392):987–992.
Raszap Skorbiansky, S., M. Saavoss, and H. Stewart. 2022. “Cow's Milk Still Leads in the United States: The Case of Cow's, Almond, and Soy Milk.” Agricultural Economics 53(2):204–214.
Rehder, L. 2023. Plant-Based Food Goes Mainstream in Germany. Washington, DC: U.S. Department of Agriculture, Foreign Agricultural Service, GAIN Report GM2023-0002.
Satake, A., and D. Sasatani. 2023. Gradually Evolving Market for Plant-Based Meat Substitutes in Japan. Washington, DC: U.S. Department of Agriculture, Foreign Agricultural Service, GAIN Report JA2023-0061.
Singian, R. 2021. Plant-Based Food Products Market Brief. Washington, DC: U.S. Department of Agriculture, Foreign Agricultural Service, GAIN Report RP2021-0014.
Springmann, M., M. Clark, D. Mason-D’Croz, K. Wiebe, B.L. Bodirsky, L. Lassaletta, W. De Vries, S.J. Vermeulen, M.Herrero, K.M. Carlson, and M. Jonell. 2018. “Options for Keeping the Food System Within Environmental Limits.” Nature. 562(7728):519–525.
Tilman D., M. Clark, D.R. Williams, K. Kimmel, S. Polasky, and C. Packer. 2017. “Future Threats to Biodiversity and Pathways to Their Prevention.” Nature 546(7656):73–81.
United Nations Environment Programme and International Livestock Research Institute. 2020. Preventing the Next Pandemic: Zoonotic Diseases and How to Break the Chain of Transmission. Nairobi, Kenya: United Nations Environment Programme.
U.S. Bureau of Labor Statistics (BLS). 2022. CPI Average Price Data, U.S. City Average. Accessed 7/7/2022.
U.S. Department of Agriculture, Agricultural Marketing Service (AMS). 2022. Retail Prices Report. Washington, DC: USDA, Agricultural Marketing Service, Dairy Programs, Market Information Branch, July 27.
U.S. Department of Agriculture, Economic Research Service (ERS). 2022. Commodity Costs and Returns. Washington, DC: USDA, Economic Research Service. Available online: https://www.ers.usda.gov/data-products/commodity- costs-and-returns/ [Accessed 7/7/2022].
U.S. Department of Agriculture, National Agricultural Statistics Service (NASS). 2023a. Quick Stats. Washington, DC: USDA, National Agricultural Statistics Service.
———. 2023b. 2023 California Objective Measurement Report. Washington, DC: USDA, National Agricultural Statistics Service.World Health Organization (WHO). 2021. Plant-Based Diets and Their Impact on Health, Sustainability and the Environment a Review of the Evidence. WHO European Office for the Prevention and Control of Noncommunicable Diseases. WHO/EURO:2021-4007-43766-61591.

