A prominent issue during the current debate over a new crop safety net is whether the Title I crop program payments should be made on current planted acres or historical base acres? Shifts in the mix of U.S. crops and changes in farm policy are consistent with proposed reference prices (new name for target prices) that potentially distort markets, which lead to the base vs. planted acre issue. Each aspect of this interrelated story is briefly discussed, before exploring trade-offs and questions, including strategic considerations that could impact the future crop safety net.
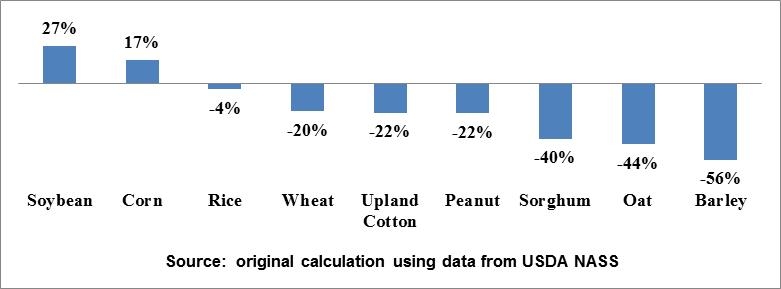
Major shifts in acres among U.S. crops are nothing new, for example there has been long-term decline in oats acreage and an increase in soybean acreage., respectively. The Food, Agriculture, Conservation, and Trade Act of 1990 and especially the Federal Agriculture Improvement and Reform Act of 1996 gave farmers the freedom to choose what to plant except for fruits and vegetables. Thus; they could shift annually to the most profitable crop. This flexibility has facilitated major changes in the mix of U.S. crops driven by changes in demand for biofuels and livestock products as well as by different productivity changes among crops. Figure 1 presents the change in acres planted to selected program crops, using the Olympic average (which excludes high and low) planted acres for 1991-1995 and 2008-2012. The change in planted acres over that time ranged from a 27% increase for soybeans to a 56% decline for barley. Moreover, the share of U.S. principal crop acres planted to corn and soybeans was 53% in 2012, up from 42% in 1991-1995.
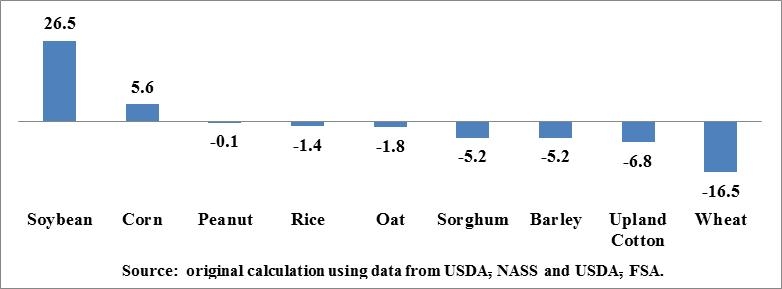
These acreage shifts have resulted in an increasing divergence between specific crops current planted and program base acres. Current base acres are largely tied to planted acres in 1998-2001 or to the base acres in place at the end of the 1996 farm bill which largely reflect planted acres in 1981-1985. The Farm Security Act of 2002 allowed farms to choose base acres between these two periods (Young et al., 2005). Current base acres for barley, sorghum, upland cotton, and wheat all exceed recent planted acres by at least 5 million acres. Wheat’s divergence was nearly 17 million acres (Figure 2). Recent planted acres exceeded base acres for corn and soybeans. (Note, for oats, harvested acres are used instead of planted acres because oats is often planted as a cover crop.)
It is probable that more corn and soybeans are being planted because their profits are higher. Thus, shifts in acres have likely improved farm profits. However, demand for agribusiness political support specific to a crop declines with declining acres. Hence, when assessing the impact of acreage shifts, it is important to distinguish between farms and the agribusiness political support for a crop in a farm bill.
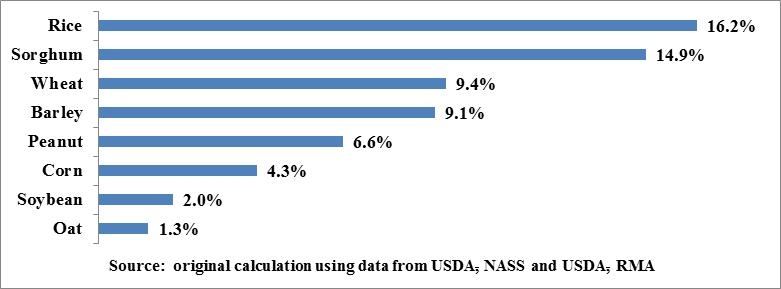
Most policy watchers and analysts expect a new farm bill to eliminate past farm bill direct payments because of the difficulty in defending their fairness when crop income is at or near record highs. However, over the 10-year period of 2003-2012, direct payments as a share of crop sales ranged from 1% for oats to 15% for sorghum and 16% for rice (Figure 3). The differential impact of eliminating direct payments has raised concern, especially for crops with the highest dependence on direct payments.
Interacting with this concern is the emergence of crop insurance as a primary government crop safety net program. Many of the current proposed House and Senate farm bill programs are closer in operation to crop insurance than the traditional commodity countercyclical programs. Thus, it is important to look at crop insurance payments to farms.
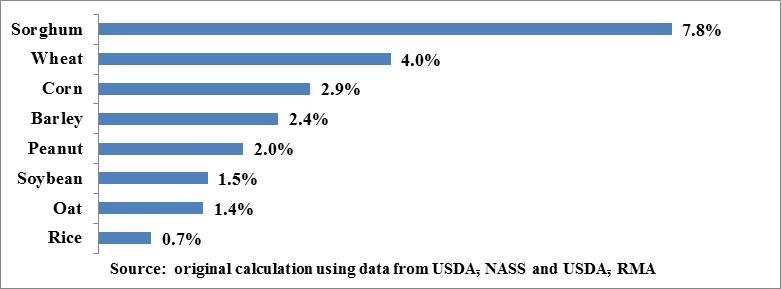
Net insurance payments to farmers varied by crop over 2003-2012: from 0.7% of sales for rice to 7.8% of sales for sorghum (Figure 4). Net insurance payments equal insurance indemnities paid to farms minus premiums paid by farms.
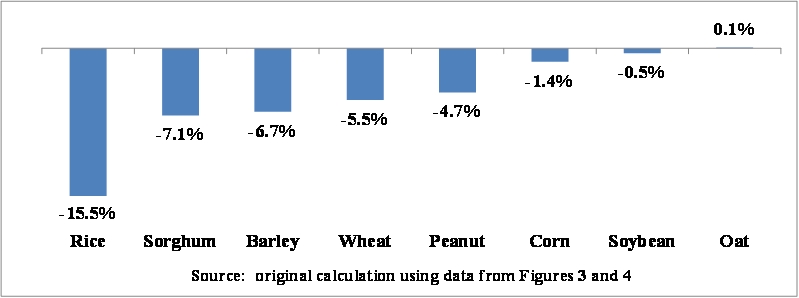
Excluding oats, net insurance payments were a smaller proportionate share of sales than were direct payments (Figure 5). More importantly, the difference varied by crop. For corn, soybeans, and oats the shares differed by less than two percentage points. Thus, the shift to an insurance type of safety net has less relative impact for corn, soybeans, and oats. In contrast, for the other crops, net insurance payments as a share of sales were at least 4.7 percentage points less than for direct payments. For rice, the difference was even larger, 15.5 percentage points. Thus, the shift to an insurance type of safety net more negatively impacts crops other than corn, soybeans, and oats.
The House farm bill provides farms with a choice between a Price Loss Coverage (PLC) program and a Revenue Loss Coverage (RLC) program. PLC is a price support program that makes payments when the market price is less than a set reference price. Payment is made on planted acres subject to a total farm payment limit based on the farm’s base acres. Reference prices are fixed for the length of the farm bill by Congress. RLC is a program that covers revenue shortfalls between 75% and 85% of a revenue target. The revenue target moves with the market based on a five-year Olympic moving average of yield and price. A crop’s reference price is a lower bound on the price used to calculate its RLC revenue target.
The Senate offers farms a combined Adverse Market Payment (AMP) - Agriculture Risk Coverage (ARC) program. The AMP, like PLC, provides price deficiency payments when market price is below a reference price. In general, a commodity reference price is set at 55% of a five-year Olympic moving average of past prices except that fixed reference prices are set for rice and peanuts. The ARC, like RLC, is a revenue target boundary program. It provides payments when revenue falls between 78% and 88% of a revenue target which is determined using a five-year Olympic moving average of past yields and prices. AMP payments are made on historical base acres while ARC payments are made on planted acres subject to a farm-level cap based on a farm’s 2008-2012 planting history.
While a simplistic description, ARC can be viewed as providing shallow loss coverage that sets atop the deep loss coverage provided by AMP. The Senate is able to provide a combined AMP-ARC program because the 55% Olympic average used for AMP’s reference prices are below the House’s fixed reference prices (Zulauf, 2013). Thus, the budget score is lower for the Senate reference prices than for the House reference prices (Monke, 2013), which allows the Senate to offer a combined price-revenue program.
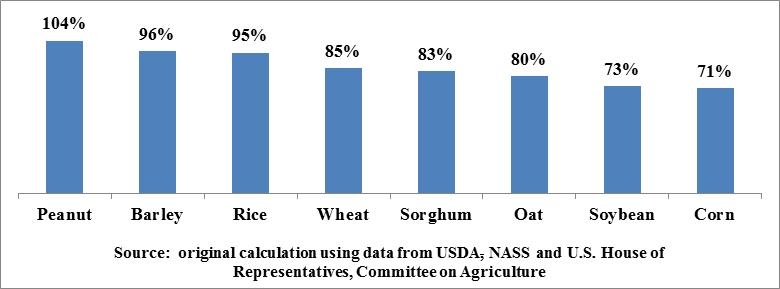
Importantly, the House’s reference prices are set at levels that differ relative to recent market prices. For example, the reference price for peanuts exceeds the 2008-2012 Olympic average price by 4% (Figure 6). In contrast, the reference price is nearly 30% under the 2008-2012 Olympic average price for corn and soybeans.
Budget and price expectations play roles in setting reference prices. However, the relationship between the House reference prices and market prices of the last five years is also consistent with providing more support to crops that have experienced long-term declines in acres or have not directly benefited from U.S. biofuels policy. The relationship is also consistent with setting the reference price high relative to the market price for those crops that lose the most from eliminating direct payments while shifting to an insurance type safety net (compare Figures 5 and 6).
Cotton does not appear in Figures 3-6 because neither the House nor the Senate specifies a reference price for cotton. Instead, they authorize the Stacked Income Protection (STAX) program for cotton. STAX is a county shallow loss program farms can elect to add on top of their individual cotton crop insurance coverage. STAX is at least partly a response to the ruling against the U.S. cotton program by the World Trade Organization (WTO) in a suit brought by Brazil. Part of the rationale for the suit and ruling against U.S. cotton was a farm bill set target price that was high relative to the world market price for cotton. Thus, U.S. farm programs may again face a WTO suit if market prices end up below reference prices. It should be noted that it is not clear if Brazil will accept the changes proposed to the U.S. cotton program under STAX.
The House farm bill makes payments on current planted acres while the Senate farm bill continues the traditional use of historical base acres. Primary rationale for using planted acres is that a farm’s risk is tied to its planting decisions. Thus, making payments on planted acres enhances a program’s risk management effectiveness. However, the differential relationship between the House reference prices and recent market prices suggests program payments are more likely to be made for peanuts, rice, and barley than for corn and soybeans. Moreover, making payments on planted acres means any acre and, in particular, new acres planted to a crop are eligible for payments. Market prices below reference prices lead to deficiency payments, which increase return per planted acre relative to the market, which sustains and likely increases production, which keeps price low, which sustains and may even increase deficiency payments. This concern over planting distortions and their impact on the cost of crop programs has been enhanced by the recent decline in crop prices.
One way to mitigate the potential for production distortion from reference prices is to make payments on historical base acres, not current planted acres. Deficiency payments thus would not be made on current production, which reduces the incentive to plant more of a crop receiving deficiency payments. Moreover, historical base acres are fixed, thus putting a cap on the number of acres that can receive payment.
A compromise between using base acres and planted acres is to allow base acres to be updated to a more recent period, such as 2008-2012. Updating base acres allows base acres to better match a farm’s current risk as reflected by planted acres, but still places a cap on the number of acres that can receive a payment. However, updating base acres locks in place the long-term decline in acres for most program crops. This implication creates concern among agribusinesses specific to crops with declining acres. An associated issue is whether updating base should be mandatory or at the choice of the farm. Mandatory updating is likely to be cheaper since farms are likely to choose to update only if it is more favorable to do so. In summary, this interlocking set of program design questions and associated impacts encompass what is referred to as the base vs. planted acre issue.
The assessment of whether payment should be based on planted or base acres depends on how you assess the story and the story as a whole. Are higher reference support prices for other crops warranted to offset the impact of biofuels policy on corn and soybean acres? Does the differential impact of eliminating direct payments warrant differential setting of reference prices? The concern is that differential reference prices potentially cause economic inefficiencies, including production distortions and higher government costs.
While distortions can happen when market price is above the reference price due to a reduction in risk, the distortion is larger when price is below the reference price. Thus, the level of economic inefficiency and government cost obviously depend on whether market price is below or above the reference price. However, available evidence is that forecasting price is difficult. For example, cost of the 2008 farm bill was substantively overestimated because prices ended up being far above the expected prices used to estimate program costs at the time of the legislation.
The difficulty in estimating prices raises the issue of the need for post-enactment mechanisms to control costs. Base acres are one such policy mechanism. Paying on base acres puts a cap on the number of acres that can receive a payment. Thus, the debate over base vs. planted acres is part of a larger debate over how to control costs and distortions when price and revenue forecasts turn out to be a wrong. History suggests such an outcome is likely. I, therefore, expect future farm bills will continue to revisit both the narrow issue of base vs. planted acres and the larger issue of controlling costs and distortions if forecasts turn out to be wrong.
Monke, J. (2013, October 21). Budget issues shaping a farm bill in 2013. Congressional Research Service Report. Available online: http://www.fas.org/sgp/crs/misc/R42484.pdf.
U.S. Department of Agriculture, Farm Service Agency. (2013). Additional farm bill information available online: http://www.fsa.usda.gov.
U.S. Department of Agriculture, National Agricultural Statistics Service. (2013) Quick Stats. Additional statistics available online: http://www.nass.usda.gov/Data_and_Statistics/Quick_Stats_1.0/index.asp
U.S. Department of Agriculture, Risk Management Agency. (2013) Additional crop insurance available online: http://www.rma.usda.gov/
U.S. House of Representatives, Committee on Agriculture. (2013) Federal Agriculture Reform and Risk Management Act of 2013. H.R. 2642. Available online: https://www.govtrack.us/congress/bills/113/hr2642/text.
U.S. Senate, Committee on Agriculture, Nutrition, and Forestry. (2013) Agriculture Reform, Food and Jobs Act of 2013. S. 954. Available online: http://www.ag.senate.gov/issues/farm-bill.
Young, C. E., Skully, D. W., Westcott, P. C.and Hoffman, L. (2005, September). Economic Analysis of Base Acre and Payment Yield Designations Under the 2002 U.S. Farm Act. Economic Research Report ERR-12. Available online: http://webarchives.cdlib.org/sw15d8pg7m/http://ers.usda.gov/Publications/err12/
Zulauf, C. (2013, June 7). Market Distortion and Farm Program Design: A Case Examination of the Proposed Farm Price Support Programs. farmdocdaily. University of Illinois at Urbana-Champaign, Department of Agricultural and Consumer Economics. Available online: http://farmdocdaily.illinois.edu/2013/06/market-distortion-farm-program-design.html

