The development of ethanol as a market for commodity crops has provided a critical source of revenue for U.S. farms. The extent to which ethanol production occurs currently, and will in the future, depends on ethanol’s carbon intensity (CI). A fuel’s CI represents the lifecycle greenhouse gas (GHG) emissions of the fuel—including those resulting from its production, distribution, and consumption—per unit of energy. We represent ethanol’s CI in grams of carbon dioxide equivalent per megajoule (gCO2e/MJ).
The CI of ethanol has important implications in clean transportation fuel policy. In this article, we examine ethanol’s CI in California’s Low Carbon Fuel Standard (LCFS). California’s ethanol CI is important since California is a significant consumer of transportation fuels, consuming 1.5 billion gallons of ethanol in 2022, 11% of U.S. consumption in that year (CARB 2023a, EIA 2023a).
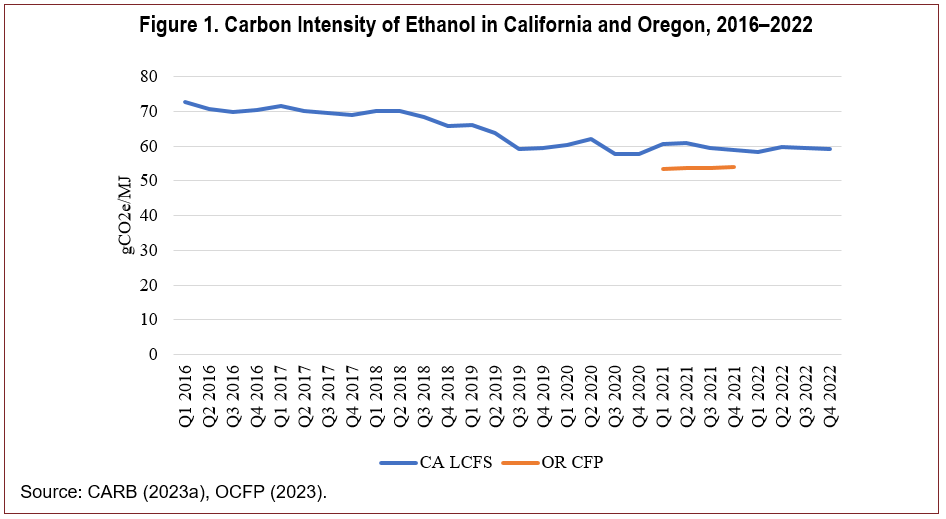
The CI of California ethanol declined 19% between Q1 2016 (72.9 gCO2e/MJ) to Q4 2022 (59.2 gCO2e/MJ) (CARB, 2023a; see Figure 1). Ethanol’s CI trend in California is consistent with a longer-term CI decline in U.S. corn ethanol. From 2005 through 2019, the CI of U.S. corn ethanol fell because of greater corn yields for a given level of fertilizer, increases in the amount of ethanol produced per bushel of corn, and reductions in energy needed to produce a gallon of ethanol (Lee et al., 2021).
We obtain unique insights from examining the CI of ethanol in California. First, the LCFS has a standard methodology for estimating ethanol’s CI, allowing ethanol’s CI to be tracked consistently over time and providing a more current estimate of ethanol’s CI score than available through retrospective studies or other clean transportation fuel programs. There are less data available on the CI of ethanol in Oregon (OCFP, 2023; see Figure 1), the only other state with a similar program through 2022, and ethanol’s CI is not analogously tracked in the Renewable Fuel Standard. Also, mostacademic research focuses on estimating ethanol’s CI at a single point in time.
Second, whereas previous research examining trends over time has focused on corn ethanol, California’s ethanol CI score is reflective of all feedstocks. The LCFS data allow us to assess how changes in the feedstock composition of ethanol influences CI scores.
Third, California’s Air Resources Board (CARB), which administers the LCFS, maintains a database of ethanol facilities with approved pathways (CARB, 2023a). We use this detail to examine factors that influence CI scores. To do so, we compare the geographic locations of U.S. ethanol facilities with approved pathways to facilities without pathways. We also use details from this database to examine which facilities with approved pathways are sourcing renewable energy to reduce their CI.
In this article, we describe the policy relevance of ethanol’s CI and summarize how CARB determines it for the LCFS. We then address four factors that influence ethanol’s CI in California:
We also review how carbon capture and storage would lead to further reductions in ethanol’s CI. We conclude by discussing how ethanol’s CI may influence its future use.
To date, the main use of ethanol has been in light-duty vehicles. In the future, ethanol may also be used as a fuel in sectors that are hard to electrify, like commercial aviation. Alcohol-to-jet (ATJ) is a sustainable aviation fuel (SAF) production pathway that can use ethanol as a feedstock. ATJ from ethanol may be commercially produced in the United States as early as 2023 (GAO, 2023).
Incentives for blending ethanol with gasoline exist at both the federal and the state level. At the federal level, the Renewable Fuel Standard (RFS) establishes volumetric mandates for biofuels across a series of categories. At the state level, clean transportation fuel programs establish an annual requirement for the CI of gasoline and diesel sold within their states. As of 2023, such programs exist in California, Oregon, and Washington. The RFS establishes threshold CI reduction targets that biofuels must attain. Corn ethanol must have a CI that is 20% lower than the petroleum baseline. Biomass-based diesel and advanced biofuels must attain 50% reductions, while cellulosic biofuels must reach a 60% reduction. Since the RFS establishes volumetric mandates, it does not incentivize reductions in the CI of biofuels beyond the established thresholds.
In contrast to the RFS, state clean fuel programs do not prescribe the mix of fuels. Instead, they are premised on reducing the CI of transportation fuels over time. For instance, the LCFS stipulates a 20% reduction in the CI of California’s transportation fuels by 2030 relative to 2010. These programs provide financial incentives for reducing the CI of biofuels since lower CI scores translate into a greater number of credits. Under the LCFS, CARB issues credits to suppliers of low CI fuels (such as ethanol) that they can sell to refiners andimporters of fuels with high CI scores (such as petroleum-based gasoline and diesel).
Policy incentives also exist to reduce the CI of SAF. In 2022, the Inflation Reduction Act authorized the Sustainable Aviation Fuel Credit (“40B”) for 2023 and 2024. The 40B credit is the first federal-level tax credit that requires CI estimates. The tax credit is $1.25/gallon for SAF that achieves at least a 50% CI reduction relative to petroleum jet fuel and an additional $0.01 per gallon for each percentage point reduction up to $1.75/gallon.
In 2025, the 40B tax credit will be superseded by the Clean Fuel Production Credit (“45Z”). The 45Z tax credit applies to clean transportation fuels—including ethanol, biodiesel, renewable diesel, and SAF—for 2025–2027. The 45Z base rate is $0.20/gallon for non-SAF biofuels and $0.35/gallon for SAF that attains a threshold CI level. This base rate increases by a factor of 5 if wage requirements are met. The tax credit is equal to the base rate multiplied by the percentage reduction in CI relative to the threshold CI level.
LCFS applicants establish the CI of transportation fuels with GHG lifecycle assessments (LCAs). Each fuel producer submits an LCA for their specific pathway for certification. CARB has calculators for established pathways, like ethanol, that applicants populate with project-level details. Ethanol’s reference category is gasoline. The credits that participants receive areproportional to their customized CI score. The CIs generated by LCAs are influenced by the system boundary definitions, the data used, and the allocation of GHG emissions among coproducts. An “attributional” LCA estimates the emissions that are a direct result of producing the product, whereas a “consequential” LCA estimates emissions due to changes in demand for the product (NASEM, 2022). Conceptually, these two types of LCAs estimate the average and marginal effects, respectively. CARB’s CI methodology for crop-based biofuels entails merging attributional and consequential components. While this hybrid approach is common in regulatory contexts, summing attributional and consequential parameters implies that the resulting CI is challenging to interpret (NASEM, 2022).
CARB determines the direct GHG emission of biofuels using a version of an attributional model—the Greenhouse Gases, Regulated Emissions, and Energy Use in Technologies Model (GREET)—that has been customized for California. Direct GHG emissions of corn ethanol come from agriculture, biorefining, and transportation. CARB does not attribute vehicle CO2 combustion emissions to ethanol since those emissions were sequestered by crops from the atmosphere. CARB then appends a land-use change estimate for biofuels, which is derived from a consequential model. Specifically, CARB uses the Global Trade Analysis Project model to estimate land-use conversions and Agro-Ecological Zone Emission Factors to estimate the resulting GHG emissions. CARB assigned corn ethanol pathways 30 gCO2e/MJ for land-use change GHGemissions through 2015. Beginning in 2016, CARB reduced the corn ethanol land-use change emissionfactor to 19.8 gCO2e/MJ based on updated modeling(Rosenfeld et al., 2020).
Understanding where California’s ethanol is produced is relevant because CI scores are influenced by the distance the ethanol travels to reach California. Ethanol is not transported in oil pipelines. Instead, domestically produced ethanol is typically shipped to California by rail for longer distances and truck for shorter distances. California also imports ethanol produced with sugarcane and molasses from Brazil and Guatemala, and this ethanol is shipped to California via barges.
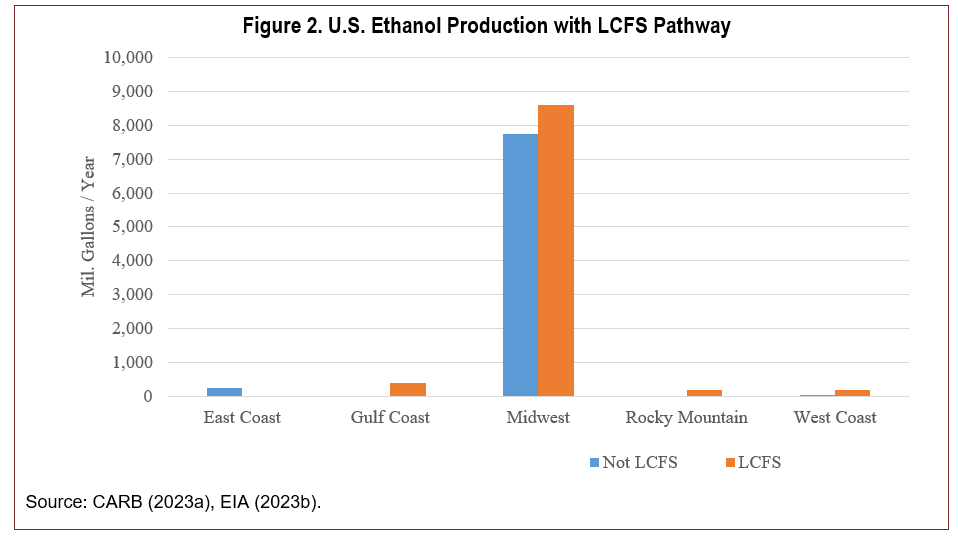
Holding other factors constant, pathways from West Coast facilities have the lowest CIs since they have the shortest distance to travel to California, followed by pathways from Texas and the Rocky Mountain regions: 11 of the 12 U.S. ethanol facilities in the West Coast, Texas, and Rocky Mountain regions have an LCFS-approved pathway. None of the three East Coast ethanol facilities have LCFS-approved pathways, presumably due to the lengthy distance the ethanol would need to travel to California. Of the 192 U.S. ethanol facilities and 17.3 billion gallons in production capacity, 92% and 94%, respectively, are in the Midwest (EIA, 2023b). This concentration can be attributed to the Midwest’s proximity to grain production. Of ethanol produced in the Midwest (both in terms of the number of facilities and production capacity), 53% has an LCFS-approved pathway (Figure 2). So, California’s size and transportation fuels policy imply that it is an important destination for Midwest ethanol.
Feedstock GHG emissions arise from the production of fertilizer and soil amendments, nitrous oxide emissions from fertilizer application, and on-farm energy use in tractors. Ethanol produced from corn and sorghum feedstocks have relatively high CIs, while cellulosic feedstocks have relatively low CIs. In 2022, 83% of California’s ethanol was produced with corn, with 12% produced with cellulosic fibers and biomass. The remaining ethanol was produced from sugarcane and molasses (4%), wheat (2%), sorghum, and other feedstocks like waste seeds or beverages.
Ethanol’s CI fell by 19% in California from 2016 through 2022. One reason this occurred is that there was a decline in the proportion of ethanol from corn, from 90% to 83%, along with a decline in ethanol from sorghum. At the same time, ethanol from cellulosic fiber and biomass increased.
CA-GREET’s methodology for estimating feedstock emissions is premised on parameters that represent industry averages. This implies that a biorefinery that sources corn produced with relatively high yields and low fertilizer use receives the same feedstock CI as a biorefinery that sources corn produced under the opposite conditions. This methodology does not reflect the issue that the CI of corn feedstock production can vary considerably, even among Midwest states (Kwon and Liu, 2022). Another implication of CARB’s approach is that biorefineries do not have an incentive to source crops grown with “climate-smart” farming practices—including continuous conservation tillage, cover crops, and applying enhanced efficiency fertilizers—as doing so would not reduce their CI (Liu, Kwon, and Wang, 2021).
An impediment to developing feedstock-specific CI scores is that this could potentially entail high transaction and administration costs. To do this effectively, protocols in biofuel programs would need to be structured in a more standardized and scalable fashion than has been followed by voluntary offset standards. To date, high transaction costs associated with contract length, quantification, and verification requirements have impeded the development of agricultural offset protocols.
Two prominent coproducts in ethanol production—distiller grains and corn syrup—are used in animal feed. Distiller grains and corn syrup have high protein and energy levels, respectively. They both reduce the CI of corn ethanol since they displace GHG emissions that would have otherwise occurred from producing conventional livestock feeds (such as corn and soybean meal). Drying reduces the weight of distiller grains for shipment but also requires energy. So, the CI of ethanol is about 8–10 gCO2e/MJ higher when distiller grains are dried instead of wet (Rosenfeld et al., 2020). Distiller grain yields per gallon of ethanol have declined over time as ethanol production has become more efficient (Lee et al., 2021).
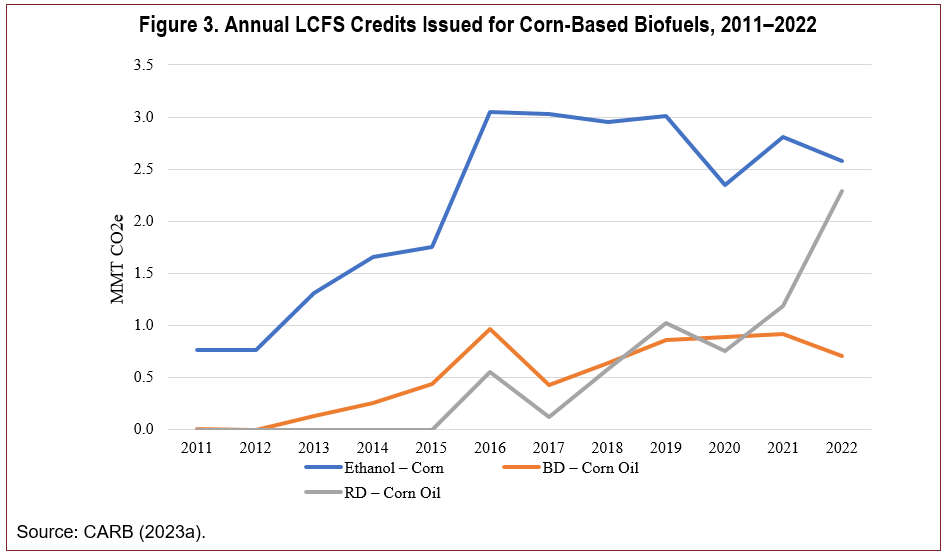
Corn oil is another common ethanol by-product that is used to produce biodiesel and renewable diesel. Corn oil extraction requires additional energy. Whether corn oilextraction reduces ethanol’s CI depends on the type of facility, as biodiesel and renewable diesel also receive credits in the LCFS. High LCFS prices have led to a significant increase in renewable diesel consumption in recent years. While CARB did not issue any credits for corn oil renewable diesel production through 2015, CARB issued 2.3 million metric tons of carbon dioxide equivalent (MMT CO2e) of credits for corn oil renewable diesel in 2022 (Figure 3). When combined with the 0.7 MMT CO2e in corn oil biodiesel credits, this implies that CARB issued more LCFS credits for corn oil (3 MMT CO2e) in 2022 than it issued for corn ethanol (2.6 MMT CO2e).
CO2 is also a byproduct in ethanol production. In 2021, about 25% of U.S. ethanol facilities captured and sold CO2 (GAO, 2022). These sales are predominately made to the food and beverage industry, which uses it for carbonated drinks and refrigeration. However, capturing CO2 and selling it commercially does not reduce the CI of ethanol, since this CO2 typically is released into the atmosphere after use.
A typical ethanol facility purchases electricity from the grid and natural gas for industrial heating. Installing a combined heat-and-power (CHP) facility is a more energy efficient alternative. Ten U.S. ethanol facilities with approved LCFS pathways in CARB’s database are specified as using a CHP system. CHP systems that use biomass or natural gas as a fuel will reduce ethanol’s CI score by 3–4 gCO2e/MJ or 1–2 gCO2e/MJ, respectively (Rosenfeld et al., 2020), only a modest impact. More significant CI reductions occur from replacing natural gas with renewable fuels, such as renewable natural gas (RNG) generated from dairy or swine manure. Replacing 50% of natural gas with RNG from livestock manure would lead to a 10 gCO2e/MJ reduction (Xu, Lee, and Wang, 2022). Solar and wind are other sources of renewable energy that can reduce ethanol’s CI.
The pathway descriptions in the CARB database indicate that eight U.S. ethanol facilities are sourcing renewable energy from solar or biogas/biomethane, three of which are in California. California is the largest milk-producing state in the U.S. and has experienced a proliferation in anaerobic digesters on dairy farms in recent years (O’Hara, Xiarchos, and Weber, 2023). In addition to having low transportation emissions, California ethanol facilities also have an advantage in that it is relatively easier for them procure biogas from livestock waste than it is for other ethanol facilities.
The Development of CCSCarbon capture and storage (CCS) entails capturing and storing CO2 geologically. CCS can reduce ethanol’s CI by about 31 gCO2e/MJ (Xu, Lee, and Wang, 2022). If CCS is combined with other technologies, it could reduce the CI of ethanol to less than 0. In addition to the incentives of LCFS credits, a federal tax credit (“45Q”) provides a per ton credit for capturing and storing CO2. As of 2023, ADM’s ethanol facility in Decatur, Illinois, captures CO2 and injects it underground. CCS may become more widespread among U.S. ethanol facilities in the future; other pipelines being proposed across the Midwest will capture CO2 at other ethanol facilities and transport it for geologic sequestration. However, building CO2 pipelines in the Midwest is challenging due to the need to obtain right-of-way access across large geographic areas.
Ethanol’s future as a transportation fuel may have profound implications for U.S. farm income. However, the future use of ethanol in U.S. light-duty vehicles is uncertain. On the one hand, greater use of electric vehicles will reduce the demand for ethanol. On the other hand, there may be a potentially slow turnover in the vehicle fleet and an expansion of fueling stations and regulations that permit sales of ethanol blended with gasoline at higher levels than 10%.
Similarly, the extent to which ethanol is used for SAF production in the future is unclear. Currently, U.S. SAF is commercially produced with fats, oils, and greases like soybean oil, used cooking oil, and tallow. In the future, SAF could be produced using agricultural or forestry residues. SAF may also be produced in the future from nonethanol ATJ pathways, such as those using sugar or corn isobutanol. Collectively, this implies that ethanol will be competing with other feedstocks to produce SAF.
Due to federal tax credits and clean transportation fuel programs, ethanol’s CI may be strategically important in determining its competitiveness. The LCFS provides the most up-to-date time series of ethanol’s CI in a U.S. regulated transportation fuel program. We use these data to assess factors that are influencing the decline in ethanol’s CI over time. As discussed, additional reductions in ethanol’s CI could occur if clean transportation fuel programs provide credits for climate-smart farming practices and as renewable energy and CCS use in ethanol facilities become more widespread.
California Air Resources Board (CARB). 2023a. Low Carbon Fuel Standard Reporting Tool Quarterly Summaries. Available online: https://ww2.arb.ca.gov/resources/documents/low-carbon-fuel-standard-reporting-tool-quarterly- summaries [Accessed July 7, 2023].
———. 2023b. LCFS Pathway Certified Carbon Intensities. Available online: https://ww2.arb.ca.gov/resources/documents/lcfs-pathway-certified-carbon-intensities [Accessed May 24, 2023].
Energy Information Administration (EIA). 2023a. Monthly Energy Review. Available online: https://www.eia.gov/totalenergy/data/monthly/ [Accessed August 3, 2023].
———. 2023b. Petroleum & Other Liquids: U.S. Fuel Ethanol Plant Production Capacity. Available online: https://www.eia.gov/petroleum/ethanolcapacity/ [Accessed July 11, 2023].
Government Accountability Office (GAO). 2022. Decarbonization: Status, Challenges, and Policy Options for Carbon Capture, Utilization, and Storage. Washington, DC: GAO.
———. 2023. Sustainable Aviation Fuel: Agencies Should Track Progress towards Ambitious Federal Goals. Washington, DC: GAO.
Kwon, H.., and X. Liu. 2022. FD-CIC and CCLUB for Biofuel Feedstocks. Lemont, IL: Argonne National Laboratory.
Lee, U., H. Kwon, M. Wu, and M. Wang. 2021. “Retrospective Analysis of the U.S. Corn Ethanol Industry for 2005-2019: Implications for Greenhouse Gas Emission Reductions.” Biofuels, Bioproducts & Biorefining 15:1318–1331.
Liu, X., H. Kwon, and M. Wang. 2021. “Varied Farm-Level Carbon Intensities of Corn Feedstock Help Reduce Corn Ethanol Greenhouse Gas Emissions.” Environmental Research Letters 16:064055.
National Academies of Sciences, Engineering, and Medicine (NASEM). 2022. Current Methods for Life Cycle Analysis of Low-Carbon Transportation Fuels in the United States. Washington, DC: National Academies Press.
O’Hara, J.K., I.M. Xiarchos, and C. Weber. 2023. “Credits in California’s Offset and Biofuel Programs for Anaerobic Digesters.” Choices 38(3).
Oregon Clean Fuels Program (OCFP). 2023. Quarterly Data Summaries. Available online: https://www.oregon.gov/deq/ghgp/cfp/Pages/Quarterly-Data-Summaries.aspx [Accessed May 24, 2023].
Rosenfeld, J., M. Kaffel, J. Lewandrowski, and D. Pape. 2020. The California Low Carbon Fuel Standard: Incentivizing Greenhouse Gas Mitigation in the Ethanol Industry. Washington, DC: USDA Office of the Chief Economist.
Xu, H., U. Lee, and M. Wang. 2022. “Life-Cycle Greenhouse Gas Emissions Reduction Potential for Corn Ethanol Refining in the USA.” Biofuels, Bioproducts & Biorefining 16:671–681.

