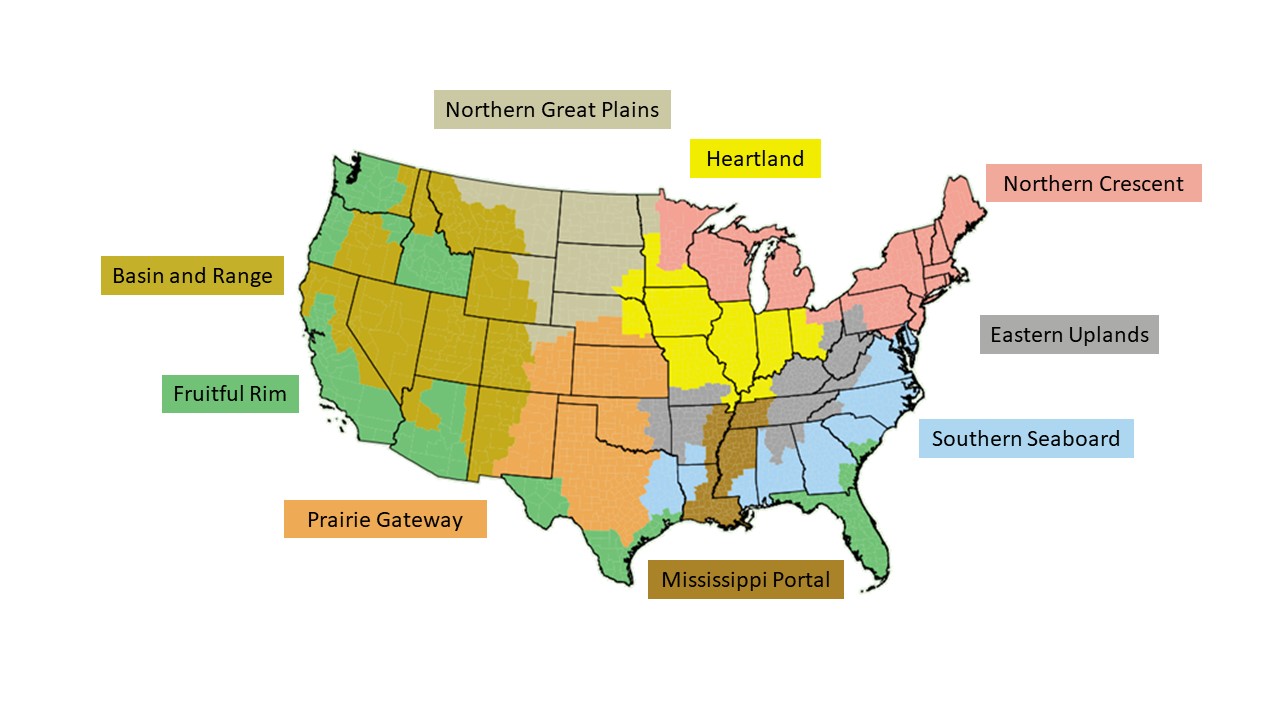
Source: USDA (2000).
| Cover Crop Adoption Ratea (%) |
Disadoption of Cover Crops 2012–2017 |
State Totals 2012–2017 |
||||||
| State | 2012 | 2017 | No. of Counties |
Percentageb of Counties |
Change in Acres |
Net Change in Acres |
Disadoption Ratio (%) |
Efficiency Rankingc |
| Alabama | 7.22 | 8.13 | 30 | 44.78 | -43,292 | 27,739 | 60.95 | 36 |
| Arizona | 1.54 | 3.07 | 5 | 33.33 | -1,151 | 11,224 | 9.30 | 17 |
| Arkansas | 1.73 | 3.20 | 26 | 34.67 | -9,095 | 102,605 | 8.14 | 15 |
| California | 3.55 | 3.65 | 19 | 33.93 | -32,324 | 8,935 | 78.34 | 41 |
| Colorado | 1.19 | 1.17 | 18 | 29.03 | -25,925 | 1,684 | 93.90 | 44 |
| Connecticut | 13.53 | 14.80 | 3 | 37.50 | -747 | 1,545 | 32.59 | 31 |
| Delaware | 15.97 | 19.49 | 0 | 0.00 | 0 | 17,996 | 0.00 | 1 |
| Florida | 5.02 | 5.02 | 24 | 35.82 | -23,201 | 3,616 | 86.52 | 43 |
| Georgia | 8.83 | 12.14 | 40 | 25.16 | -26,739 | 155,294 | 14.69 | 20 |
| Idaho | 1.79 | 2.19 | 17 | 38.64 | -19,543 | 24,653 | 44.22 | 34 |
| Illinois | 1.34 | 2.95 | 9 | 8.82 | -5,207 | 388,338 | 1.32 | 3 |
| Indiana | 4.73 | 7.25 | 20 | 21.74 | -37,501 | 338,006 | 9.99 | 18 |
| Iowa | 1.45 | 3.67 | 5 | 5.05 | -8,353 | 593,498 | 1.39 | 4 |
| Kansas | 1.13 | 1.91 | 27 | 25.71 | -43,659 | 242,542 | 15.25 | 23 |
| Kentucky | 5.58 | 6.29 | 48 | 40.00 | -37,884 | 62,585 | 37.71 | 32 |
| Louisiana | 1.38 | 1.67 | 20 | 31.25 | -17,393 | 6,490 | 72.83 | 39 |
| Maine | 6.15 | 11.74 | 6 | 37.50 | -1,180 | 26,083 | 4.33 | 8 |
| Maryland | 23.47 | 28.80 | 6 | 26.09 | -14,526 | 83,160 | 14.87 | 21 |
| Massachusetts | 10.63 | 10.14 | 4 | 28.57 | -2,048 | 327 | 86.23 | 42 |
| Michigan | 5.70 | 8.50 | 22 | 26.51 | -13,795 | 236,219 | 5.52 | 12 |
| Minnesota | 1.89 | 2.66 | 23 | 26.44 | -44,113 | 160,544 | 21.57 | 28 |
| Mississippi | 1.30 | 2.81 | 24 | 29.27 | -13,613 | 65,027 | 17.31 | 25 |
| Missouri | 2.56 | 5.40 | 21 | 18.42 | -14,113 | 450,127 | 3.04 | 7 |
| Montana | 0.75 | 0.92 | 21 | 37.50 | -37,626 | 18,800 | 66.68 | 38 |
| Nebraska | 1.65 | 3.36 | 16 | 17.20 | -19,025 | 389,008 | 4.66 | 9 |
| Nevada | 1.39 | 1.76 | 5 | 29.41 | -3,402 | 2,280 | 59.87 | 35 |
| New Hampshire | 5.11 | 7.71 | 1 | 10.00 | -183 | 3,301 | 5.25 | 11 |
| New Jersey | 11.14 | 13.74 | 3 | 15.79 | -806 | 12,786 | 5.93 | 13 |
| New Mexico | 3.65 | 2.94 | 11 | 33.33 | -22,416 | -16,682 | 390.93 | 38 |
| New York | 5.11 | 6.88 | 14 | 24.14 | -14,270 | 80,157 | 15.11 | 22 |
| North Carolina | 8.28 | 9.66 | 40 | 40.00 | -22,068 | 87,025 | 20.23 | 27 |
| North Dakota | 0.79 | 1.45 | 10 | 18.87 | -16,035 | 190,457 | 7.77 | 14 |
| Ohio | 3.32 | 6.55 | 11 | 12.50 | -5,406 | 359,374 | 1.48 | 5 |
| Oklahoma | 2.02 | 2.92 | 33 | 42.86 | -26,049 | 111,303 | 18.97 | 26 |
| Oregon | 1.98 | 2.55 | 10 | 27.78 | -6,077 | 17,817 | 25.43 | 30 |
| Pennsylvania | 9.82 | 12.80 | 10 | 14.93 | -3,247 | 149,284 | 2.13 | 6 |
| Rhode Island | 11.23 | 13.07 | 2 | 40.00 | -450 | -263 | 240.64 | 47 |
| South Carolina | 4.00 | 5.92 | 10 | 21.74 | -12,339 | 43,658 | 22.04 | 29 |
| South Dakota | 0.78 | 1.42 | 14 | 21.21 | -11,470 | 125,806 | 8.36 | 16 |
| Tennessee | 3.45 | 6.44 | 20 | 21.05 | -7,731 | 156,732 | 4.70 | 10 |
| Texas | 3.13 | 3.45 | 107 | 42.46 | -179,851 | 108,208 | 62.44 | 37 |
| Utah | 1.84 | 1.95 | 9 | 31.03 | -4,225 | 1,248 | 77.20 | 40 |
| Vermont | 4.12 | 8.45 | 1 | 7.14 | -39 | 20,435 | 0.19 | 2 |
| Virginia | 10.10 | 13.29 | 24 | 24.49 | -13,181 | 104,041 | 11.24 | 19 |
| Washington | 2.37 | 2.35 | 19 | 48.72 | -36,479 | -1,796 | 105.18 | 45 |
| West Virginia | 2.08 | 2.37 | 18 | 33.96 | -1,037 | 5,599 | 15.63 | 24 |
| Wisconsin | 5.58 | 6.06 | 28 | 40.00 | -38,407 | 62,960 | 37.89 | 33 |
| Wyoming | 1.91 | 1.57 | 9 | 39.13 | -13,233 | -5,382 | 168.55 | 46 |
| US Total | 2.64 | 3.88 | 863 | 28.26 | 930,506 | 5,034,393 | 15.60 | |
a Adoption rate calculated as cover crop area divided by total cropland area. Total cropland includes cropland harvested, crop failure, cultivated summer fallow, cropland used only for pasture, and idle cropland.
b Percent of counties calculated with respect to all counties in the state (including counties with missing data).
cEfficiency ranking with respect to disadoption ratio.
Source: Authors’ calculations based on Census of Agriculture (USDA 2014, 2019).
| No-Till Adoption Ratea (%) |
Disadoption of No-Till 2012–2017 |
State Totals 2012–2017 |
||||||
| State | 2012 | 2017 | No. of Counties |
Percentageb of Counties |
Change in Acres |
Net Change in Acres |
Disadoption Ratio (%) |
Efficiency Rankingc |
| Alabama | 27.53 | 27.15 | 31 | 46.27 | -20,940 | 55,263 | 27.48 | 23 |
| Arizona | 2.50 | 4.52 | 3 | 20.00 | -210 | 27,884 | 0.75 | 5 |
| Arkansas | 12.37 | 12.63 | 28 | 37.33 | -128,147 | 5,394 | 95.96 | 41 |
| California | 2.14 | 2.48 | 20 | 35.71 | -40,869 | 32,809 | 55.47 | 31 |
| Colorado | 25.92 | 26.22 | 16 | 25.81 | -255,445 | 146,790 | 63.51 | 33 |
| Connecticut | 7.82 | 12.22 | 0 | 0.00 | 0 | 6,335 | 0.00 | 1 |
| Delaware | 49.90 | 53.65 | 1 | 33.33 | -3,252 | 23,461 | 12.17 | 16 |
| Florida | 7.05 | 8.67 | 19 | 28.36 | -28,274 | 4,230 | 86.99 | 38 |
| Georgia | 16.69 | 17.11 | 56 | 35.22 | -132,000 | 45,981 | 74.17 | 35 |
| Idaho | 8.07 | 8.72 | 16 | 36.36 | -62,669 | 46,588 | 57.36 | 32 |
| Illinois | 25.47 | 26.96 | 41 | 40.20 | -215,564 | 419,615 | 33.94 | 27 |
| Indiana | 39.33 | 37.98 | 52 | 56.52 | -293,808 | -49,217 | 120.12 | 44 |
| Iowa | 26.47 | 30.88 | 14 | 14.14 | -75,496 | 1,245,363 | 5.72 | 10 |
| Kansas | 36.50 | 38.45 | 39 | 37.14 | -520,394 | 794,145 | 39.59 | 29 |
| Kentucky | 36.42 | 36.17 | 50 | 41.67 | -85,770 | 88,938 | 49.09 | 30 |
| Louisiana | 11.22 | 9.59 | 23 | 35.94 | -106,121 | -54,672 | 206.26 | 47 |
| Maine | 2.08 | 4.59 | 0 | 0.00 | 0 | 11,595 | 0.00 | 1 |
| Maryland | 55.00 | 57.97 | 5 | 21.74 | -29,904 | 59,186 | 33.57 | 26 |
| Massachusetts | 3.35 | 5.34 | 0 | 0.00 | 0 | 3,761 | 0.00 | 1 |
| Michigan | 19.80 | 19.77 | 31 | 37.35 | -103,130 | 49,571 | 67.54 | 34 |
| Minnesota | 3.79 | 5.01 | 24 | 27.59 | -41,294 | 270,069 | 13.26 | 17 |
| Mississippi | 12.23 | 12.84 | 32 | 39.02 | -109,889 | 14,172 | 88.58 | 40 |
| Missouri | 26.33 | 29.78 | 40 | 35.09 | -73,325 | 626,573 | 10.48 | 14 |
| Montana | 40.30 | 49.07 | 12 | 21.43 | -121,191 | 1,195,541 | 9.20 | 13 |
| Nebraska | 43.34 | 46.11 | 31 | 33.33 | -241,157 | 896,468 | 21.20 | 20 |
| Nevada | 2.32 | 2.45 | 3 | 17.65 | -4,743 | 677 | 87.51 | 39 |
| New Hampshire | 1.94 | 4.36 | 2 | 20.00 | -51 | 2,806 | 1.79 | 7 |
| New Jersey | 19.31 | 22.57 | 8 | 42.11 | -3,552 | 16,329 | 17.87 | 18 |
| New Mexico | 6.85 | 7.58 | 8 | 24.24 | -25.276 | 57,515 | 30.53 | 35 |
| New York | 6.64 | 7.88 | 13 | 22.41 | -25,276 | 57,515 | 30.53 | 25 |
| North Carolina | 39.59 | 38.18 | 50 | 50.00 | -143,121 | 29,407 | 82.96 | 36 |
| North Dakota | 28.91 | 27.83 | 30 | 56.60 | -602,422 | -69,740 | 113.09 | 43 |
| Ohio | 39.81 | 38.94 | 44 | 50.00 | -231,239 | -9,941 | 104.49 | 42 |
| Oklahoma | 20.70 | 17.88 | 51 | 66.23 | -369,074 | -239,454 | 284.74 | 48 |
| Oregon | 15.19 | 21.09 | 8 | 22.22 | -9.202 | 283,076 | 3.15 | 8 |
| Pennsylvania | 30.34 | 34.64 | 14 | 20.90 | -28,043 | 233,414 | 10.73 | 15 |
| Rhode Island | 3.70 | 4.89 | 1 | 20.00 | -384 | -116 | 143.28 | 46 |
| South Carolina | 27.39 | 30.36 | 14 | 30.43 | -18,561 | 79,716 | 18.89 | 19 |
| South Dakota | 37.39 | 38.64 | 29 | 43.94 | -301,725 | 504,106 | 37.44 | 28 |
| Tennessee | 39.54 | 44.32 | 23 | 24.21 | -86,420 | 235,537 | 26.84 | 22 |
| Texas | 8.84 | 8.25 | 117 | 46.43 | -552,483 | -152,923 | 138.27 | 45 |
| Utah | 2.62 | 3.96 | 7 | 24.14 | -1,333 | 22,068 | 5.70 | 9 |
| Vermont | 2.12 | 5.90 | 0 | 0.00 | 0 | 17,240 | 0.00 | 1 |
| Virginia | 31.95 | 33.12 | 39 | 39.80 | -21,715 | 65,939 | 24.77 | 21 |
| Washington | 10.70 | 15.68 | 8 | 20.51 | -3,535 | 368,550 | 0.95 | 6 |
| West Virginia | 7.23 | 7.20 | 17 | 32.08 | -3,562 | 9,188 | 27.94 | 24 |
| Wisconsin | 17.86 | 22.09 | 10 | 14.29 | -28,500 | 454,096 | 5.91 | 11 |
| Wyoming | 3.80 | 5.80 | 4 | 17.39 | -3,819 | 57,923 | 6.19 | 12 |
| US Total | 24.76 | 26.35 | 1084 | 35.49 | -5,155,867 | 7,936,833 | 39.38 | |
a Adoption rate calculated as no-till area divided by total cropland area. Total cropland includes cropland harvested, crop failure, cultivated summer fallow, cropland used only for pasture, and idle cropland.
b Percent of counties calculated with respect to all counties in the state (including counties with missing data).
cEfficiency ranking with respect to disadoption ratio.
Source: Authors’ calculations based on Census of Agriculture (USDA 2014, 2019).

